Market Overview
| Study Period | 2021 - 2031 |
|---|---|
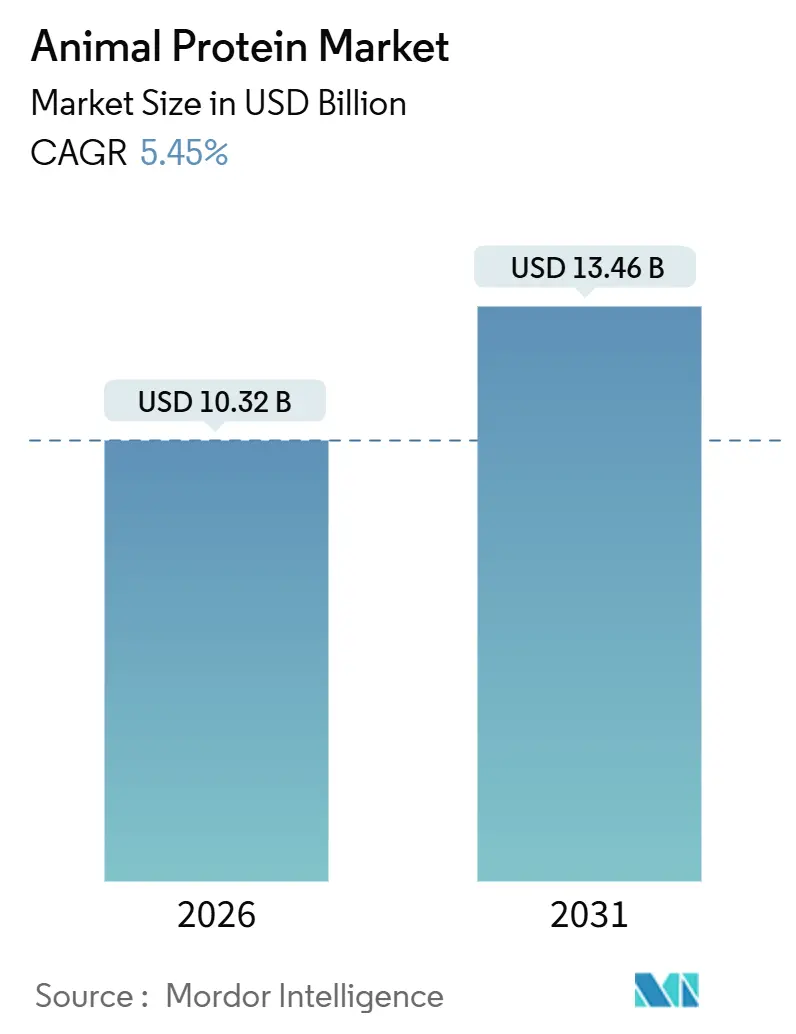
| Market Size (2025) | USD 10.32 Billion |
| Market Size (2031) | USD 13.46 Billion |
| Growth Rate (2026 - 2031) | 5.45% CAGR |
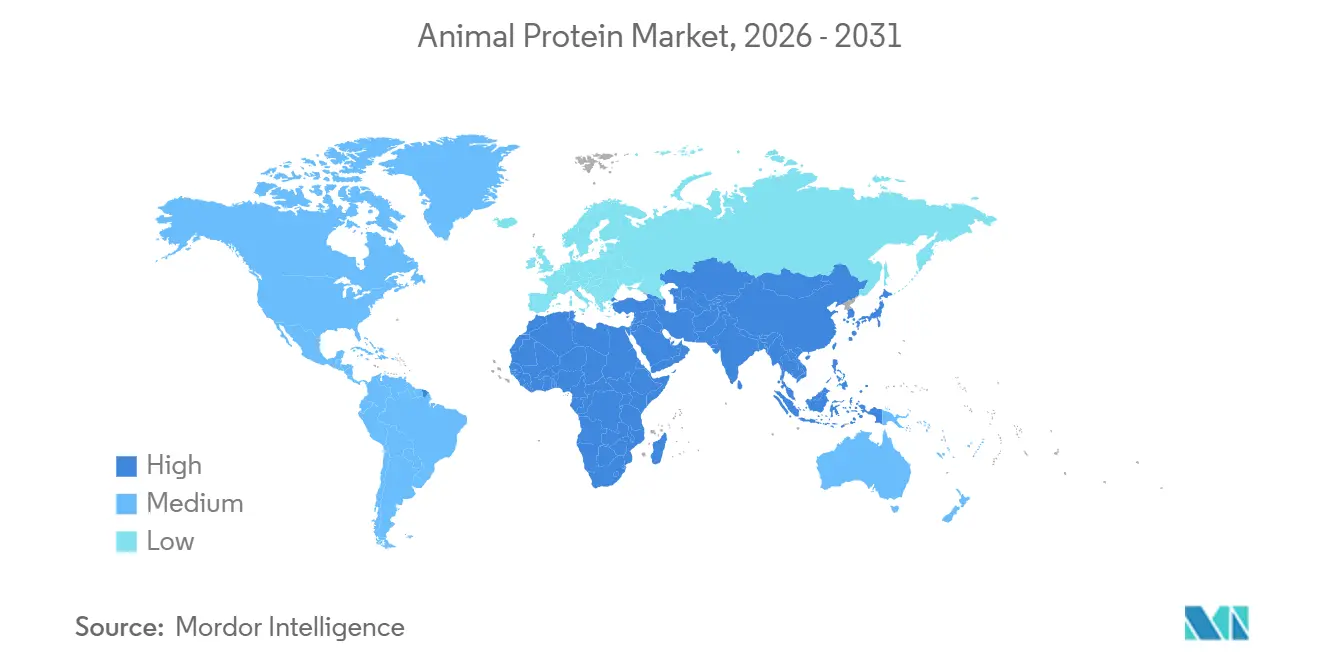
| Fastest Growing Market | Asia Pacific |
| Largest Market | North America |
| Market Concentration | Medium |
Major Players
*Disclaimer: Major Players sorted in no particular order Image © Mordor Intelligence. Reuse requires attribution under CC BY 4.0. |
|
Animal Protein Market Analysis by Mordor Intelligence
The global animal protein market is projected to grow significantly, reaching USD 10.32 billion in 2026 and expanding to USD 13.46 billion by 2031, with a compound annual growth rate (CAGR) of 5.45% during the forecast period. This growth is driven by increasing consumer awareness of health, nutrition, and functional wellness, alongside shifting dietary preferences favoring high-quality, bioavailable protein sources. The market is further supported by the rising adoption of protein-fortified foods and beverages, dietary supplements, and functional nutrition products, aligned with a global emphasis on fitness, active lifestyles, and preventive healthcare. Technological advancements, including membrane filtration, enzymatic hydrolysis, and peptide fractionation, are enabling manufacturers to produce animal proteins with improved functionality, solubility, and specific health benefits, broadening their appeal across various consumption scenarios.
Key Report Takeaways
- By protein type, whey led the animal protein market with 25.56% of the market share in 2025, while collagen is projected to scale at a 5.76% CAGR through 2031.
- By category, conventional proteins accounted for 81.23% of 2025 revenue, whereas organic variants are on track for a 6.23% CAGR to 2031.
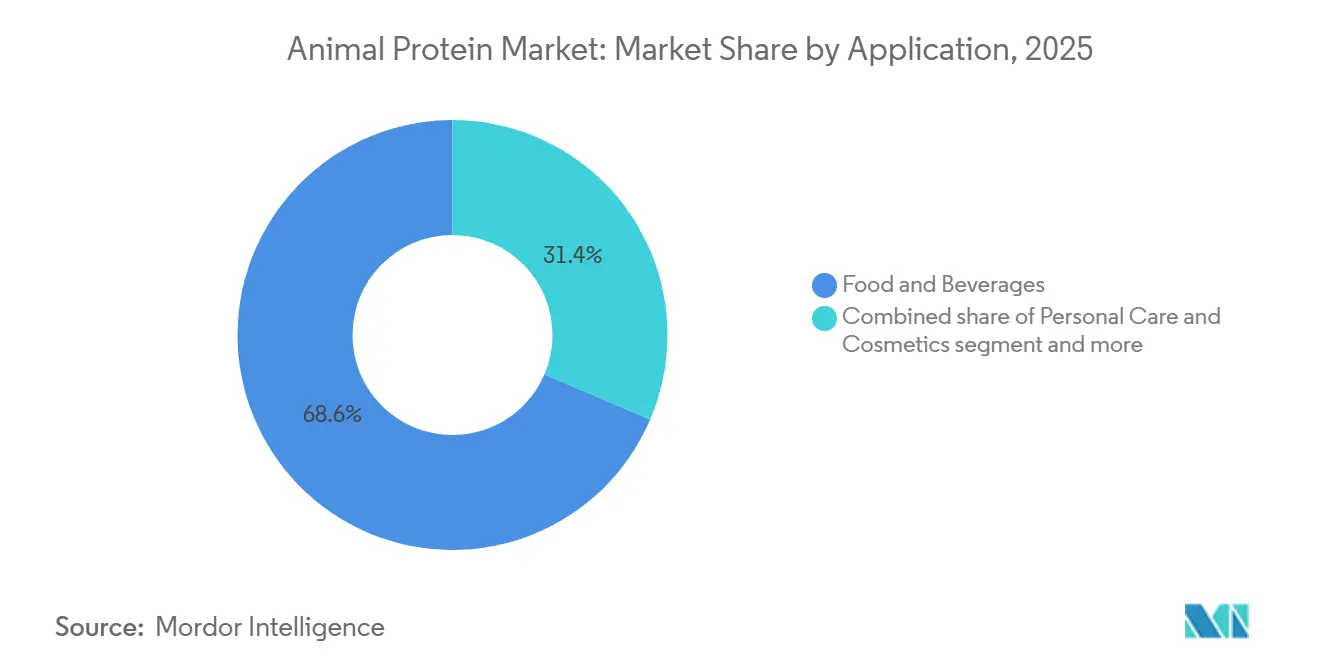
- By application, food and beverages captured 68.58% of the 2025 demand; personal care and cosmetics are poised for the fastest growth, with a 5.98% CAGR into 2031.
- By geography, North America dominated with 30.87% revenue share in 2025, yet Asia-Pacific is forecast to post a 6.15% CAGR through 2031.
Note: Market size and forecast figures in this report are generated using Mordor Intelligence’s proprietary estimation framework, updated with the latest available data and insights as of January 2026.
Global Animal Protein Market Trends and Insights
Drivers Impact Analysis
| Driver | (~) % Impact on CAGR Forecast | Geographic Relevance | Impact Timeline |
|---|---|---|---|
| Growing fitness culture driving protein demand | +1.2% | Global, with concentration in North America, Europe, and urban Asia-Pacific | Medium term (2-4 years) |
| Urbanization and evolving lifestyles | +0.8% | Asia-Pacific core, Latin America, Middle East and Africa | Long term (≥ 4 years) |
| Product and technology innovation | +1.0% | Global, led by North America and Europe Research and Develoment hubs | Short term (≤ 2 years) |
| Aquaculture and seafood growth | +0.7% | Asia-Pacific (China, India, Indonesia, Vietnam), spill-over to Latin America | Medium term (2-4 years) |
| Sustainability and positioning responses | +0.6% | Europe (regulatory pressure), North America (corporate mandates), emerging in Asia-Pacific | Long term (≥ 4 years) |
| Functional and nutraceutical protein use | +0.9% | North America, Europe, Japan, South Korea | Medium term (2-4 years) |
| Source: Mordor Intelligence | |||
Growing fitness culture driving protein demand
The global rise in fitness culture has become a significant structural driver for the animal protein market, transforming protein consumption from a niche sports nutrition component into a mainstream dietary necessity. Growing participation in gym workouts, strength training, functional fitness, endurance sports, and wellness programs has heightened awareness of protein's role in muscle development, recovery, weight management, metabolic health, and active aging. Animal proteins are particularly preferred in fitness-focused diets due to their complete amino acid profiles, high bioavailability, and fast digestibility, making them essential for pre- and post-workout nutrition. This shift has fueled demand for products such as protein powders, ready-to-drink shakes, fortified dairy items, bars, and high-protein foods, expanding protein consumption beyond professional athletes to include recreational gym-goers, older adults, and health-conscious individuals. The impact of this trend is especially pronounced in developed markets. For example, the Health and Fitness Association reported approximately 77 million fitness center and health club members in the United States in 2024, highlighting a substantial and engaged consumer base driving sustained demand for high-quality animal proteins [1]Source: Health and Fitness Association, "Number of members at fitness centers and health clubs in the United States", healthandfitness.org.
Urbanization and evolving lifestyles
Rapid urbanization and changes in consumer lifestyles are key demand-side drivers for the global animal protein market, influencing consumption patterns in terms of timing, formats, and preferences. As populations increasingly concentrate in urban and peri-urban areas, daily routines have become more time-constrained and convenience-focused, often structured around work-centric schedules. This has led to a growing preference for ready-to-eat, ready-to-drink, and portable food solutions. Animal proteins are particularly suited to these trends due to their functional versatility, nutritional density, and compatibility with processed and convenience food formats. Urban consumers also demonstrate greater awareness of nutrition, fitness, and preventive health, driving demand for protein-fortified products such as bakery items, beverages, breakfast cereals, and snacks. These products offer satiety and functional benefits while minimizing meal preparation time. Furthermore, evolving lifestyles, including higher workforce participation, longer commuting times, and the adoption of Westernized eating habits, are contributing to the increased integration of animal proteins into everyday meals and snacks, moving away from traditional, home-prepared diets.
Product and technology innovation
Product and technology innovation has become a key growth driver in the global animal protein market, enhancing the functional, nutritional, and commercial applications of animal-derived proteins beyond basic dietary supplementation. Advanced processing technologies, particularly membrane filtration and enzymatic hydrolysis, are transforming how animal proteins are fractionated, customized, and utilized. Techniques such as ultrafiltration and microfiltration allow whey to be precisely separated into concentrates, isolates, and bioactive peptides, each designed to provide specific functional benefits. Enzymatic hydrolysis further improves digestibility and bioavailability. A notable example of this innovation is Idaho Milk Products' receipt of the 2024 Breakthrough Award for Dairy Ingredient Innovation for IdaPlus 1090, a milk protein isolate developed for ready-to-drink beverages. This ingredient offers rapid cold-water solubility, maintains low viscosity over a 24-month shelf life, and eliminates the need for phosphate stabilizers, addressing persistent formulation challenges in high-protein beverages. Such advancements significantly reduce formulation complexities and enhance product performance.
Sustainability and positioning responses
Sustainability and strategic positioning have emerged as significant drivers in the global animal protein market, influencing production practices and brand value propositions in response to growing environmental, ethical, and regulatory pressures. Instead of hindering growth, sustainability requirements are fostering innovation, differentiation, and demand as producers focus on lower-impact production systems, resource efficiency, and transparent sourcing models. Animal protein manufacturers are increasingly adopting circular economy practices, such as utilizing by-products to minimize waste while creating high-value protein ingredients. These initiatives not only enhance environmental performance but also align with the needs of food, beverage, and supplement brands aiming to bolster their sustainability credentials without compromising on functionality or nutrition. Additionally, producers are improving carbon footprint reporting, water-use efficiency, and responsible feed sourcing, ensuring that animal proteins remain competitive under heightened scrutiny from regulators and consumers.
Restraints Impact Analysis
| Restraint | (~) % Impact on CAGR Forecast | Geographic Relevance | Impact Timeline |
|---|---|---|---|
| Environmental and climate pressures | -0.8% | Global, acute in Europe and North America | Medium term (2-4 years) |
| Regulatory and compliance burdens | -0.4% | Europe (EFSA), North America (FDA), Asia-Pacific (varied national authorities) | Short term (≤ 2 years) |
| Animal welfare and ethical concerns | -0.5% | Europe, North America, emerging in urban Asia-Pacific | Medium term (2-4 years) |
| Competitive and substitution pressures | -0.60% | Global, led by North America and Europe innovation hubs | Long term (≥ 4 years) |
| Source: Mordor Intelligence | |||
Environmental and climate pressures
Environmental and climate pressures pose a significant structural challenge to the global animal protein market, increasingly impacting production costs, regulatory requirements, and long-term supply stability. Livestock and dairy production face ongoing scrutiny due to their greenhouse gas emissions, high water consumption, land use intensity, and role in deforestation, particularly in areas with extensive cattle and feed crop operations. As climate change progresses, extreme weather events such as droughts, heatwaves, floods, and irregular rainfall patterns are directly affecting feed availability, animal health, and productivity. These factors contribute to higher mortality rates, inconsistent protein output, and increased operational risks. Such environmental challenges hinder the industry's ability to scale production efficiently, elevate costs, and add complexity to farming and processing operations, ultimately threatening the sector's resilience, profitability, and global competitiveness.
Regulatory and compliance burdens
Regulatory and compliance requirements pose a significant challenge to the global animal protein market, increasing complexity, costs, and operational risks throughout the value chain, including farming, processing, labeling, and cross-border trade. Producers in this market must adhere to strict regulations related to food safety, animal welfare, environmental standards, and traceability, which differ widely across regions and are subject to ongoing changes. Compliance with frameworks such as HACCP (Hazard Analysis and Critical Control Points), GMP (Good Manufacturing Practices), and ISO (International Organization for Standardization) standards, as well as veterinary drug regulations, maximum residue limits (MRLs), and mandatory allergen labeling, requires continuous investment in advanced quality management systems, third-party audits, regulatory documentation, and specialized compliance personnel. For multinational suppliers, navigating fragmented regulatory systems adds further complexity to product formulation and standardization, increases administrative workloads, and delays market entry timelines. These factors collectively limit scalability and profitability, even as demand for animal protein products continues to grow.
Segment Analysis
By Protein Type: Whey Dominance Meets Collagen Disruption
In 2025, whey protein accounted for a 25.56% share of the global animal protein market, establishing itself as the largest and most commercially significant protein type. This dominance is attributed to its nutritional benefits, formulation flexibility, and wide-ranging applications across industries. Whey protein's complete amino acid profile, high branched-chain amino acid (BCAA) content, rapid digestibility, and superior bioavailability make it a preferred choice in sports nutrition, functional foods, medical nutrition, and fortified beverages. Unlike slower-digesting proteins such as casein, whey aligns with modern consumer preferences for convenience, on-the-go nutrition, and immediate functional benefits, particularly in areas such as muscle recovery, weight management, and metabolic health.
Collagen is emerging as a significant growth segment in the global animal protein market, with a projected compound annual growth rate (CAGR) of 5.76% through 2031. This growth is driven by its expanding applications, alignment with health-focused consumption trends, and increasing use beyond traditional food products. Unlike conventional proteins often associated with muscle building or satiety, collagen is valued for its functional and structural health benefits, including improvements in skin elasticity, joint health, bone strength, gut health, and healthy aging. These attributes have positioned collagen as a key ingredient in dietary supplements, functional beverages, beauty-from-within products, and medical nutrition, catering to a growing consumer demand for preventive and holistic wellness solutions.

Note: Segment shares of all individual segments available upon report purchase
Get Detailed Market Forecasts at the Most Granular Levels
Download PDF
By Category: Organic Gains Ground Despite Premium Pricing
Conventional animal proteins accounted for a significant 81.23% share of the global animal protein market in 2025, highlighting their central role in meeting large-scale protein demand across food, feed, and industrial applications. This dominance is attributed to a well-established global production infrastructure, including intensive livestock farming, extensive dairy processing networks, and integrated meat and poultry supply chains. These systems enable high-volume, consistent, and cost-efficient protein production. Conventional production benefits from advancements in breeding, feed formulation, animal health management, and processing efficiency, allowing manufacturers to supply whey, milk proteins, gelatin, egg proteins, and other animal-derived proteins at the scale required by mass-market food and beverage manufacturers, animal feed producers, and ingredient formulators.
Organic animal proteins are experiencing accelerated growth within the global animal protein market, with a projected CAGR of 6.23% through 2031. This growth reflects a structural shift in consumer and manufacturer priorities toward clean-label, ethically produced, and transparency-focused protein sources. Unlike conventional proteins, organic animal proteins are produced under strict certification standards that prohibit the use of synthetic pesticides, genetically modified feed, antibiotics, and growth hormones. These practices enhance their appeal among health-conscious and ingredient-aware consumers. The segment's growth is further driven by increasing scrutiny of production practices, residue safety, and long-term health implications, particularly in developed markets where organic certification is associated with higher quality, improved animal welfare, and environmental responsibility.
By Application: Food Dominance, Personal Care Surge
Food and beverage applications are projected to account for a significant 68.58% of global animal protein demand in 2025, underscoring their position as the primary consumption channel and key value driver for animal-derived proteins worldwide. This substantial share is attributed to the essential role of animal proteins in daily dietary staples and processed food categories, such as dairy products, bakery items, beverages, breakfast cereals, confectionery, sauces, and ready-to-eat foods. The demand is further driven by the growing trend of protein fortification in mainstream food and beverage products, as manufacturers increasingly use animal proteins to improve nutritional profiles while maintaining taste and product stability.
Personal care and cosmetics represent the fastest-growing application for animal proteins, with a projected CAGR of 5.98% through 2031. This growth is fueled by the integration of nutrition, beauty, and functional wellness into consumer lifestyles. The segment's expansion is primarily driven by the increasing use of protein-based bioactive ingredients, such as collagen, gelatin, and milk-derived proteins, in both topical formulations and ingestible beauty products. Additionally, the global "beauty-from-within" trend, which emphasizes holistic solutions linking external appearance with internal health, has significantly boosted demand for collagen-enriched drinks, powders, capsules, and gummies. This growth is supported by robust consumer spending on personal care products. For example, according to the Office for National Statistics (UK), consumer spending on personal care in the United Kingdom reached approximately GBP 41.9 billion in 2024, demonstrating the scale and resilience of demand in established beauty markets [2]Source: Office for National Statistics (UK), "Consumer spending on personal care in the United Kingdom", ons.gov.uk.
Note: Segment shares of all individual segments available upon report purchase
Get Detailed Market Forecasts at the Most Granular Levels
Download PDF
Geography Analysis
North America accounted for 30.87% of the global animal protein market share in 2025, making it the largest regional contributor. This dominance is supported by a well-developed protein consumption ecosystem and advanced processing infrastructure. The United States plays a pivotal role, driven by its mature sports and active nutrition industry, where whey protein has become a mainstream dietary component. Its usage extends beyond athletes to everyday consumers focusing on muscle health, weight management, and functional wellness. The widespread availability of protein-enriched beverages, bars, dairy products, and supplements sustains high per-capita whey protein consumption. Additionally, established dairy cooperatives and vertically integrated processing networks in the United States and Canada ensure consistent raw material supply, cost efficiencies, and large-scale production of whey, milk proteins, and casein.
The Asia-Pacific region is projected to be the fastest-growing market, with a compound annual growth rate (CAGR) of 6.15% through 2031. This growth is driven by rapid dietary evolution and increasing protein awareness in key emerging economies. China and India are leading this expansion, supported by rising middle-class incomes that enable higher consumption of protein-fortified foods, dairy-based beverages, nutritional supplements, and functional nutrition products. Urbanization, changing lifestyles, and greater participation in fitness and preventive healthcare are further boosting demand for whey, milk proteins, and collagen across both mainstream and premium categories. Additionally, investments by regional governments and industry stakeholders in local dairy processing capacity, cold-chain infrastructure, and nutrition education are improving the accessibility and affordability of animal protein products.
Europe, South America, and the Middle East & Africa collectively account for the remaining share of the global animal protein market, each contributing through unique structural and consumption dynamics. Europe is distinguished by its mature dairy processing ecosystem and strong downstream demand in food, supplements, and clinical nutrition. According to the Organisation for Economic Co-operation and Development (OECD), whey powder consumption in Europe reached 1.53 billion tons in 2024, highlighting the region’s central role in global whey utilization and value-added protein applications [3]Source: Organisation for Economic Co-operation and Development (OECD), "volume of whey powder consumed in the European Union", oecd.org. South America benefits from a robust livestock base and export-oriented protein production, which supports steady growth in food and ingredient supply chains. Meanwhile, the Middle East and Africa are experiencing gradual market expansion, driven by dietary diversification, increasing nutrition awareness, and rising demand for fortified and halal-certified protein products, particularly in urban areas.
Get Analysis on Important Geographic Markets
Download PDF
Competitive Landscape
The global animal protein market demonstrates a bifurcated competitive structure, with varying levels of concentration across key protein categories. The whey and casein segments are highly consolidated, primarily dominated by large dairy cooperatives such as Arla Foods amba, Fonterra Co-operative Group, and Royal FrieslandCampina NV. These companies leverage their direct access to upstream milk supplies and long-established farmer networks to maintain a competitive edge. They possess the capital, technical expertise, and operational scale required to implement advanced technologies like membrane filtration, ultrafiltration, and spray-drying. This enables them to produce high-purity whey isolates, caseinates, and functional dairy proteins with efficiency and consistency, catering to the growing demand for high-quality protein products.
The vertically integrated models adopted by these major players create significant entry barriers for new competitors. Challenges such as securing raw material supplies, managing processing costs, adhering to stringent regulatory requirements, and establishing global distribution networks make it difficult for smaller or new entrants to compete effectively. These barriers not only protect the market share of established players but also reinforce the consolidated nature of the whey and casein segments. As a result, the competitive landscape in these categories remains heavily skewed toward large cooperatives with extensive resources and infrastructure.
Despite the high level of consolidation, opportunities exist for mid-sized players to carve out a niche in the market. By targeting premium, application-specific segments rather than competing on commodity volumes, these companies can differentiate themselves and gain a foothold. This structural diversity introduces varied competitive dynamics within the broader animal protein market, contrasting sharply with the cooperative-dominated dairy protein landscape. The gradual increase in consolidation through acquisitions and strategic partnerships further shapes the competitive environment, offering both challenges and opportunities for players across the value chain.
Animal Protein Industry Leaders
-
Agrial Enterprise
-
Arla Foods amba
-
Darling Ingredients Inc.
-
Fonterra Co-operative Group
-
Gelita AG
- *Disclaimer: Major Players sorted in no particular order
Need More Details on Market Players and Competitors?
Download PDF
Recent Industry Developments
- December 2025: Elmentoz Secured USD 4.5 Million to Establish India’s Largest Insect Protein Facility and Eliminate Antibiotics in Animal Feed. The facility will have the capacity to process 2,000 metric tons of industrial byproducts per month using proprietary advanced automation technologies.
- March 2025: Vivici has introduced ViviteinTM BLG to the United States market. ViviteinTM BLG, referred to as the New Standard of Protein, is a dairy protein produced through precision fermentation without the involvement of animals in the production process.
- November 2024: Arla Foods Ingredients has introduced a new whey protein hydrolysate designed to offer an improved taste profile compared to similar ingredients used in peptide-based medical nutrition. The highly hydrolyzed whey protein product, Lacprodan DI-3092, enables the inclusion of 10g of high-quality single-source protein in a 100ml serving.
- March 2024: Glanbia PLC, through its brand Isopure, introduced a new product to the Isopure portfolio: Collagen Peptides. This product is designed to support healthy joints, hair, skin, and nails, while also providing immune support. Each scoop contains 20 grams of collagen peptides.
Global Animal Protein Market Report Scope
Animal protein refers to proteins obtained from natural sources, including meat, eggs, milk, fish, and insects, which are widely used in various industries.
The animal protein market is segmented based on the protein type, category, application, and geography. Based on protein type, the market is segmented into casein and caseinates, collagen, egg protein, gelatin, insect protein, milk protein, whey protein, and other animal protein. Based on category, the market is segmented into conventional and organic. Based on the application, the market is segmented into animal feed, personal care and cosmetics, food and beverages, and supplements. The food and beverages segment is further segmented into bakery, beverages, breakfast cereals, condiments/sauces, confectionery, dairy and dairy alternative products, RTE/RTC food products, and others.
The report provides market size and forecasts in both value (USD) and volume (tons) for all the mentioned segments.
By Protein Type
| Casein and Caseinates |
| Collagen |
| Egg Protein |
| Gelatin |
| Insect Protein |
| Milk Protein |
| Whey Protein |
| Other Animal Protein |
By Category
| Conventional |
| Organic |
By Application
| Animal Feed | |
| Personal Care and Cosmetics | |
| Food and Beverages | Bakery |
| Beverages | |
| Breakfast Cereals | |
| Condiments/Sauces | |
| Confectionery | |
| Dairy and Dairy Alternatives Products | |
| RTE/RTC Food Products | |
| Others | |
| Supplements |
By Geography
| North America | United States |
| Canada | |
| Mexico | |
| Rest of North America | |
| Europe | Germany |
| United Kingdom | |
| Italy | |
| France | |
| Spain | |
| Netherlands | |
| Poland | |
| Belgium | |
| Sweden | |
| Rest of Europe | |
| Asia-Pacific | China |
| India | |
| Japan | |
| Australia | |
| Indonesia | |
| South Korea | |
| Thailand | |
| Singapore | |
| Rest of Asia-Pacific | |
| South America | Brazil |
| Argentina | |
| Colombia | |
| Chile | |
| Peru | |
| Rest of South America | |
| Middle East and Africa | South Africa |
| Saudi Arabia | |
| United Arab Emirates | |
| Nigeria | |
| Egypt | |
| Morocco | |
| Turkey | |
| Rest of Middle East and Africa |
| By Protein Type | Casein and Caseinates | |
| Collagen | ||
| Egg Protein | ||
| Gelatin | ||
| Insect Protein | ||
| Milk Protein | ||
| Whey Protein | ||
| Other Animal Protein | ||
| By Category | Conventional | |
| Organic | ||
| By Application | Animal Feed | |
| Personal Care and Cosmetics | ||
| Food and Beverages | Bakery | |
| Beverages | ||
| Breakfast Cereals | ||
| Condiments/Sauces | ||
| Confectionery | ||
| Dairy and Dairy Alternatives Products | ||
| RTE/RTC Food Products | ||
| Others | ||
| Supplements | ||
| By Geography | North America | United States |
| Canada | ||
| Mexico | ||
| Rest of North America | ||
| Europe | Germany | |
| United Kingdom | ||
| Italy | ||
| France | ||
| Spain | ||
| Netherlands | ||
| Poland | ||
| Belgium | ||
| Sweden | ||
| Rest of Europe | ||
| Asia-Pacific | China | |
| India | ||
| Japan | ||
| Australia | ||
| Indonesia | ||
| South Korea | ||
| Thailand | ||
| Singapore | ||
| Rest of Asia-Pacific | ||
| South America | Brazil | |
| Argentina | ||
| Colombia | ||
| Chile | ||
| Peru | ||
| Rest of South America | ||
| Middle East and Africa | South Africa | |
| Saudi Arabia | ||
| United Arab Emirates | ||
| Nigeria | ||
| Egypt | ||
| Morocco | ||
| Turkey | ||
| Rest of Middle East and Africa | ||
Need A Different Region or Segment?
Customize Now
Market Definition
- End User - The Protein Ingredients Market operates on a B2B basis. Food, Beverages, Supplements, Animal Feed, and Personal Care & Cosmetic manufacturers are considered to be end-consumers in the market studied. The scope excludes manufacturers buying liquid/dry whey to be used for application as a binding agent or thickener or other non-protein applications.
- Penetration Rate - Penetration Rate is defined as the percentage of Protein-Fortified End User Market Volume in the Overall End User Market Volume.
- Average Protein Content - Average protein content is the average protein content present per 100 g of product manufactured by all end-user companies considered under the scope of this report.
- End User Market Volume - End-user market volume is the consolidated volume of all types and forms of end-user products in the country or region.
| Keyword | Definition |
|---|---|
| Alpha-lactalbumin (α-Lactalbumin) | It is a protein that regulates the production of lactose in the milk of almost all mammalian species. |
| Amino acid | It is an organic compound that contains both amino and carboxylic acid functional groups, which are required for the synthesis of body protein and other important nitrogen-containing compounds, such as creatine, peptide hormones, and some neurotransmitters. |
| Blanching | It is the process of briefly heating vegetables with steam or boiling water. |
| BRC | British Retail Consortium |
| Bread improver | It is a flour-based blend of several components with specific functional properties designed to modify dough characteristics and give quality attributes to bread. |
| BSF | Black Soldier Fly |
| Caseinate | It is a substance produced by adding an alkali to acid casein, a derivative of casein. |
| Celiac disease | Celiac disease is an immune reaction to eating gluten, a protein found in wheat, barley, and rye. |
| Colostrum | It is a milky fluid that’s released by mammals that have recently given birth before breast milk production begins. |
| Concentrate | It is the least processed form of protein and has a protein content ranging from 40-90% by weight. |
| Dry protein basis | It refers to the percentage of "pure protein" present in a supplement after the water in it is completely removed through heat. |
| Dry whey | It is the product resulting from drying fresh whey which has been pasteurized and to which nothing has been added as a preservative. |
| Egg protein | It is a mixture of individual proteins, including ovalbumin, ovomucoid, ovoglobulin, conalbumin, vitellin, and vitellenin. |
| Emulsifier | It is a food additive that facilitates the blending of foods that are immiscible with one another, such as oil and water. |
| Enrichment | It is the process of addition of micronutrients that are lost during the processing of the product. |
| ERS | Economic Research Service of the USDA |
| Extrusion | It is the process of forcing soft mixed ingredients through an opening in a perforated plate or die designed to produce the required shape. The extruded food is then cut to a specific size by blades. |
| Fava | Also known as Faba, it is another word for yellow split beans. |
| FDA | Food and Drug Administration |
| Flaking | It is a process in which typically a cereal grain (like corn, wheat, or rice) is broken down into grits, cooked with flavors and syrups, and then pressed into flakes between cooled rollers. |
| Foaming agent | It is a food ingredient that makes it possible to form or maintain a uniform dispersion of a gaseous phase in a liquid or solid food. |
| Foodservice | It refers to the part of the food industry which includes businesses, institutions, and companies which prepare meals outside the home. It includes restaurants, school and hospital cafeterias, catering operations, and many other formats. |
| Fortification | It is the deliberate addition of micronutrients that are not found in them naturally or which are lost during processing, to improve a food product's nutritional value. |
| FSANZ | Food Standards Australia New Zealand |
| FSIS | Food Safety and Inspection Service |
| FSSAI | Food Safety and Standards Authority of India |
| Gelling agent | It is an ingredient that functions as a stabilizer and thickener to provide thickening without stiffness through the formation of gel. |
| GHG | Greenhouse Gas |
| Gluten | It is a family of proteins found in grains, including wheat, rye, spelt, and barley. |
| Hemp | It is a botanical class of Cannabis sativa cultivars grown specifically for industrial or medicinal use. |
| Hydrolysate | It is a form of protein manufactured by exposing the protein to enzymes that can partially break the bonds between the protein's amino acids and break down large, complicated proteins into smaller pieces. Its processing makes it easier and quicker to digest. |
| Hypoallergenic | It refers to a substance that causes fewer allergic reactions. |
| Isolate | It is the purest and most processed form of protein which has undergone separation to obtain a pure protein fraction. It typically contains ≥ 90% of protein by weight. |
| Keratin | It is a protein that helps form hair, nails, and the outer layer of skin. |
| Lactalbumin | It is the albumin contained in milk and obtained from whey. |
| Lactoferrin | It is an iron‑binding glycoprotein that is present in the milk of most mammals. |
| Lupin | It is the yellow legume seeds of the genus Lupinus. |
| Millenial | Also known as Generation Y or Gen Y, it refers to the people born from 1981 to 1996. |
| Monogastric | It refers to an animal with a single-compartmented stomach. Examples of monogastric include humans, poultry, pigs, horses, rabbits, dogs, and cats. Most monogastric are generally unable to digest much cellulose food materials such as grasses. |
| MPC | Milk protein concentrate |
| MPI | Milk protein isolate |
| MSPI | Methylated soy protein isolate |
| Mycoprotein | Mycoprotein is a form of single-cell protein, also known as fungal protein, derived from fungi for human consumption. |
| Nutricosmetics | It is a category of products and ingredients that act as nutritional supplements to care for skin, nails, and hair natural beauty. |
| Osteoporosis | It is a medical condition in which the bones become brittle and fragile from loss of tissue, typically as a result of hormonal changes, or deficiency of calcium or vitamin D. |
| PDCAAS | Protein digestibility-corrected amino acid score (PDCAAS) is a method of evaluating the quality of a protein based on both the amino acid requirements of humans and their ability to digest it. |
| Per-capita consumption of animal protein | It is the average amount of animal protein (such as milk, whey, gelatin, collagen, and egg proteins) that is readily available for consumption by each person in an actual population. |
| Per-capita consumption of plant protein | It is the average amount of plant protein (such as soy, wheat, pea, oat, and hemp proteins) that is readily available for consumption by each person in an actual population. |
| Quorn | It is a microbial protein manufactured using mycoprotein as an ingredient, in which the fungus culture is dried and mixed with egg albumen or potato protein, which acts as a binder, and then is adjusted in texture and pressed into various forms. |
| Ready-to-Cook (RTC) | It refers to food products that include all of the ingredients, where some preparation or cooking is required through a process that is given on the package. |
| Ready-to-Eat (RTE) | It refers to a food product prepared or cooked in advance, with no further cooking or preparation required before being eaten. |
| RTD | Ready-to-Drink |
| RTS | Ready-to-Serve |
| Saturated fat | It is a type of fat in which the fatty acid chains have all single bonds. It is generally considered unhealthy. |
| Sausage | It is a meat product made of finely chopped and seasoned meat, which may be fresh, smoked, or pickled and which is then usually stuffed into a casing. |
| Seitan | It is a plant-based meat substitute made out of wheat gluten. |
| Softgel | It is a gelatin-based capsule with a liquid fill. |
| SPC | Soy protein concentrate |
| SPI | Soy protein isolate |
| Spirulina | It is a biomass of cyanobacteria that can be consumed by humans and animals. |
| Stabilizer | It is an ingredient added to food products to help maintain or enhance their original texture, and physical and chemical characteristics. |
| Supplementation | It is the consumption or provision of concentrated sources of nutrients or other substances that are intended to supplement nutrients in the diet and is intended to correct nutritional deficiencies. |
| Texturant | It is a specific type of food ingredient that is used to control and alter the mouthfeel and texture of food and beverage products. |
| Thickener | It is an ingredient that is used to increase the viscosity of a liquid or dough and make it thicker, without substantially changing its other properties. |
| Trans fat | Also called trans-unsaturated fatty acids or trans fatty acids, it is a type of unsaturated fat that naturally occurs in small amounts in meat. |
| TSP | Textured soy protein |
| TVP | Textured vegetable protein |
| WPC | Whey protein concentrate |
| WPI | Whey protein isolate |
Need More Details on Market Definition?
Ask a Question
Research Methodology
Mordor Intelligence follows a four-step methodology in all our reports.
- Step-1: Identify Key Variables: The quantifiable key variables (industry and extraneous) pertaining to the specific product segment and country are selected from a group of relevant variables & factors based on desk research & literature review; along with primary expert inputs. These variables are further confirmed through regression modeling (wherever required).
- Step-2: Build a Market Model: In order to build a robust forecasting methodology, the variables and factors identified in Step-1 are tested against available historical market numbers. Through an iterative process, the variables required for market forecast are set and the model is built on the basis of these variables.
- Step-3: Validate and Finalize: In this important step, all market numbers, variables and analyst calls are validated through an extensive network of primary research experts from the market studied. The respondents are selected across levels and functions to generate a holistic picture of the market studied.
- Step-4: Research Outputs: Syndicated Reports, Custom Consulting Assignments, Databases & Subscription Platforms

Get More Details On Research Methodology
Download PDF


