
Agricultural Colorants Market Size and Share
Market Overview
| Study Period | 2021 - 2031 |
|---|---|
| Market Size (2026) | USD 1.95 Billion |
| Market Size (2031) | USD 2.91 Billion |
| Growth Rate (2026 - 2031) | 8.34 % |
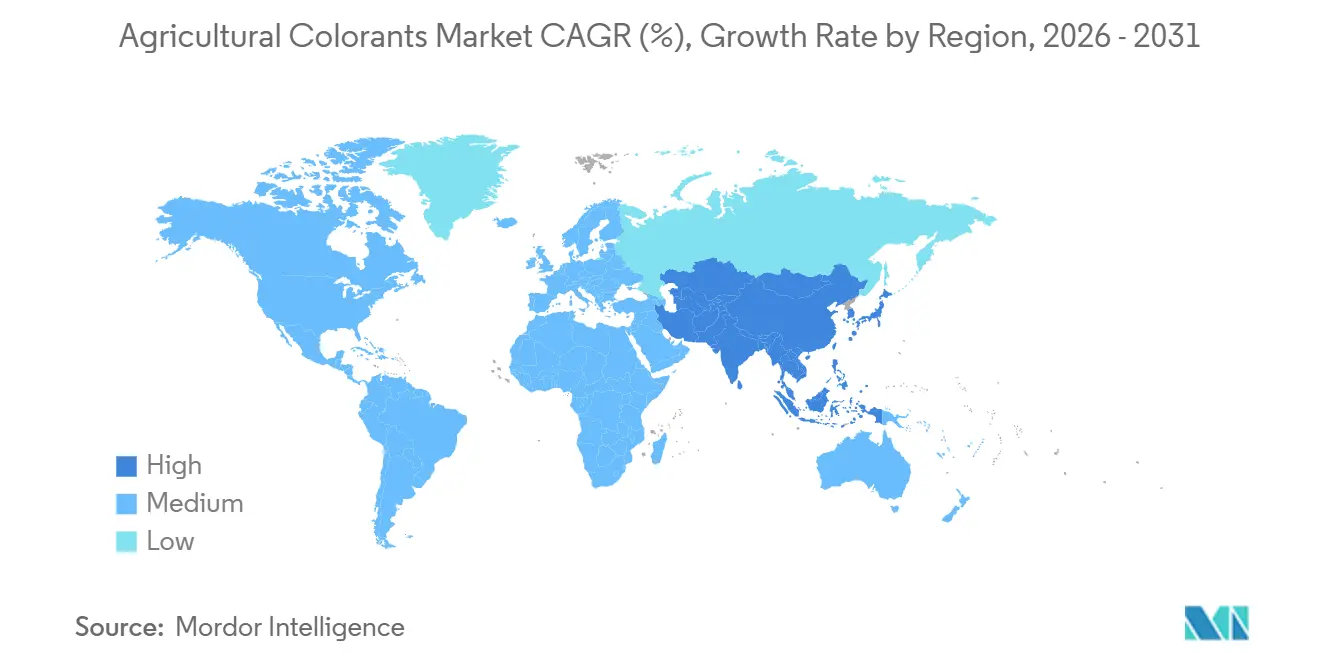
| Fastest Growing Market | Asia-Pacific |
| Largest Market | North America |
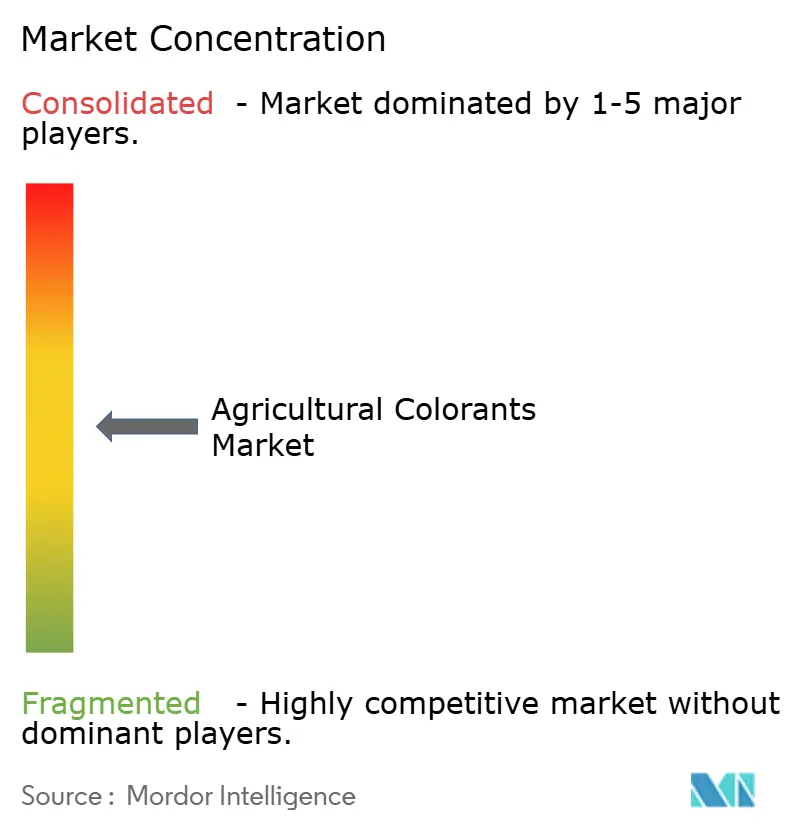
| Market Concentration | Medium |
Major Players *Disclaimer: Major Players sorted in no particular order Image © Mordor Intelligence. Reuse requires attribution under CC BY 4.0. | |
Agricultural Colorants Market Analysis by Mordor Intelligence
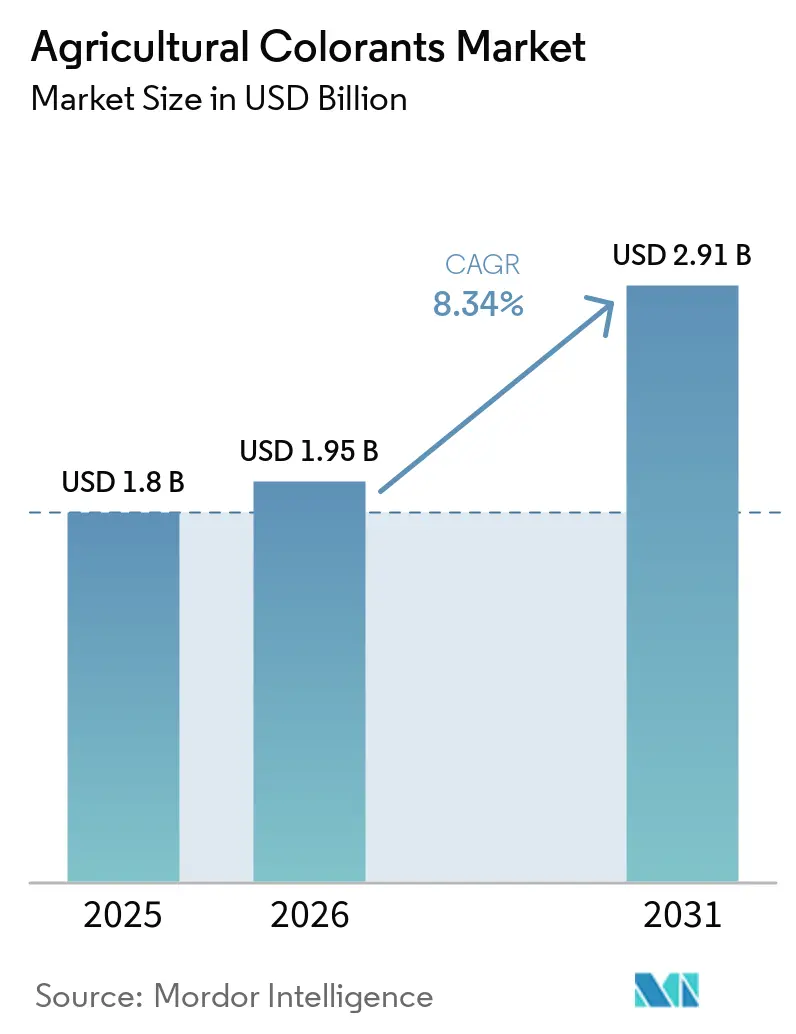
The agricultural colorants market size was valued at USD 1.8 billion in 2025 and is forecast to grow from USD 1.95 billion in 2026 to USD 2.91 billion by 2031, at a CAGR of 8.34% during the forecast period (2026 to 2031). The market growth is driven by stricter pesticide-labeling regulations, increased adoption of precision agriculture, and a shift toward microplastic-free seed coatings. In 2025, dyes remained the dominant segment. However, European chemical regulations, including REACH requirements affecting certain hazardous pigment substances, are encouraging the adoption of compliant pigment alternatives. North America benefits from established seed-treatment practices, while the Asia-Pacific region is experiencing growth driven by India's new Seed Act and the expansion of contract farming in China. Liquid formulations hold the largest revenue share due to their compatibility with automated coating lines, while granular colorants are becoming increasingly relevant in controlled-release fertilizer systems.
Key Report Takeaways
- By product type, dyes accounted for 54% of the agricultural colorants market share in 2025, while pigments are forecast to grow at an 11.2% CAGR from 2026 to 2031.
- By application, seed treatment colorants accounted for 41% of the agricultural colorants market size in 2025, while crop protection chemical colorants are forecast to grow at a CAGR of 12.7% from 2026 to 2031.
- By form, liquids accounted for 54% of market share in 2025, while granules are forecast to grow at a 10.5% CAGR from 2026 to 2031.
- By crop type, cereals and grains accounted for 38% of the market share in 2025, while pulses are forecast to grow at a CAGR of 9.6% from 2026 to 2031.
- By geography, North America accounted for 32% of the market share in 2025, while Asia-Pacific is forecast to grow at a CAGR of 10.8% from 2026 to 2031.
Note: Market size and forecast figures in this report are generated using Mordor Intelligence’s proprietary estimation framework, updated with the latest available data and insights as of January 2026.
Global Agricultural Colorants Market Trends and Insights
Drivers Impact Analysis*
| Driver | (~) % Impact on CAGR Forecast | Geographic Relevance | Impact Timeline |
|---|---|---|---|
| Mandatory Seed-Color Coding Under Pesticide Regulations | +1.8% | North America, Europe, and India | Medium term (2-4 years) |
| Demand for Visible Markers in Precision Agriculture | +1.5% | Global, especially North America and Asia-Pacific | Short term (≤ 2 years) |
| Adoption of Spray Indicator Dyes for Drones and Autonomous Sprayers | +1.2% | North America, Europe, Brazil, and Australia | Short term (≤ 2 years) |
| Regulatory Push for Low-Dust, High-Load Seed Coatings | +0.9% | Europe and North America | Medium term (2-4 years) |
| UV-Traceable Colorants for Pesticide Coverage Audit | +0.7% | North America, Europe, and select Asia-Pacific markets | Medium term (2-4 years) |
| Invisible Taggants for AI-Based Supply Chain Authentication | +0.5% | Global premium seed markets | Long term (≥ 4 years) |
| Source: Mordor Intelligence | |||
Mandatory Seed-Color Coding Under Pesticide Regulations
According to the Department of Pesticide Regulation, regulators are incorporating color-coding requirements into seed supply chains. In the United States, federal regulations mandate the differentiation of treated seeds, and California further strengthened these standards in 2025 for neonicotinoids, specifying distinct colors to minimize pollinator exposure. Similarly, India’s Seed Act of 2026 introduces monetary penalties of INR 3 million (USD 36,000) and requires QR-traceable packaging, effectively mandating the use of visible colorants for market entry. Penetration rates have increased in mature regions but remain lower in Southeast Asia and parts of Africa, providing opportunities driven by compliance requirements.
Demand for Visible Markers in Precision Agriculture
Computer-vision sprayers utilize contrast dyes to verify application patterns. John Deere’s See and Spray Ultimate, deployed on most units across North America in 2023, uses indicator dyes to confirm coverage on dark soils. According to Ecorobotix, Swiss trials with the company's ARA precision sprayer demonstrated a 95% reduction in chemical use in 2024. The market is experiencing divergence, with large row-crop growers favoring economical blue dyes, while specialty-crop producers are opting for UV-traceable blends that enable drone-based coverage mapping.
Adoption of Spray Indicator Dyes for Drones and Autonomous Sprayers
Drone spraying technology is advancing in terms of viscosity and visibility requirements. DJI’s Agras T70P, which accounts for a significant share of China’s agricultural drone market, requires indicator dyes with viscosities below a specific threshold to prevent clogging. Precision Planting’s SymphonyVision uses live camera feedback to optimize spray patterns by adjusting nozzle output in real time, minimizing overlap and improving herbicide application efficiency. Similarly, agricultural foam marker systems are commonly formulated with surfactants and stabilizing agents, often supplemented with colorants to improve field visibility and application precision.
Regulatory Push for Low-Dust, High-Load Seed Coatings
European microplastics legislation limits the intentional use of microplastics in seed coatings, driving demand for biodegradable polymers and water-based dyes. BASF introduced the Sokalan CP 301 dispersant in 2025, designed to suspend pigments in polycaprolactone binders while meeting Green Deal biodegradability standards [1]. Olmix’s Inka NATURE Range utilizes algae binders combined with organic pigments, reducing dust-off during maize trials. With high-load coatings that integrate fungicides, insecticides, and colorants in a single application, pigments must remain stable at active-ingredient concentrations during extended storage.
Restraints Impact Analysis*
| Restraint | (~) % Impact on CAGR Forecast | Geographic Relevance | Impact Timeline |
|---|---|---|---|
| Petrochemical Dye Feedstock Price Volatility | -1.2% | Asia-Pacific and Europe | Short term (≤ 2 years) |
| Heavy-Metal and Volatile Organic Compound (VOC) Limits in Agrochemical Formulations | -0.9% | Europe and North America | Medium term (2-4 years) |
| Dye–Active-Ingredient Interaction Risks | -0.6% | Global herbicide and fungicide uses | Medium term (2-4 years) |
| Seed Trait ID Technologies Reducing Color-Coding Needs | -0.4% | North America, Europe, and select Asia-Pacific | Long term (≥ 4 years) |
| Source: Mordor Intelligence | |||
Petrochemical Dye Feedstock Price Volatility
According to the United States Energy Information Administration, crude oil prices, which are closely tied to petrochemical derivatives, decreased by approximately 10% in 2023, reflecting notable fluctuations in upstream energy markets[2]. These variations directly influence the cost of dye intermediates, resulting in inconsistent pricing for agricultural colorant manufacturers and higher formulation costs for agrochemical companies. Furthermore, reliance on petrochemical-based inputs exposes the supply chain to risks such as geopolitical tensions, refinery disruptions, and regulatory challenges, exacerbating cost uncertainties. Although the industry is gradually exploring bio-based alternatives to reduce dependency, higher production costs and limited scalability continue to hinder their broader adoption.
Heavy-Metal and Volatile Organic Compound (VOC) Limits in Agrochemical Formulations
Volatility in petrochemical-derived feedstocks continues to impact the agricultural colorants market, as these materials are critical for producing synthetic dyes used in crop protection formulations and seed coatings. Government-supported environmental studies have highlighted that pesticide formulations, many of which utilize solvent-based carriers derived from petrochemicals, can significantly contribute to emissions. As regulatory efforts to reduce volatile organic compound (VOC) emissions from agricultural inputs intensify, manufacturers are facing rising costs for reformulation, sourcing compliant raw materials, and addressing supply chain disruptions. These factors collectively exacerbate price volatility in dye intermediates.
*Our forecasts treat driver/restraint impacts as directional, not additive. The impact forecasts reflect baseline growth, mix effects, and variable interactions.
Segment Analysis
By Product Type: Dyes Lead, Pigments Grow Fastest
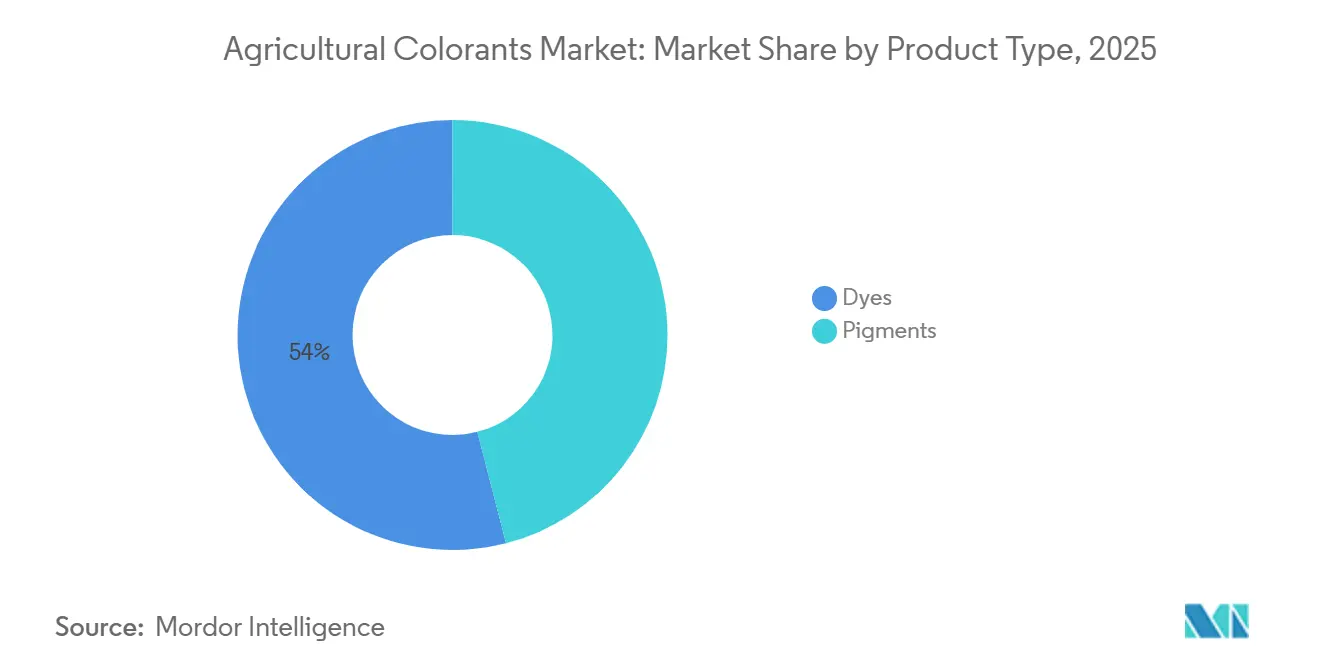
Dyes accounted for 54% of the agricultural colorants market in 2025. This dominance is attributed to their solubility, which is well-suited for high-speed aqueous seed-coating processes, enabling efficient and uniform application. Pigments are forecast to grow at a CAGR of 11.2% from 2026 to 2031. Pigments are preferred in applications requiring ultraviolet stability and heat resistance, such as polymer-coated fertilizers stored in elevated tropical temperatures, where durability and performance are critical.
Second-tier analysis indicates that incumbents are maintaining market continuity through the use of biodegradable dispersants. BASF SE’s Sokalan CP 301, introduced in 2025, supports pigment suspension within polycaprolactone binders, facilitating the shift away from microplastics. Pigment manufacturers are required to replace heavy-metal reds and yellows with iron oxides or advanced organic pigments that meet fade-resistance standards. Clariant AG’s Agrocer line demonstrates that organic reds can achieve comparable performance on cereals. However, the adoption of fertilizers remains limited due to higher costs compared to chromate pigments.

By Application: Seed Treatment Colorants Leads, Crop Protection Chemical Colorants Grow Fastest
Seed treatment colorants accounted for 41% of the agricultural colorants market share in 2025. This dominance is attributed to near-universal coverage of corn and soybean crops in established regions, as reported by the United States Department of Agriculture (USDA). Meanwhile, the crop protection chemical colorants segment is forecast to grow at a CAGR of 12.7% from 2026 to 2031. According to Precision Planting, field trials conducted in 2024 showed that SymphonyVision technology reduces herbicide waste by minimizing spray overlap and enabling real-time nozzle control, thereby improving application efficiency in row crop systems.
Application fragmentation corresponds with advancements in equipment. Seed treatment applications utilize liquid dyes that integrate effectively into polymer coatings, while fertilizer blenders prefer dust-free granules to minimize airborne particulates. Spray operators require rapidly fading liquid markers to prevent residue on fresh produce. Chromatech offers multiple compliance-cleared stock-keeping units to cater to these varied demands. Market share dynamics reflect the adoption of precision equipment as drone usage increases. Indicator dyes may reduce the volume gap with traditionally dominant seed treatment applications.
By Form: Liquids Dominate, Granules Ascend in Fertilizers
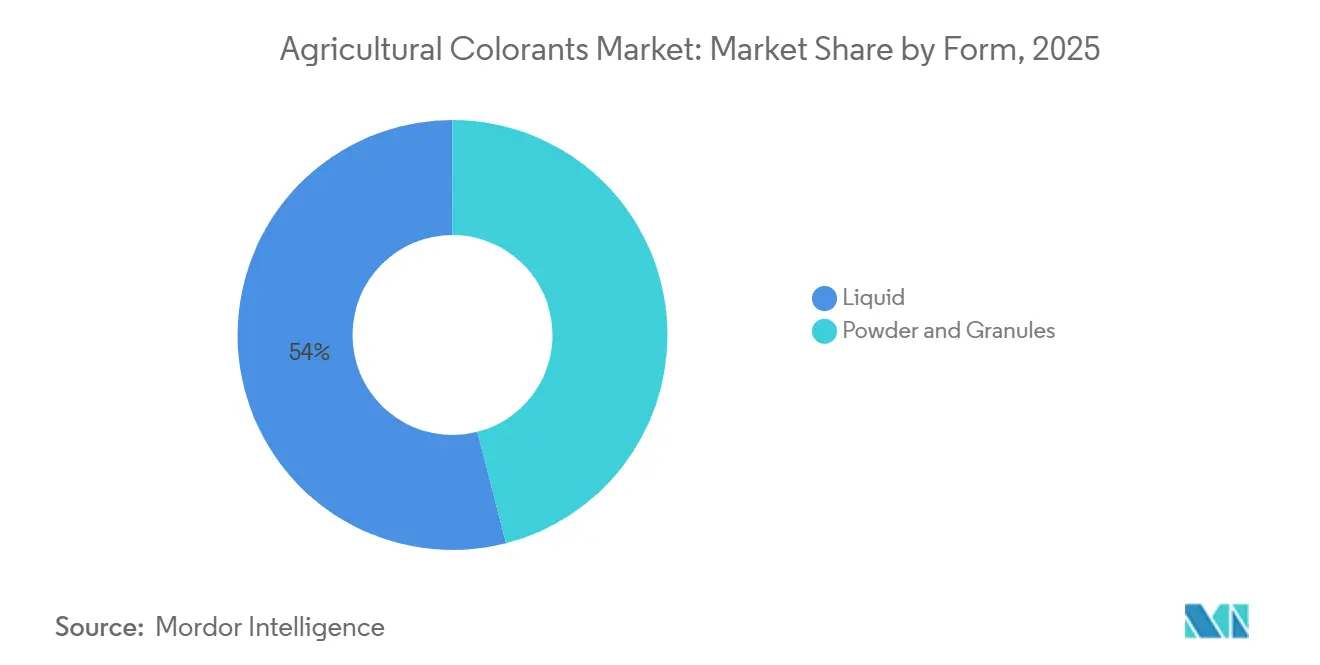
Liquid formulations accounted for 54% of the agricultural colorants market share in 2025. This dominance is attributed to their ease of application, uniform distribution, and compatibility with various agricultural products. Granules are forecast to grow at a CAGR of 10.5% from 2026 to 2031, driven by the increasing adoption of controlled-release fertilizer products, where dust-free handling is essential to ensure product efficiency and safety. Agrilead’s colorizer allows nutrient blenders to color-code formulations without contaminating mixers, enhancing operational efficiency, ensuring product stability, and usability.
Form preferences are determined by specific applications. Drones require liquids with lower viscosities to prevent nozzle clogging, while the use of powders in seed coatings is decreasing as operators transition to water-based polymers. Granular pigments are preferred in fertilizer plants due to their ability to withstand mechanical impacts, reducing product loss. Innovations in spray-dried bead technology have enhanced dispersibility but continue to carry a price premium compared to liquid forms. The long-term growth of granules is closely linked to fertilizer modernization programs in the Asia-Pacific region, where controlled-release products are growing annually, driving increased adoption of colorants.
By Crop Type: Cereals and Grains Lead, Pulses Accelerate
Cereals and grains accounted for 38% of the agricultural colorants market share in 2025. This dominance is supported by the expansion of mechanized corn, rice, and wheat acreage across multiple regions. Pulses are forecast to grow at a CAGR of 9.6% from 2026 to 2031. As countries progress in mechanizing pulse planting, the demand for visible coding to distinguish drought-tolerant germplasm is increasing. This coding helps identify and manage seeds better suited to challenging environmental conditions. A substantial share of soybean and canola seeds are already coated with fungicide-insecticide treatments, which not only protect the seeds but also enhance their visibility, sustaining steady demand for colorants.
Growth dynamics indicate a distinct segmentation in pricing strategies. High-volume cereal producers prioritize cost-effective synthetic dyes, while organic niche growers are willing to pay significantly more for botanical colorants. The implementation of the different seed acts, along with QR traceability, is driving the adoption of colorants in smallholder-dominated pulses and vegetable supply chains. Clariant enhances branding efforts by providing proprietary hues that seed companies can trademark, fostering stronger customer retention within the agricultural colorants market.
Geography Analysis
North America accounted for 32% of the agricultural colorants market in 2025, representing the largest regional share. This dominance is driven by widespread seed treatment practices in corn and regulatory requirements mandating visible distinctions. California is conducting pilot ultraviolet compliance audits, potentially driving demand for traceable pigments. In Canada, biodegradable coatings are being encouraged under Health Canada’s microplastic guidelines. In contrast, Mexico has limited seed-coloration coverage, primarily due to the dominance of smallholder farms. However, vegetable exporters in Sinaloa are implementing spray indicators to minimize herbicide waste in drip irrigation systems.
The Asia-Pacific region is forecast to grow at a CAGR of 10.8% from 2026 to 2031. China’s large agricultural drone fleet necessitates low-viscosity indicator dyes, whereas government subsidies for mechanized rice planters in Vietnam and Thailand are facilitating the adoption of color-coding, which currently remains low. Meanwhile, Australia is shifting toward bio-based pigments, despite the challenges associated with higher costs. Japan’s greenhouse sector is investigating the use of invisible taggants for supply chain authentication. However, broader implementation is contingent on achieving cost reductions.
The European market is influenced by REACH-driven pigment withdrawals, prompting swift reformulations favoring iron oxides and organic pigments. In Western Europe, seed-treatment adoption exceeds saturation, with incremental growth shifting eastward to countries like Poland and Romania as cereal mechanization advances. In South America, Brazil dominates the agricultural colorants market, driven by the adoption of color-coding for crops such as soy and sugarcane. Meanwhile, Argentina's fertilizer imports were forecast to increase by 17.5% in 2025, supporting demand for granular pigments[3]. The Middle East and Africa markets remain fragmented, with South African wine-grape growers testing spray indicators to minimize drift onto neighboring organic farms.
Competitive Landscape
The market was moderately concentrated in 2025, with BASF SE, Clariant AG, Sensient Technologies Corporation, Milliken & Company, and Chromatech, Inc., indicating balanced competition. Sudarshan Chemical Industries Limited's acquisition of Heubach Group in early 2025 established the second-largest pigment portfolio, spanning multiple sites. This acquisition enables economies of scale to manage compliance costs and fund bio-based research. Sensient Technologies allocated USD 250 million in investment to expand its natural-color production capacity at the Saint Louis plant in 2026, reflecting confidence in the growing demand for botanical pigments in North America as microplastic restrictions become stricter.
BASF SE continues to develop functional additives, which stabilize colorants in biodegradable matrices, enhancing its integrated seed-treatment platform. Clariant leverages its Agrocer brand to provide trademarkable hues, embedding itself into the marketing strategies of seed companies. Meanwhile, smaller players secure niche contracts with certified growers who are willing to pay significant premiums for algae-sourced or plant-derived pigments that comply with stringent residue limits.
Precision Planting is focusing on the development of low-fade dyes optimized for SymphonyVision imaging. Meanwhile, Ecorobotix is aligning fluorescent markers with ARA sensor packages, which may lead to internalized supply chains and increased pressure on independent distributors. Innovators in invisible authentication, including the Massachusetts Institute of Technology, are targeting premium hybrid seed packets but face challenges in reducing tag costs to enable their use in broad-acreage crops. Overall, the competitive landscape demonstrates a combination of consolidation among established players and the emergence of new entrants leveraging sustainability and advancements in digital agriculture.
Agricultural Colorants Industry Leaders
-
BASF SE
-
Clariant AG
-
Sensient Technologies Corporation
-
Milliken & Company
-
Chromatech, Inc.
- *Disclaimer: Major Players sorted in no particular order
Recent Industry Developments
- March 2026: Sensient Technologies invested USD 250 million to expand its botanical pigment production capacity at the Saint Louis facility. The expansion includes an additional 28,800 square feet of processing space to meet the growing demand for bio-based agricultural colorants.
- November 2025: BASF SE commissioned a new high-performance dispersant production line in Nanjing to enhance pigment dispersion and color performance in applications such as coatings and agrochemical formulations.
- March 2025: Sudarshan Chemical Industries Limited completed the acquisition of Heubach Group for EUR 127.5 million (USD 137 million), expanding its operations to a total of nineteen pigment plants globally.
Global Agricultural Colorants Market Report Scope
Agricultural colorants are dyes and pigments specifically designed for use in seeds, fertilizers, and crop protection products. Their primary purposes include enhancing visibility, aiding identification, and ensuring safe application. These colorants support uniform coverage, regulatory compliance, product differentiation, and traceability in contemporary agricultural practices. The agricultural colorants market report is segmented by product type (dyes and pigments), by application (seed treatment colorants, fertilizer and soil amendment colorants, crop protection chemical colorants, and irrigation and foam marker colorants), by form (liquid, powder, and granules), by crop type (cereals and grains, oilseeds, pulses, fruits and vegetables, and other crops), and by geography (North America, South America, Europe, Asia-Pacific, Africa, and Middle East). The report offers the market size and forecasts in terms of value (USD).
| Dyes |
| Pigments |
| Seed Treatment Colorants |
| Fertilizer and Soil Amendment Colorants |
| Crop Protection Chemical Colorants |
| Irrigation and Foam Marker Colorants |
| Liquid |
| Powder |
| Granules |
| Cereals and Grains |
| Oilseeds |
| Pulses |
| Fruits and Vegetables |
| Other Crops |
| North America | United States |
| Canada | |
| Mexico | |
| Rest of North America | |
| South America | Brazil |
| Argentina | |
| Rest of South America | |
| Europe | Germany |
| France | |
| United Kingdom | |
| Italy | |
| Spain | |
| Russia | |
| Rest of Europe | |
| Asia-Pacific | China |
| India | |
| Japan | |
| Australia | |
| Indonesia | |
| Vietnam | |
| Thailand | |
| Philippines | |
| Rest of Asia-Pacific | |
| Middle East | Saudi Arabia |
| United Arab Emirates | |
| Rest of Middle East | |
| Africa | South Africa |
| Egypt | |
| Rest of Africa |
| By Product Type | Dyes | |
| Pigments | ||
| By Application | Seed Treatment Colorants | |
| Fertilizer and Soil Amendment Colorants | ||
| Crop Protection Chemical Colorants | ||
| Irrigation and Foam Marker Colorants | ||
| By Form | Liquid | |
| Powder | ||
| Granules | ||
| By Crop Type | Cereals and Grains | |
| Oilseeds | ||
| Pulses | ||
| Fruits and Vegetables | ||
| Other Crops | ||
| By Geography | North America | United States |
| Canada | ||
| Mexico | ||
| Rest of North America | ||
| South America | Brazil | |
| Argentina | ||
| Rest of South America | ||
| Europe | Germany | |
| France | ||
| United Kingdom | ||
| Italy | ||
| Spain | ||
| Russia | ||
| Rest of Europe | ||
| Asia-Pacific | China | |
| India | ||
| Japan | ||
| Australia | ||
| Indonesia | ||
| Vietnam | ||
| Thailand | ||
| Philippines | ||
| Rest of Asia-Pacific | ||
| Middle East | Saudi Arabia | |
| United Arab Emirates | ||
| Rest of Middle East | ||
| Africa | South Africa | |
| Egypt | ||
| Rest of Africa | ||
Key Questions Answered in the Report
What is the agricultural colorants market size by 2031?
The market is forecast to reach USD 2.91 billion by 2031, at an 8.34% CAGR from 2026 to 2031.
What is fueling demand for spray-indicator dyes today?
Rapid adoption of drones and autonomous sprayers requires high-visibility markers to verify application accuracy in real time.
Why do automated seed-coating facilities favor liquid colorants?
Liquids meter easily, maintain stable dispersion in polymer films, and deliver uniform hue at inclusion rates near 0.3% of product weight.
How have European REACH regulations altered pigment selection?
REACH restrictions and authorisation requirements for certain hazardous pigments, particularly lead-chromate pigments, have encouraged manufacturers to adopt safer alternatives, including organic and other heavy-metal-free pigments where technically suitable.