
Glass Fiber Market Size and Share
Market Overview
| Study Period | 2021 - 2031 |
|---|---|
| Market Volume (2026) | 8.79 Million tons |
| Market Volume (2031) | 10.75 Million tons |
| Growth Rate (2026 - 2031) | 4.12 % |
| Fastest Growing Market | Asia Pacific |
| Largest Market | Asia Pacific |
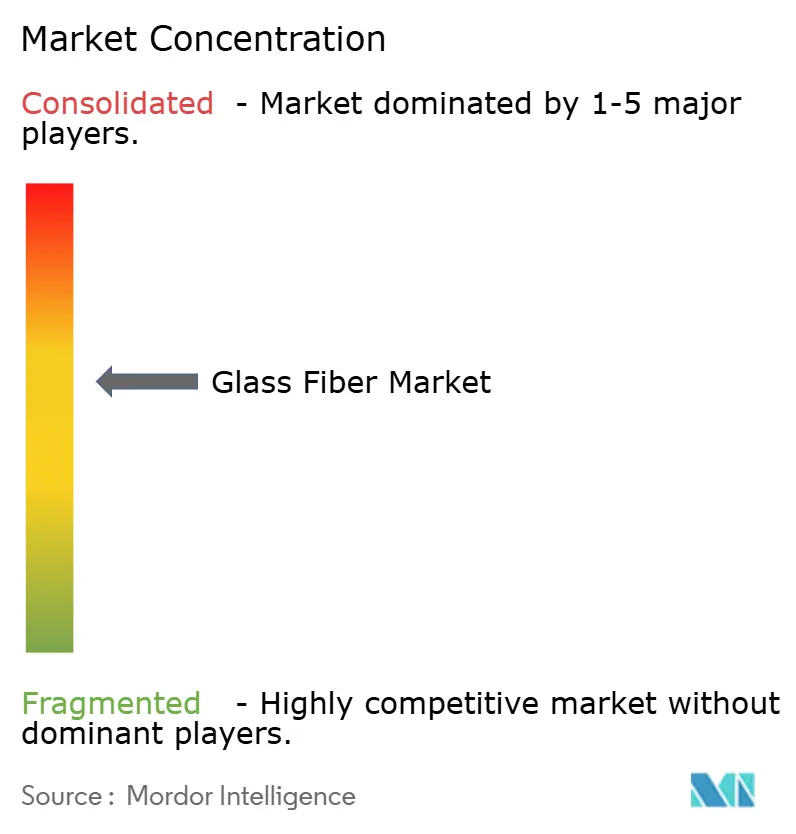
| Market Concentration | Medium |
Major Players
*Disclaimer: Major Players sorted in no particular order Image © Mordor Intelligence. Reuse requires attribution under CC BY 4.0. |
|
Glass Fiber Market Analysis by Mordor Intelligence
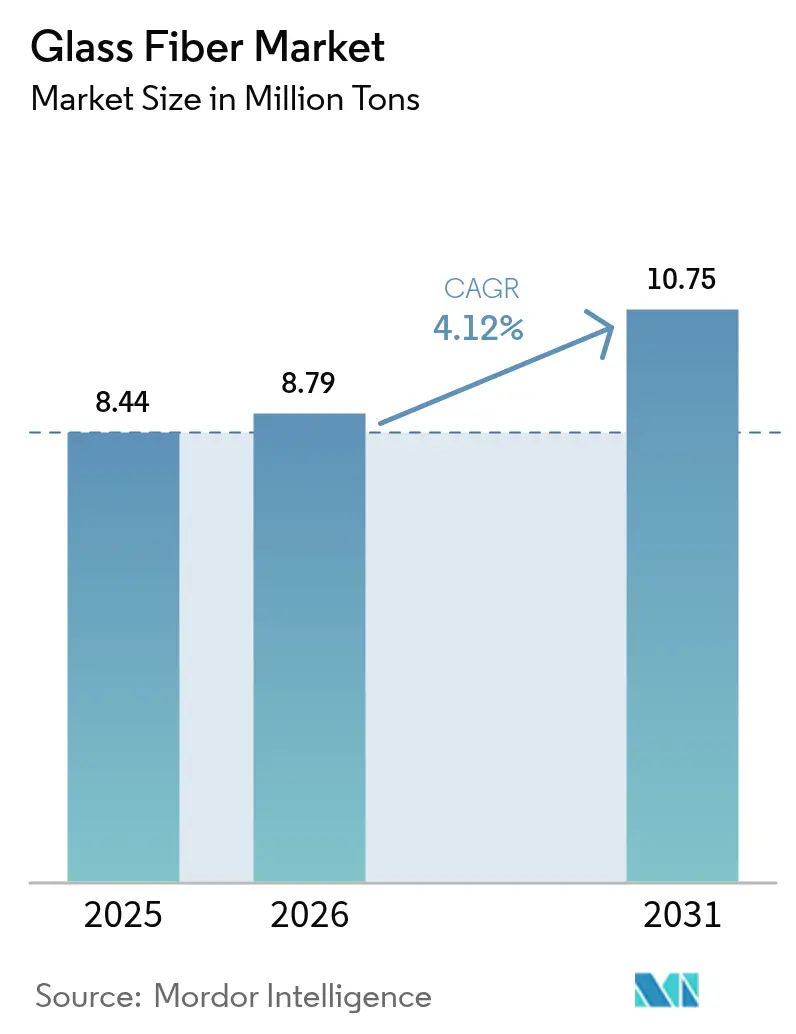
The Glass Fiber Market size is expected to grow from 8.44 million tons in 2025 to 8.79 million tons in 2026 and is forecast to reach 10.75 million tons by 2031 at a 4.12% CAGR over 2026-2031. Demand is expanding in tandem with infrastructure spending across Asia-Pacific, the rapid scale-up of offshore wind projects, and accelerating electric-vehicle (EV) output that favors lightweight composite parts. In parallel, European and North American retrofit energy codes are lifting insulation volumes, while hydrogen pipeline projects introduce higher-value E-CR grades. Raw-material price swings and carbon-fiber cost deflation temper margins, yet the broad performance-to-cost advantage of glass fiber over metals or rival reinforcements underpins healthy capacity utilization. Competitive intensity remains moderate because the ten largest producers command less than one-third of global furnace capacity, which leaves headroom for regional specialists to capture niche opportunities.
Key Report Takeaways
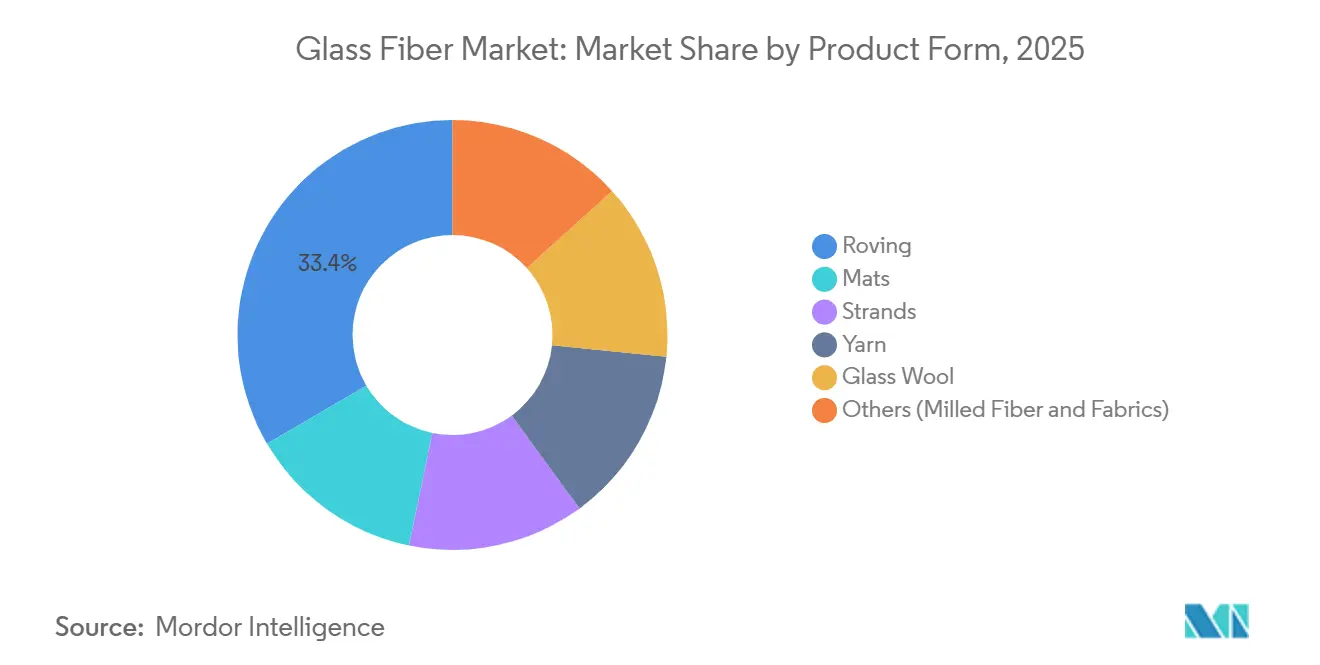
- By product form, roving led with 33.45% of the glass fiber market share in 2025, and is anticipated to expand at a 4.41% CAGR through 2031, the fastest among product categories.
- By fiber type, E-Glass accounted for 48.91% of the glass fiber market size in 2025 and is advancing at a 4.32% CAGR to 2031.
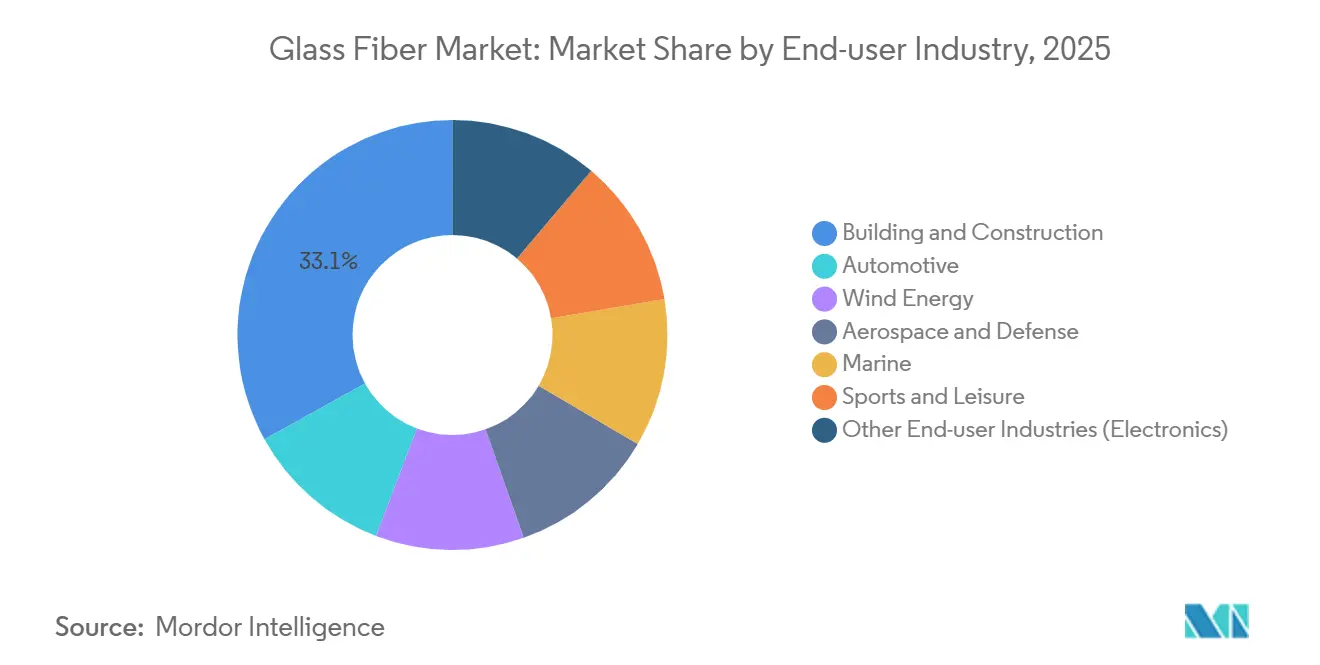
- By end-user industry, the construction industry accounted for the largest share of 33.07% in 2025. The aerospace and defense is projected to register a 5.55% CAGR between 2026 and 2031, outpacing construction and automotive.
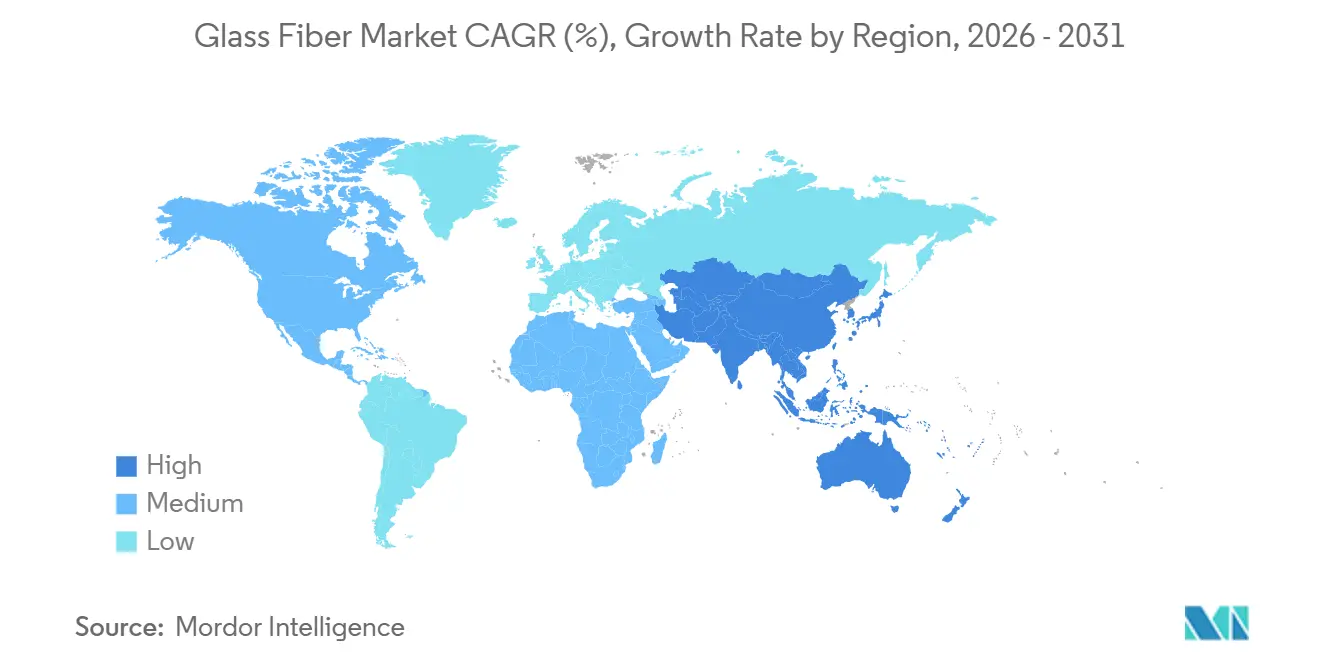
- By geography, Asia-Pacific held 49.81% of the 2025 volume and will remain the fastest-growing region at a 4.57% CAGR.
Note: Market size and forecast figures in this report are generated using Mordor Intelligence’s proprietary estimation framework, updated with the latest available data and insights as of 2026.
Market Trends and Insights
Drivers Impact Analysis of Glass Fiber Market*
| Drivers | (~) % Impact on CAGR Forecast | Geographic Relevance | Impact Timeline |
|---|---|---|---|
| Post-pandemic construction boom in Asia bolsters demand for glass-wool insulation | +0.9% | India, Vietnam, Indonesia | Medium term (2–4 years) |
| EV lightweighting accelerates adoption of chopped-strand composites | +0.7% | China, United States, Germany | Medium term (2–4 years) |
| Mega-scale wind-turbine blades expand roving consumption | +0.8% | Europe, North America, Asia-Pacific | Long term (≥4 years) |
| EU and North-American retrofit energy codes mandate additional insulation | +0.6% | Europe, United States, Canada | Short term (≤2 years) |
| Hydrogen pipeline projects specify E-CR glass for chemical resistance | +0.5% | Europe, North America, Asia-Pacific | Long term (≥4 years) |
| Source: Mordor Intelligence | |||
Post-Pandemic Construction Boom in Asia Bolsters Demand for Glass-Wool Insulation
India allocated USD 120 billion to infrastructure in fiscal 2025, and nearly half of that spending went into residential projects where glass-wool batts are now required by the 2024 Energy Conservation Building Code[1]. Vietnam’s construction sector advanced 9.1% in 2025, with foreign-invested factories specifying clean-room insulation that relies on low-density glass wool. Indonesia earmarked IDR 410 trillion (USD 27 billion) for 2025 infrastructure, using glass-wool products that cut cooling loads by up to 35% in tropical housing. Malaysia and Thailand show parallel trends as data-center and cold-chain investors adopt higher R-value batts to meet ASHRAE 90.1 targets. Collectively, these programs keep Asia the anchor of glass fiber market growth.
EV Lightweighting Accelerates Adoption of Chopped-Strand Composites
Global battery-electric vehicle production hit 14.2 million units in 2025, a 19% jump over 2024 that propelled composite demand[2]. Tesla’s Model Y uses chopped-strand mat structures to trim body-in-white mass by 23%, translating into an 18 km range extension per charge. BYD, Volkswagen, and General Motors each validated glass-fiber-reinforced thermoplastics for battery trays, together saving more than USD 300 per vehicle against aluminum alternatives. As automakers push toward cost-parity EVs, volume contracts for chopped strands underpin a steady mid-single-digit rise in the glass fiber market.
Mega-Scale Wind-Turbine Blades Expand Roving Consumption
Offshore turbines rated 15–18 MW entered service in 2025, and each 120-plus-meter blade contains roughly 35 tons of unidirectional roving. Vestas’s V236-15 MW unit, Hollandse Kust West, and GE Vernova’s Haliade-X all specify European-sourced rovings to satisfy domestic-content rules under the EU Net-Zero Industry Act. China’s Goldwind deployed 18 MW machines that drive similar fiber intensities, lifting Asia’s share of global roving contracts. New blade factories in France, India, and the United States are signing multi-year offtake deals, locking in floor volumes for the glass fiber market through the next decade.
EU and North-American Retrofit Energy Codes Mandate Additional Insulation
The revised 2024 EU Energy Performance of Buildings Directive obliges member states to upgrade 3% of public buildings annually to class C, and most projects specify glass-wool cavity fills because of low installed cost and mature supply chains. Germany committed EUR 14 billion in 2025 subsidies that lifted attic-insulation installs by 420,000 homes, while France’s MaPrimeRénov’ financed 700,000 retrofits that favor glass wool for 35–40% heat-loss cuts. North America shows a parallel push: Canada’s Greener Homes Grant covered 180,000 projects in 2025, and the U.S. Weatherization Assistance Program reached 450,000 low-income homes, together absorbing more than 500 kilotons of glass wool. Tightening rules fast-track repeat orders, adding resilience to the glass fiber market.
Restraints Impact Analysis of Glass Fiber Market*
| Restraints | (~) % Impact on CAGR Forecast | Geographic Relevance | Impact Timeline |
|---|---|---|---|
| Carbon-fiber price erosion narrows glass-fiber’s cost advantage | -0.5% | North America, Europe, Japan | Medium term (2–4 years) |
| Rock-wool producers target <100 kg/m³ HVAC niche | -0.2% | Europe, North America | Short term (≤2 years) |
| Volatile soda-ash and energy costs crimp Chinese furnace margins | -0.2% | Asia-Pacific, China | Medium term (2–4 years) |
| Source: Mordor Intelligence | |||
Carbon-Fiber Price Erosion Narrows Glass-Fiber’s Cost Advantage
Toray, Mitsubishi Chemical, and SGL Carbon added a combined 9,500 tons of carbon-fiber nameplate capacity during 2025, pushing average prices down to USD 16.30 per kilogram. Automotive compounds now see a cost gap of only 2× versus glass-fiber polypropylene, compared with 2.4× in 2023. Sporting goods OEMs are piloting lower-cost shafts that could siphon mid-tier volumes away from E-Glass. Absent countermeasures, this trend trims the glass fiber market growth trajectory.
Rock-Wool Producers Target Less Than 100 kg/m³ HVAC Niche
Rockwool International launched a 90 kg/m³ board that hits R-4.2 per inch and carries Euroclass A1 fire certification, immediately winning share in German high-rise retrofits. Paroc and Knauf added similar offerings in 2025, and Owens Corning’s Thermafiber line gained a 12% share in North American data centers, sectors where combustibility ratings trump initial cost. These moves cap near-term growth for glass-wool batts in commercial HVAC retrofits.
*Our forecasts treat driver/restraint impacts as directional, not additive. The impact forecasts reflect baseline growth, mix effects, and variable interactions.
Glass Fiber Market Segment Analysis
By Product Form:
Roving Sustains Leadership on Wind and EV MomentumRoving contributed 33.45% to 2025 volume and is on track for 4.41% CAGR through 2031, outpacing the broader glass fiber market because each 15 MW offshore turbine consumes 35 tons of unidirectional material. Mats follow, anchored in automotive underbody panels and marine laminates produced in low-cost Chinese and Turkish yards. Glass wool receives a tailwind from retrofit mandates across Europe and North America. Strands, yarns, and the “others” cluster supply printed-circuit boards, filtration textiles, and specialty adhesives, but direct-roving pultrusion is cannibalizing intermediate formats.
Roving’s installed base benefits from process improvements that cut cycle time in automotive compression molding to four minutes, half that of chopped-strand mats. Glass-wool producers are lowering binder content to 3%, improving R-value, and meeting VOC limits in California. Milled fiber remains a rheology modifier in sealants, whereas woven fabrics secure aerospace tooling demand. All told, diversified applications shield the glass fiber industry against single-segment swings.

By Fiber Type:
E-Glass Dominates While E-CR Gains in Hydrogen PipelinesE-Glass held 48.91% of volume in 2025 and is expanding at a CAGR of 4.32% through 2031, reinforced by a tensile strength of 3,400 MPa at a cost of USD 2.10 per kg. E-CR Glass, prized for alkali resistance, is scaling at double-digit rates within hydrogen-pipeline linings worth USD 150 million in 2025. S-Glass, commanding USD 23.40 per kg, captures high-performance aerospace niches. C-Glass is declining as E-CR delivers similar chemical durability at a lower total cost.
High-modulus E-Glass variants exceeding 90 GPa now allow blade designers to shave spar-cap thickness by 8–10%, preserving structural safety as rotor diameters crest 240 m. AR-Glass and D-Glass fill concrete reinforcement and low-dielectric roles, respectively. The diversified palette ensures that any substitution threat is segment-specific, leaving the broader glass fiber market intact.
By End-User Industry:
Construction Leads, Aerospace Rises FastestConstruction consumed 33.07% of 2025 tonnage owing to attic and cavity-wall insulation installs subsidized in Germany, France, and Canada. The consumption by the aerospace and defense industry is growing at a higher CAGR of 5.55% through 2031. Automotive ranked second as EV output hit 14.2 million units, each battery-tray switch from steel to polypropylene composites stripping out up to 25 kg of mass. Wind energy uses between 8–10 kg per installed megawatt, a ratio that scales with the offshore boom. Aerospace and defense grew 5.55% annually, driven by U.S. rotorcraft and European UAV programs that specify S-Glass radomes.
Marine, sports, and electronics provide steady mid-single-digit growth. Recreational boating registrations climbed 6% in 2025, lifting hull laminate demand. Carbon-fiber encroachment in premium sporting goods mainly affects the top segment, leaving cost-sensitive mid-tiers anchored to E-Glass. Printed-circuit board volumes ride 5G base-station deployments and hyperscale data-center expansions, both of which keep strand consumption buoyant.
Geography Analysis
APAC Glass Fiber Market
Asia-Pacific dominated the glass fiber market with 49.81% of 2025 volume and is slated for a 4.57% CAGR to 2031. India alone absorbed 1.8 million tons, up 19% year-on-year, as developers met strengthened thermal codes. China produced 5.2 million tons but exported 38%, reflecting persistent overcapacity and aggressive outbound logistics. Vietnam’s 1.2 GW of 2025 wind builds needed 9,600 tons of roving, while Indonesia’s EV-motorcycle boom raised composite consumption in two-wheel battery enclosures.
North America Glass Fiber Market
North America accounted for a significant market share in 2025. The U.S. installed 12 GW of wind capacity under Inflation Reduction Act incentives, translating into 96,000 tons of roving demand. Canada’s Greener Homes Grant installed 180,000 retrofit kits dominated by glass wool, and Mexico produced 3.8 million vehicles using composites in 28% of units.
EMEA and South America Glass Fiber Market
Europe accounted for significant glass fiber consumption in 2025, with Germany, France, and the U.K. making up 58%. Germany’s 420,000 home retrofits drew heavily on glass-wool batts, whereas France added 2.1 GW of wind that required 16,800 tons of roving. The U.K. saw automotive softness but aerospace upside as Airbus raised A320neo wing set output. South America and the Middle East-Africa together are witnessing the rising demand driven by Brazil’s 2.3 million-unit auto fleet and Saudi Arabia’s hydrogen pipelines that consume 12,000 tons of E-CR glass.
Value Chain Analysis
Upstream supply centers on mineral inputs (quartz sand, limestone, dolomite, kaolin/pyrophyllite, and boron-bearing materials), with boron repeatedly flagged as a formulation-critical bottleneck for higher-performance and electronic-grade glass. Because melting and fiberizing are energy intensive, furnace fuel and power costs influence competitiveness and plant siting. Producers therefore focus on efficiency upgrades such as oxy-fuel furnaces and electrification efforts highlighted by European industry bodies (Glass Fibre Europe) within climate-neutrality roadmaps. These upstream sensitivities carry into sizing and binder chemistries for rovings, mats, and glass wool, where consistency and qualification cycles tie suppliers closely to downstream OEM specifications in wind, automotive, construction insulation, and electronics.
In the midstream, large integrated producers run continuous filament furnaces and converting lines for chopped strands, woven fabrics, and electronic cloth. Sales go through direct contracts to blade makers, automotive compounders, insulation converters, and PCB laminate supply chains, alongside regional distributors for smaller fabricators. Recent restructuring shows how asset footprint and trade flows shape the chain: Owens Corning completed the sale of its global glass reinforcements business to Praana Group (May 2026), while North American capacity is being repositioned as Nippon Electric Glass moved to suspend Shelby, North Carolina production and divest its Lexington, Kentucky facility. Saint-Gobain also signed a definitive agreement to acquire the Lexington, North Carolina glass fiber plant from Electric Glass Fiber America, LLC (closing targeted for end-July 2026). In Europe, Envalior announced an intention to stop glass fiber operations in Kallo, Belgium (January 2026) amid high production and energy costs and low-cost imports, reinforcing the role of regional cost structures and policy exposure in where glass fiber value is created and converted.
Competitive Landscape
The glass fiber market is moderately consolidated. China Jushi operates 2.1 million tons of capacity and commissioned a 600,000-ton Egyptian plant in September 2024 that trims freight cost to Europe and the Middle East by 15%. Owens Corning added 100,000 tons of U.S. roving output in 2024 to serve offshore wind farms planned for the Atlantic seaboard. Saint-Gobain’s Vetrotex division piloted an 85% fiber-recovery recycling line that tackles the looming blade-end-of-life issue.
Nippon Electric Glass is advancing ultra-thin strands under 5 µm for 224 Gbps circuit boards in AI accelerators, positioning for data-center mega-trends. Johns Manville locked in a decade-long natural-gas contract at USD 3.20 per MMBtu that shields U.S. furnaces from energy volatility. Emerging disruptors, notably Continuous Composites, are commercializing continuous-fiber 3D printing that could localize tool fabrication and reduce fiber waste. The sector’s innovation emphasis centers on energy efficiency, closed-loop recycling, and high-modulus chemistries, reinforcing competitive moats amid moderate concentration.
Glass Fiber Industry Leaders
-
Johns Manville
-
China Jushi Co., Ltd.
-
Saint-Gobain
-
Nippon Electric Glass Co., Ltd.
-
Taishan Fiberglass Inc.(CTG)
- *Disclaimer: Major Players sorted in no particular order
Glass Fiber Market Companies Covered in this Report
- 3B - the fibreglass company
- AGY
- ASAHI FIBER GLASS Co., Ltd
- China Jushi Co., Ltd.
- Chongqing International Composite Materials Co., Ltd.
- Envalior
- Gurit Services AG
- Heraeus Holding
- Johns Manville
- Nippon Electric Glass Co., Ltd.
- PFG FIBER GLASS CORPORATION
- Praana Group
- Saint-Gobain
- Taishan Fiberglass Inc.(CTG)
- Taiwan Glass Ind. Corp.
Market Opportunities and Future Outlook
Electronic-grade glass fiber and fabrics for PCBs and advanced packaging are drawing investment toward tighter dimensional control, low-CTE constructions, and dedicated electronic cloth capacity. In North America, AGY and JPS Composite Materials announced a partnership (February 2026) to produce low-CTE glass fiber fabric for advanced IC substrates, with production underway across South Carolina and North Carolina. This indicates efforts to localize specialty materials that have been historically import-dependent. In China, China Jushi started operating a Huai'an, Jiangsu production line (March 2026) designed for 100,000 tons of electronic-grade glass fiber and 390 million meters of electronic cloth annually, and it also disclosed a CNY 4.43 billion investment (May 2026) for additional electronic-grade glass fiber and cloth capacity. Together, these steps point to continued build-out aligned with AI servers, data centers, and high-speed interconnect demand.
Construction and insulation remain a large-volume opportunity tied to active retrofit and building-efficiency programs. At the same time, wind energy and EV lightweighting continue to favor high-throughput roving and chopped-strand supply that meets OEM qualification and domestic-content preferences. New U.S. capacity additions in fiberglass and mats broaden local sourcing options for converters, for example IKO North America opened a new fiberglass manufacturing and glass mat facility in Chester County, South Carolina (March 2026) following a USD 500 million investment. Beyond capacity, circularity and lower-carbon production methods are increasingly treated as customer-selection criteria in composites supply chains, creating room for producers that can pair performance grades (including E-CR for chemically demanding applications) with documented footprint reductions and recycling pathways.
Recent Industry Developments in Glass Fiber Market
- July 2026: Saint-Gobain announced an acquisition of a glass fiber plant in North America to reinforce its local supply chain. The move supports regional continuity of supply for reinforcements and reduces reliance on imported volumes as North American assets change hands.
- March 2026: China Jushi commissioned a 100,000-ton-per-year electronic-grade fiberglass line and 390 million-meter electronic cloth capacity at its Huai'an smart manufacturing base. This expands availability of higher-value electronic-grade materials used in PCB laminates and data-center hardware supply chains.
- November 2024: Johns Manville inaugurated a new micro fiberglass production line for indoor air filter media at its Wertheim, Germany site. The expansion increases supply of fine-fiber media tied to HVAC and indoor air quality applications, supporting downstream filtration converters.
Glass Fiber Market Report Scope and Research Methodology
Market Definition and Coverage
For this methodology, the glass fiber market covers manufactured glass fiber materials sold for reinforcement, insulation, and related industrial use, counted at the point where glass fiber products are sold into downstream processing or end-use applications.
Scope exclusions: We exclude finished composite parts and structures where glass fiber is only an embedded input, and we also exclude downstream fabrication services.
Segments Covered in This Report
-
By Product Form
- Roving
- Mats
- Strands
- Yarn
- Glass Wool
- Others (Milled Fiber and Fabrics)
-
By Fiber Type
- E-Glass
- S-Glass
- E-CR Glass
- C-Glass
- Others
-
By End-user Industry
- Building and Construction
- Automotive
- Wind Energy
- Aerospace and Defense
- Marine
- Sports and Leisure
- Other End-user Industries (Electronics)
-
By Geography
-
Asia-Pacific
- China
- India
- Japan
- South Korea
- Indonesia
- Vietnam
- Malaysia
- Thailand
- Rest of Asia-Pacific
-
North America
- United States
- Canada
- Mexico
-
Europe
- Germany
- France
- United Kingdom
- Italy
- Spain
- Russia
- Turkey
- Nordics
- Rest of Europe
-
South America
- Brazil
- Argentina
- Colombia
- Rest of South America
-
Middle-East and Africa
- Saudi Arabia
- United Arab Emirates
- Qatar
- Egypt
- South Africa
- Nigeria
- Rest of Middle-East and Africa
-
Asia-Pacific
Data Sources, Market Sizing, and Validation
Desk Research
Desk research was used to set the factual base for the model and to avoid building assumptions in a vacuum. We pulled production and industry signals from public sources such as the USGS, the US Census Bureau, Eurostat, the World Bank, and UN Comtrade, then cross-checked them against trade association releases and standards bodies where product definitions are clarified.
On the company side, annual reports, investor presentations, and press releases were reviewed to understand capacity additions, plant utilization commentary, and end-market demand narratives. Patent databases were screened to sense where process improvements and fiber sizing formulations are moving, and an import-export shipment-level database was used selectively to sanity-check trade flow direction and pricing movement for glass fiber categories. The sources named above are illustrative rather than exhaustive, and additional public documents and datasets were also reviewed for data collection, validation, and definition-level clarification.
Primary Interviews and Surveys
Primary work was run through expert interviews and structured surveys with manufacturers, distributors, raw material stakeholders, and large end users across key regions, so that pricing logic and demand signals could be checked beyond what is visible in public data. We used these conversations to validate product form mix, typical conversion losses, and the pace of adoption in construction, automotive, and wind-related composites, and then we refined assumptions when repeated responses indicated a different reality.
Distribution of primary research fieldwork respondents
| Company type | Respondent position | Region |
|---|---|---|
| Top tier: 26% | CXOs: 13% | APAC: 43% |
| Mid tier: 58% | Functional/Unit leaders: 43% | EMEA: 37% |
| Smaller Players: 16% | Managers: 44% | Americas: 20% |
Market-Sizing & Forecasting
Sizing starts from a top-down reconstruction of the demand pool using production and trade signals, then translating this into glass fiber consumption by applying usage intensity across major end-use outlets. In practice, we rely on a small set of repeatable inputs such as construction activity and insulation demand indicators, automotive production trends linked to lightweighting, wind installation momentum, regional manufacturing capacity changes, and observed import-export movement for glass fiber product groups.
After forming a regional total, selective bottom-up approximations are used as a check so the numbers do not drift from what suppliers can realistically ship. These checks include sampled price-per-ton ranges by product form and region, channel checks on typical discounting, and a limited roll-up of disclosed capacity and utilization commentary where it is available. Where gaps exist, we avoid forcing precision and instead bracket assumptions with interview-backed ranges, followed by a consistent midpoint selection so the model stays explainable.
For forecasting, scenario analysis is used, because the market is sensitive to energy and construction cycles and also to the timing of new capacity coming online. The base case is aligned to the most repeated expectations heard in primary discussions on demand growth, pricing progression, and utilization normalization, and then outcomes are stress-tested under faster and slower build scenarios.
Data Validation & Update Cycle
Model outputs are checked against independent signals such as trade intensity shifts, capacity announcements, and changes in demand indicators for construction and wind builds, and then any large variances are investigated before final numbers are signed off. Where the model produces an unusual jump, we re-check unit conversions, price assumptions, and whether a one-time event is being treated as a continuing trend. A second analyst review is then done to reduce avoidable errors.
Reports are refreshed annually, and interim updates are triggered when material events occur, such as major plant startups, shutdowns, or sharp raw material swings that change pricing and utilization. Before delivery, a final review pass is completed so clients receive the latest updated view based on the most recent public updates and validation learnings from outreach.
Mordor Intelligence's Glass Fiber Market Size Compared Against Other Published Estimates
Published market sizes for glass fiber often do not match, even when they appear to cover the same topic. Differences usually come from what is counted as glass fiber, whether values or volumes are reported, and how prices are converted and projected across regions.
The biggest gap driver is whether glass fiber articles and downstream composite parts are bundled into the total, where Mordor Intelligence counts glass fiber materials by product form and fiber type and keeps finished parts outside the market size. This can create a wide spread versus broader value totals.
Benchmark comparison
| Source | Market Size | Gaps in Research Methodology |
|---|---|---|
| Mordor Intelligence | USD 0.00 B (2026) | |
| Regional Consultancy A | USD 31.93 B (2024) | Uses a value-based total that can mix glass fiber materials with broader composite-related revenue pools, and it may apply generalized price growth across forms without validating product-mix shifts by region. |
| Trade Data Publisher B | USD 69.60 B (2024) | Includes glass fiber and glass fiber articles priced at nominal wholesale levels, which tends to sit above a materials-only view, and its long-range projection can be driven more by trade and price benchmarks than by end-use consumption intensity checks. |
The table shows that scope and price layer choices can change the outcome more than the math itself. By keeping the counting unit consistent (material output and consumption signals first, followed by pricing checks) and by validating assumptions through interviews, the final estimate stays traceable to clear drivers that can be revisited when conditions change.
Key Questions Answered in the Report
How large will the glass fiber market be by 2031?
It is forecast to reach 10.75 million tons by 2031, growing at a 4.12% CAGR over 2026–2031.
Which segment holds the highest glass fiber market share today?
Roving leads with 33.45% of 2025 global volume, supported by wind-turbine blade demand.
What is driving glass fiber adoption in electric vehicles?
Automakers use chopped-strand and roving composites to cut battery-enclosure mass by 20–25%, extending driving range without extra cells.
Why is E-CR glass gaining momentum?
Hydrogen pipelines require alkali-resistant reinforcement, and E-CR glass prevents stress-corrosion cracking at 100 bar operating pressure.
Which region is expanding fastest in the glass fiber market?
Asia-Pacific is growing at a 4.57% CAGR, fueled by construction booms in India, Vietnam, and Indonesia.
Are sustainability initiatives changing supply dynamics?
Yes, blade-recycling pilots, energy-efficient furnaces, and bio-based sizing agents are becoming supplier selection criteria for OEMs.