
Glacial Acetic Acid Market Size and Share
Market Overview
| Study Period | 2020 - 2031 |
|---|---|
| Market Volume (2026) | 12.38 Million tons |
| Market Volume (2031) | 16.12 Million tons |
| Growth Rate (2026 - 2031) | 5.43 % |
| Fastest Growing Market | Asia Pacific |
| Largest Market | Asia Pacific |
| Market Concentration | High |
Major Players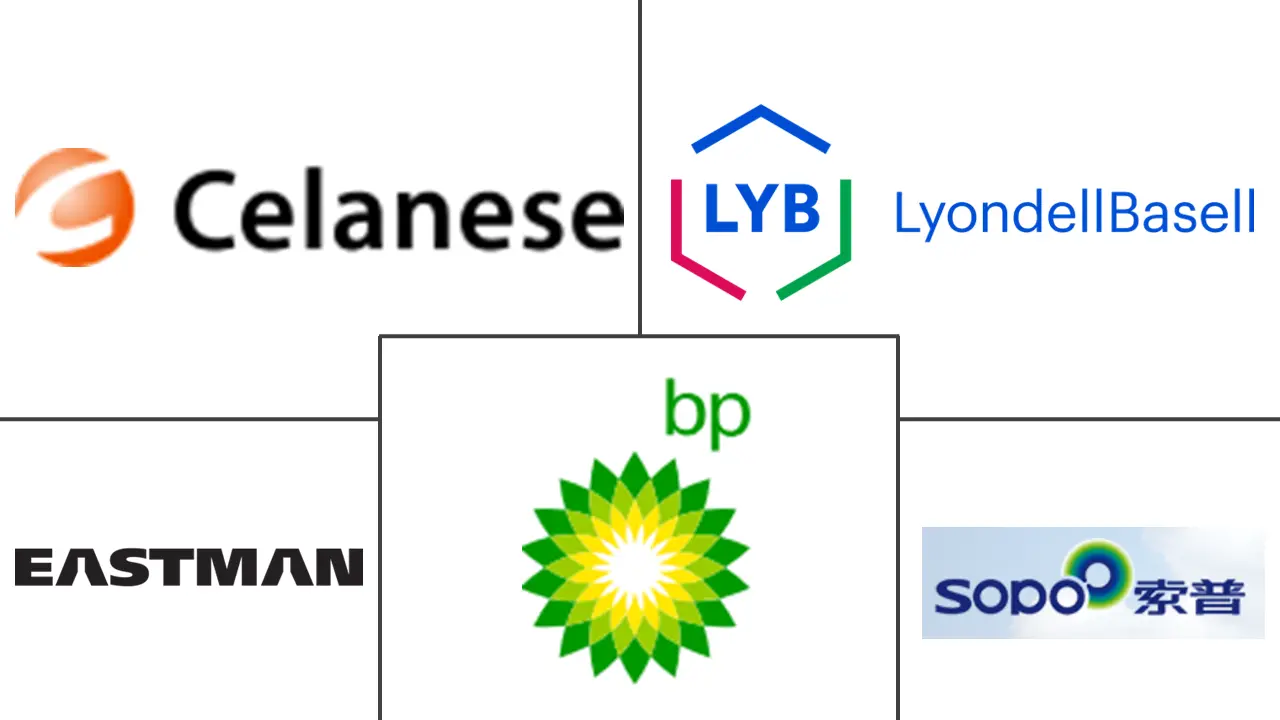 *Disclaimer: Major Players sorted in no particular order Image © Mordor Intelligence. Reuse requires attribution under CC BY 4.0. | |
Glacial Acetic Acid Market Analysis by Mordor Intelligence
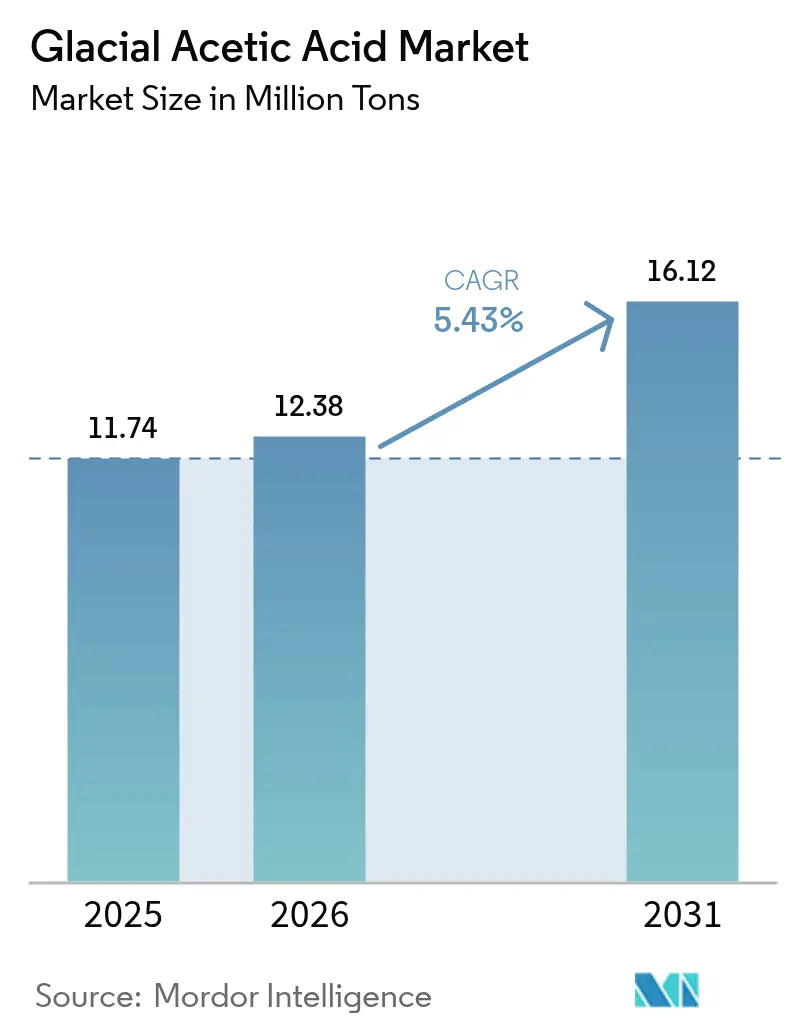
The Glacial Acetic Acid market size is expected to grow from 11.74 Million tons in 2025 to 12.38 Million tons in 2026 and is forecast to reach 16.12 Million tons by 2031 at 5.43% CAGR over 2026-2031. Volume growth is anchored in vinyl acetate monomer (VAM) demand, pharmaceutical excipient uptake, and resilient consumption in food preservation. Bio-based production technologies are moving into commercial scale, loosening the traditional link between acetic acid output and fossil feedstocks and positioning early adopters for margin protection. Regional production shifts toward Asia-Pacific are changing trade flows as North American and European producers lean into specialty grades. Methanol price volatility and tighter occupational-safety norms are challenging unintegrated players, yet integrated firms with captive methanol or alternative feedstocks continue to defend profitability. Strategic investments in low-carbon processes and ultra-high-purity grades have emerged as competitive differentiators, particularly for companies targeting electronics and pharmaceutical customers.
Key Report Takeaways
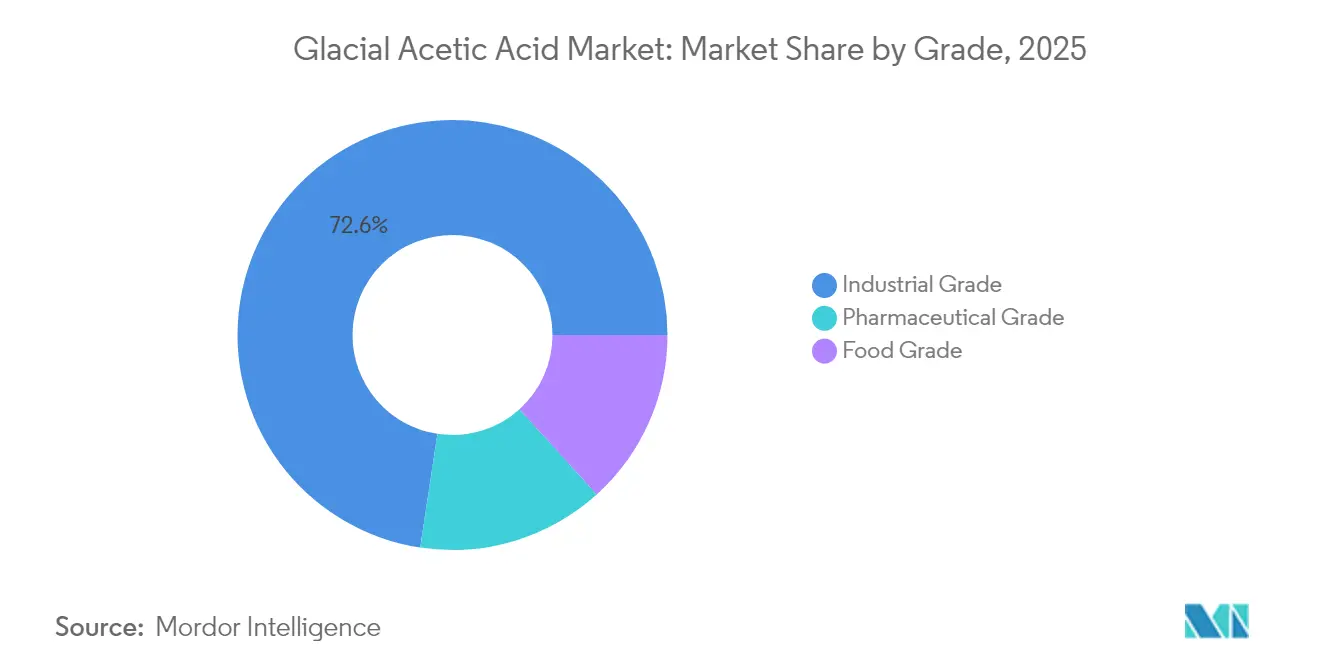
- By grade, Industrial Grade led with 72.60% of the glacial acetic acid market share in 2025, while Pharmaceutical Grade is projected to expand at a 6.82% CAGR to 2031.
- By application, VAM production accounted for 34.70% of the glacial acetic acid market size in 2025 and Solvents are growing at a 6.43% CAGR through 2031.
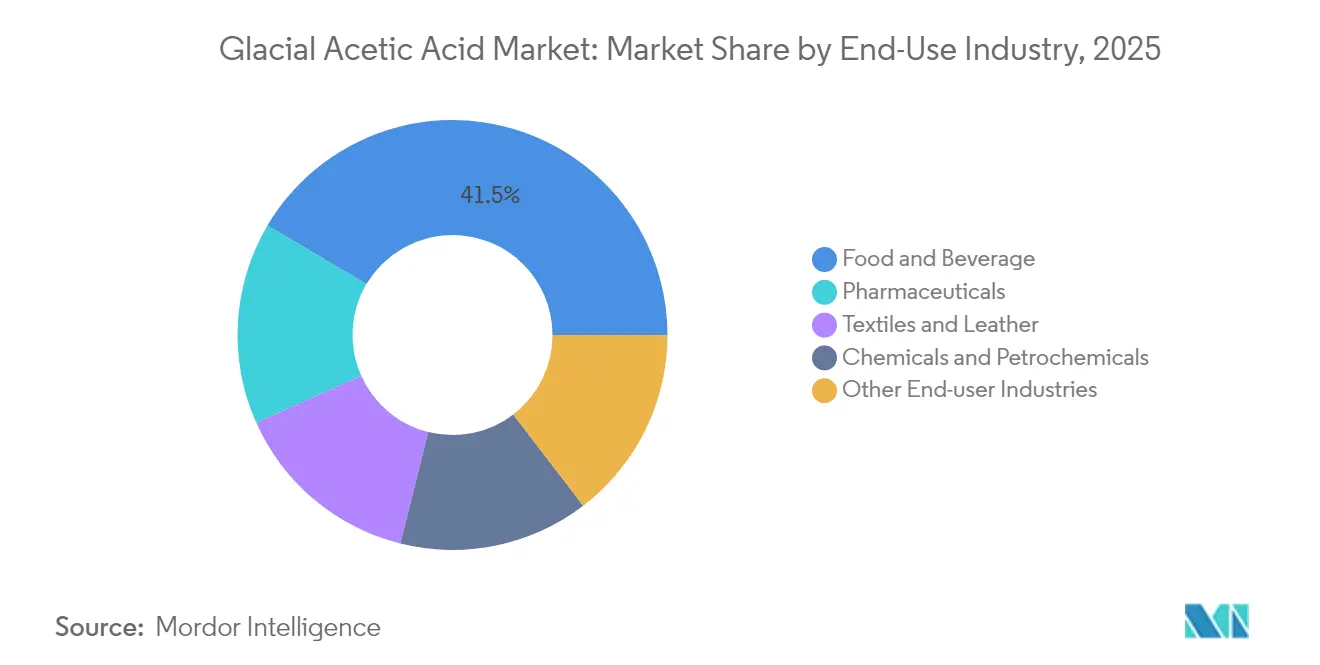
- By end-use industry, Food and Beverage held 41.50% of the glacial acetic acid market size in 2025 and Pharmaceuticals posts the highest 6.69% CAGR to 2031.
- By region, Asia-Pacific captured 62.60% of the glacial acetic acid market share in 2025 and advances at a 6.72% CAGR between 2026 and 2031.
Note: Market size and forecast figures in this report are generated using Mordor Intelligence’s proprietary estimation framework, updated with the latest available data and insights as of 2026.
Global Glacial Acetic Acid Market Trends and Insights
Drivers Impact Analysis*
| Driver | (~) % Impact on CAGR Forecast | Geographic Relevance | Impact Timeline |
|---|---|---|---|
| Expanding Production Capacity in Asia-Pacific to Serve Vinyl Acetae Momomer( VAM) Demand | +1.8% | Asia-Pacific with spillover to North America | Medium term (2-4 years) |
| Increasing Adoption of Bio-based Feedstock in Acetic Acid Manufacturing | +1.2% | Global with early moves in Europe and North America | Long term (≥ 4 years) |
| Rising Demand from Pharmaceutical Excipients in Emerging Economies | +0.9% | Asia-Pacific, notably India and China | Medium term (2-4 years) |
| Growth of Solvent Applications in Adhesives and Sealants | +0.7% | Global with concentration in Asia-Pacific | Short term (≤ 2 years) |
| Textile Industry Revival in Southeast Asia Boosting Acetic Acid Dyeing Agents | +0.5% | Vietnam and Indonesia | Short term (≤ 2 years) |
| Source: Mordor Intelligence | |||
Expanding Production Capacity in Asia-Pacific to Serve Vinyl Acetate Monomer Demand
- Asia-Pacific producers are adding large-scale acetic acid units to secure VAM feedstock. Jiangsu Sopo’s 450 kt expansion and GNFC’s planned 200 kt unit illustrate the region’s push toward self-sufficiency[1]. This capacity wave is tilting global trade balances and nudging North American and European suppliers toward higher-value derivatives. As VAM demand in adhesives, paints, and flexible packaging climbs, integrated producers in China, India, and Japan are locking in scale advantages. Downstream converters benefit from shorter supply chains and reduced freight costs, adding momentum to regional manufacturing.
Increasing Adoption of Bio-based Feedstock in Acetic Acid Manufacturing
Commercialization of carbon-capture and biomass-based routes is lowering life-cycle emissions. Again’s flue-gas-to-acetic-acid process reduces reliance on methanol and attracts sustainability-driven buyers, while New Iridium’s photochemical route targets cellulosic waste streams. Producer interest in these pathways is also a hedge against methanol volatility and tightening carbon regulations. Long-term offtake agreements with consumer-goods companies seeking low-carbon ingredients further underpin investment cases.
Rising Demand from Pharmaceutical Excipients in Emerging Economies
Pharmaceutical grade glacial acetic acid benefits from capacity upgrades at Indian and Chinese active pharmaceutical ingredient (API) clusters. High-purity material is essential for acetaminophen, antibiotic intermediates, and injectable formulations. As local drug makers transition from bulk generics to complex therapies, purity thresholds tighten, creating premium margins for suppliers certified to current Good Manufacturing Practices.
Growth of Solvent Applications in Adhesives and Sealants
Silicone sealant formulations and advanced adhesive systems employ glacial acetic acid as a reactive solvent that accelerates cure time and improves moisture resistance. Regulatory pressure on volatile organic compounds (VOC) is shifting demand toward formulations where acetic acid offers lower toxicity and predictable evaporation rates[2]. Construction rebound in Asia and infrastructure renewal in North America support near-term volume gains.
Restraints Impact Analysis*
| Restraint | (~) % Impact on CAGR Forecast | Geographic Relevance | Impact Timeline |
|---|---|---|---|
| Volatility in Methanol Feed-stock Prices | –1.2% | Global, highest impact where producers lack captive methanol | Short term (≤ 2 years) |
| Stringent Occupational-Safety Norms Limiting Handling and Storage | –0.6% | North America and Europe with gradual extension to Asia-Pacific | Medium term (2-4 years) |
| Supply–Demand Imbalances Causing Price Suppression | –0.8% | Global, most pronounced in Asia-Pacific | Short term (≤ 2 years) |
| Source: Mordor Intelligence | |||
Volatility in Methanol Feedstock Prices
Methanol spot prices swung sharply during 2024, compressing producer margins and complicating capacity planning. Unintegrated plants were hardest hit, prompting renewed interest in hedging tools and alternative feedstocks. Completion of Methanex’s acquisition of OCI’s methanol assets is expected to shift global bargaining power toward integrated giants.
Stringent Occupational-Safety Norms Limiting Handling and Storage
Updated U.S. Environmental Protection Agency rules require enhanced emission controls and upgraded ventilation in acetic acid handling areas. Compliance costs estimated at USD 455 million across the synthetic organic chemical sector are forcing smaller processors to reassess capital budgets[3]. Similar frameworks are under review in the European Union, suggesting broader global adoption.
*Our forecasts treat driver/restraint impacts as directional, not additive. The impact forecasts reflect baseline growth, mix effects, and variable interactions.
Segment Analysis
By Grade: Pharmaceutical Purity Commanding Premium
Industrial Grade dominated the glacial acetic acid market with a 72.60% share in 2025 as bulk producers supplied VAM plants and downstream chemical syntheses. The segment’s scale delivers cost leadership, yet profit sensitivity to methanol prices remains. Pharmaceutical Grade, though smaller, is on track for a 6.82% CAGR, reflecting stricter impurity limits in API synthesis and injectable formulations. Recent capacity additions in India’s Gujarat region illustrate producer moves to capture this higher-margin pool.
Demand for ultra-high-purity material in semiconductor wet processes is emerging as a lucrative niche. Linewidth reduction in advanced nodes heightens sensitivity to metallic contaminants, so producers able to deliver parts-per-billion impurity levels can command significant premiums. These offerings create a two-tier pricing environment in which standard pharmaceutical grade supports volume while electronics grade secures profitability. The opportunity aligns with national strategies in Japan and South Korea to safeguard chip-supply sovereignty, offering suppliers stable offtake commitments.

By Application: VAM Production Dominates Volume, Solvents Accelerate Growth
VAM production accounted for 34.70% of 2025 volumes, cementing its status as the anchor application for the glacial acetic acid market. Adhesives, paints, and flexible packaging all rely on VAM-derived polymers, linking acetic acid demand to construction and consumer-goods cycles. Capacity expansions in China and India ensure regional VAM assets are fully backward-integrated, preserving competitive position.
The Solvent segment is expanding at a 6.43% CAGR through 2031 as acetic-acid-based systems gain share in adhesives, sealants, and pharmaceutical formulations. Producers are tailoring solvent blends to comply with regional VOC standards and to enhance bond performance under humid conditions. Although the segment is smaller than VAM in tonnage, its higher price points and customer stickiness bolster margins, making it a strategic focus area.
By End-Use Industry: Food and Beverage Holds Scale, Pharmaceuticals Drive Momentum
Food and Beverage captured 41.50% of the glacial acetic acid market size in 2025, anchored in preservative and flavoring uses across condiments and pickled goods. Clean-label consumer trends support steady volume as manufacturers rely on acetic acid’s antimicrobial efficacy. Producers targeting this segment emphasize consistent sensory profiles and regulatory compliance.
Pharmaceuticals represent the fastest-growing end-use, rising at a 6.69% CAGR. Demand emanates from API makers and contract manufacturing organizations in Asia-Pacific, with procurement teams favoring vendors accredited to WHO and U.S. FDA standards. Chemicals and Petrochemicals remain the second-largest outlet, tied to VAM and downstream acetate esters, while Textile and Leather applications are rebounding in Southeast Asia due to garment production shifts
Geography Analysis
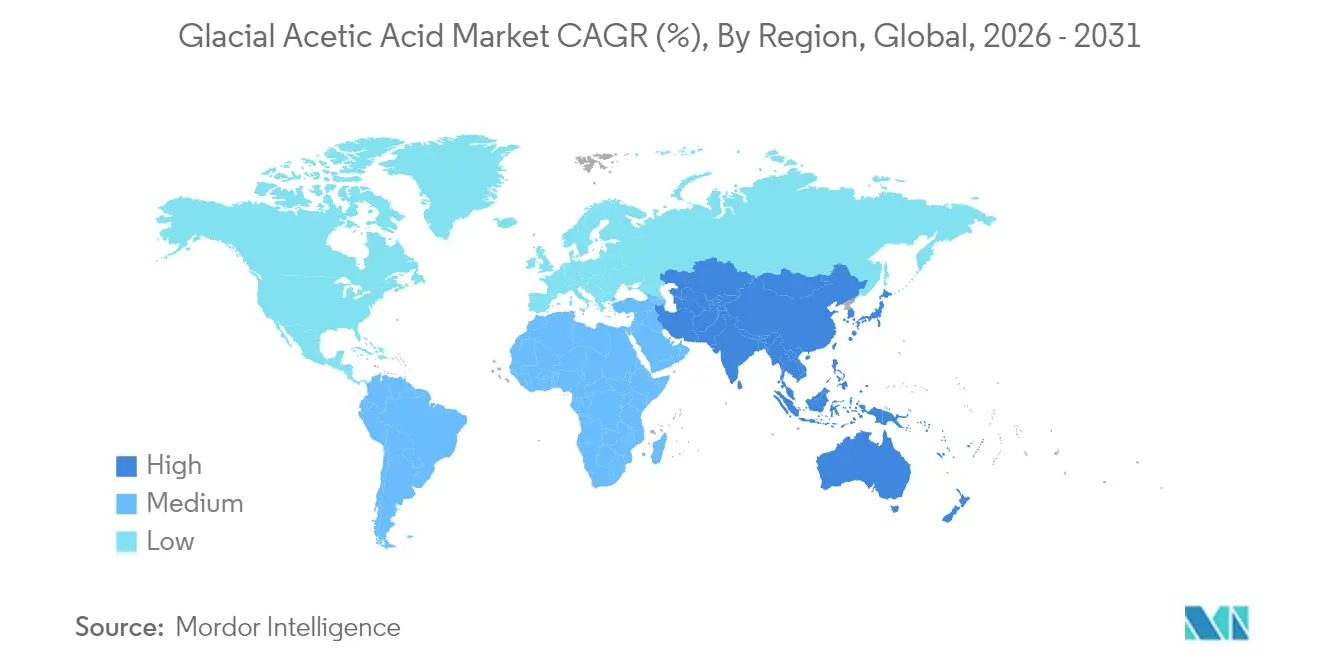
Asia-Pacific held 62.60% of the glacial acetic acid market in 2025 and is advancing at a 6.72% CAGR through 2031. China holds a significant share of the global methanol capacity, supported by state-linked financing and integrated methanol sourcing. India is scaling domestic output, and joint-venture discussions such as INEOS Acetyls with GNFC underline the nation’s import-replacement agenda. Japan and South Korea concentrate on high-purity niches for electronics and pharmaceuticals, fetching premium pricing.
North America ranks second by volume, anchored in the chemical and food industries. Department of Energy grants for bio-based acetic acid projects enable technology pilots that could lower carbon intensity and partially insulate the region from methanol swings. Trade policy uncertainty adds a cautionary tone, as tariff shifts may affect downstream polymer exports.
Europe shows mature demand with a tilt toward specialty grades and climate-aligned processes. Fit for 55 legislation spurs investment in low-carbon acetyls, while competitive pressure from Asian imports suppresses commodity-grade margins. Germany and the United Kingdom remain the largest European consumers, leveraging strong pharmaceutical and food sectors. The Middle East benefits from low-cost feedstocks and rising construction activity, especially under Saudi Arabia’s Vision 2030, whereas South America progresses more modestly with incremental growth in Brazil and Argentina.
Value Chain Analysis
The upstream value chain depends on methanol and carbon monoxide supply, with most global glacial acetic acid produced through low-pressure methanol carbonylation using homogeneous catalyst systems (Monsanto rhodium or Cativa iridium). Integrated producers that control syngas/CO generation and methanol sourcing reduce exposure to methanol price swings, while unintegrated players face margin pressure when feedstock costs change faster than contract reset cycles.
Midstream operations focus on purification and grade-specific finishing (industrial, food, pharmaceutical, and emerging ultra-high-purity), followed by bulk storage and specialized logistics. Glacial acetic acid solidifies at about 16.6 C, so shippers rely on appropriate tank/IBC specifications and temperature management to avoid freezing and contamination, which is especially important for food and pharma supply. Downstream demand is concentrated in large, continuous consumers such as VAM units and solvent or ester producers, shaping contracting behavior (index-linked pricing, dual sourcing). In Asia-Pacific, concentrated production hubs and periodic plant maintenance drive intra-China balancing flows, and 2025 shipments were reported moving from eastern provinces toward the northwest during outages at major facilities. This reinforces the role of regional terminals and dedicated chemical logistics in maintaining supply continuity.
Competitive Landscape
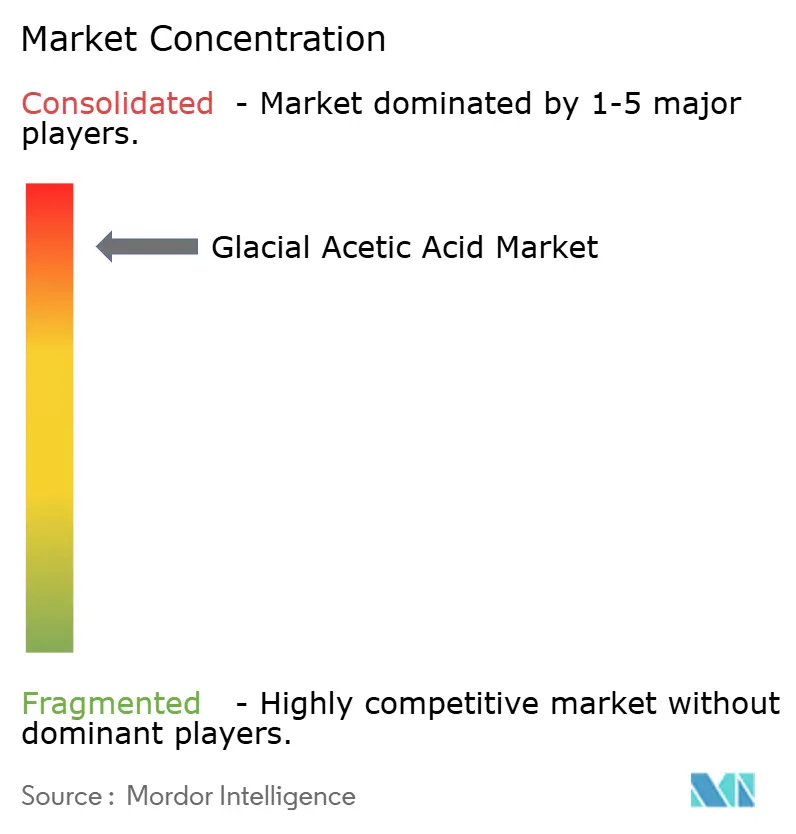
The glacial acetic acid market is consolidated, with the top five producers holding approximately 73% of the market share. Celanese leads through its integrated acetyl-chain assets across three continents, focusing on cost optimization. BP Acetyls and Eastman Chemical follow, leveraging regional and product-specific strengths.
Sustainability is becoming a key factor, with Celanese, Eastman, and BP incorporating captured carbon and renewable energy into acetic acid synthesis. Emerging players utilizing CO₂-to-acetic acid technologies are targeting specialty customers with low-carbon requirements, potentially challenging incumbents.
Oversupply in 2024-2025 is pressuring unintegrated producers, prompting some to consider alliances or divestitures. Meanwhile, integrated multinationals are focusing on ultra-high-purity grades, customized solvent blends, and sustainability-linked metrics to strengthen their competitive edge.
Glacial Acetic Acid Industry Leaders
-
BP p.l.c.
-
Celanese Corporation
-
Eastman Chemical Company
-
LyondellBasell Industries Holdings B.V.
-
Jiangsu Sopo (Group) Co., Ltd.
- *Disclaimer: Major Players sorted in no particular order
Market Opportunities and Future Outlook
Opportunities are clustering around three areas: (1) higher-purity upgrading for pharmaceutical and electronics-linked applications, where tighter impurity thresholds support premium pricing; (2) supply-chain integration that reduces exposure to methanol and CO volatility through captive feedstocks and long-term CO arrangements; and (3) differentiation through lower-carbon production pathways that decouple output from fossil methanol. Celanese extending a long-term carbon monoxide supply contract with Nanjing Chengzhi Clean Energy for its 1.2 million tpa acetic acid plant in Nanjing illustrates how secure CO sourcing is being used to stabilize large-scale acetyl operations and improve reliability for downstream VAM and solvents customers.
The near-term operating environment is also being shaped by rapid capacity additions and the need to place volumes into value-accretive outlets rather than commodity spot markets. In China, industry sources have pointed to a large wave of new capacity, including about 2.8 million tpa scheduled to commence in H2 2026, which increases the incentive for producers and traders to build export channels, expand derivative integration (VAM, acetate esters, acetic anhydride), and tailor grade portfolios for pharma and specialty solvents where qualification and consistency matter more than price alone. Technology and process opportunities extend to efficiency upgrades, including heterogeneous catalytic approaches that reduce separation burden, as well as early commercialization of CO2- or biomass-linked routes that appeal to buyers with decarbonization targets.
Recent Industry Developments
- March 2026: Celanese announced global price increases across the acetyls chain, including an increase for acetic acid (communicated as USD 0.10/lb or USD 200/MT). The announcement signaled tighter netback management across regions and reinforced the role of pricing actions in balancing profitability amid volatile feedstocks and shifting trade flows.
- February 2026: Celanese announced price increases for acetic acid, vinyl acetate monomer (VAM), and derivatives in the Western Hemisphere. The announcement set a benchmark for contract negotiations across key end markets such as adhesives, coatings, and packaging, where VAM-linked demand transmits quickly into upstream acetic acid pricing.
- November 2024: INEOS Acetyls signed an MoU with Gujarat Narmada Valley Fertilizers & Chemicals Ltd (GNFC) to assess the feasibility of establishing a 600 kt acetic acid plant at GNFC's Bharuch facility in Gujarat, India. The potential project supported India's import-replacement agenda and, if advanced, would reshape local availability for VAM and downstream acetyl derivatives by adding world-scale capacity in a market with limited domestic production.
Research Methodology Framework and Report Scope
Market Definition and Coverage
For this study, the glacial acetic acid market is defined as merchant sales of anhydrous, high-purity acetic acid (typically around 99%+) supplied to downstream users for chemical and industrial processing, tracked as global demand and supply by major regions.
Scope exclusions: The sizing excludes diluted vinegar-type products, finished acetyl derivatives sold as separate products, and captive in-house volumes that do not enter merchant trade.
Segmentation Overview
- By Grade
- Food Grade
- Industrial Grade
- Pharmaceutical Grade
- By Application
- Vinyl Acetate Monomer
- Ester Production
- Acetic Anhydride
- Solvent
- Food Additive
- Textile
- Other Applications
- By End-Use Industry
- Chemicals and Petrochemicals
- Food and Beverage
- Pharmaceuticals
- Textiles and Leather
- Other End-user Industries
- By Geography
- Asia-Pacific
- China
- India
- Japan
- South Korea
- Rest of Asia-Pacific
- North America
- United States
- Canada
- Mexico
- Europe
- Germany
- United Kingdom
- France
- Italy
- Rest of Europe
- Rest of the World
- Middle East and Africa
- South America
- Asia-Pacific
Data Sources, Market Sizing, and Validation
Desk Research
Desk work started with building the basic supply and demand picture, before the model was shaped and stress-tested. We referenced public sources such as USGS chemicals and minerals statistics, UN Comtrade trade flows, national statistical offices, and customs or port authority releases to understand volume movement by region.
To keep the scope grounded, we also reviewed peer-reviewed chemistry and process journals, patent databases covering carbonylation and bio-based routes, and environmental agency publications that affect plant operations and compliance costs. Company filings, annual reports, and investor presentations were used to map capacity additions, shutdowns, and integration into downstream chains. Where needed, our team used paid subscriptions for company financials and intelligence, plus shipment-level import and export databases to cross-check trade-linked supply signals. These desk sources are illustrative, and additional public references were used for data collection, validation, and clarification.
Primary Interviews and Surveys
Primary work was used to confirm what the numbers mean in actual buying and selling, and to close gaps desk sources cannot explain well. Interviews were carried out with producers, distributors, and large buyers across key consuming regions, and the inputs were used to validate plant utilization, trade direction, pricing bands, and demand shifts by end-use. When responses conflicted, follow-ups were done so assumptions could be aligned to a repeatable and transparent market model.
Distribution of primary research fieldwork respondents
| Company type | Respondent position | Region |
|---|---|---|
| Top tier: 35% | CXOs: 16% | APAC: 45% |
| Mid tier: 49% | Functional/Unit leaders: 32% | EMEA: 31% |
| Smaller Players: 16% | Managers: 52% | Americas: 24% |
Market-Sizing & Forecasting
The market model was first built using a top-down approach where capacity additions, operating rates, and regional trade data were used to reconstruct the merchant volume pool for glacial acetic acid, and then converted into value using consistent price and currency assumptions. To make sure the totals did not drift, results were corroborated with selective bottom-up approximations, such as sampled supplier and distributor checks, and a volume-by-end-use sanity pass built from downstream indicators.
Key inputs that guided the model included nameplate capacity and announced expansions, estimated utilization rates, import and export balances, methanol and energy cost direction (as key cost drivers that influence operating decisions), and the demand pace from large downstream uses like VAM and solvents. Pricing was not treated as a single global number, since regional spreads can widen when trade flows tighten or when outages occur, so we used region-level price bands and then tested them with interview feedback.
For forecasting, scenario analysis was used to translate the outlook for downstream demand and operating conditions into volume and price paths, and the scenarios were reconciled to what industry participants consider achievable. Where bottom-up checks had missing coverage, the gaps were handled through regional scaling based on trade intensity and known production footprint, and then rechecked so the final series remained consistent year to year.
Data Validation & Update Cycle
Validation is done in multiple steps so the final numbers stay stable and explainable. We compare outputs against independent signals such as trade balances, utilization direction, and whether implied demand growth aligns with downstream chemical activity, and then investigate sharp jumps that cannot be explained by a plant event or a price move.
Before sign-off, assumptions and calculations go through an internal analyst review, followed by targeted re-contacts when the variance is outside an acceptable range. The report is refreshed annually, and interim updates are triggered when material events occur, such as major capacity start-ups, extended shutdowns, or policy changes that alter trade. Right before delivery, a final review pass is completed so clients receive the latest updated view.
Mordor Intelligence's Glacial Acetic Acid Market Size Compared Against Other Published Estimates
Published market sizes for glacial acetic acid often do not match because the scope boundary is set differently and the conversion from volume to value is not handled in the same way. Differences usually come from what is counted as merchant sales versus captive use, what purity and grade lines are included, and whether the estimate is built around production capability or end-use demand.
By tracking manufacturer-gate merchant volumes and refreshing region-level price and currency assumptions each cycle, Mordor Intelligence keeps the estimate anchored to the traded glacial acetic acid pool instead of mixing in adjacent acetyl products or non-merchant consumption. The remaining spread typically comes from how firms treat downstream derivatives, how aggressive their price escalation is over the forecast window, and whether trade checks are used to catch regional overcounts.
Benchmark comparison
| Source | Market Size | Gaps in Research Methodology |
|---|---|---|
| Mordor Intelligence | USD 7.66 B (2026) | |
| Industry Publisher A | USD 8.80 B (2024) | Value is presented directly without showing a clear merchant-volume boundary, and the study window uses a different base year and may blend wider grade coverage into one revenue line. |
| Industry Publisher B | USD 8.52 B (2024) | The estimate appears to use a broader application and channel structure, and it does not clearly separate glacial acid merchant sales from adjacent acetyl chains when building revenue totals. |
Overall, the table shows that most of the gap is timing and scope related, not a simple math error. When the market is defined around merchant glacial volumes and then priced with region-consistent assumptions that are checked against trade and utilization signals, the resulting size stays easier to trace and update as new capacity and pricing conditions emerge.
Key Questions Answered in the Report
What is driving the fastest growth segment in the glacial acetic acid market?
Pharmaceutical Grade material is growing at a 6.82% CAGR because of tighter purity demands in API synthesis and injectable drug formulations.
Which application consumes the largest volume of glacial acetic acid?
VAM production uses 34.70% of 2025 volumes, supporting adhesives, paints, and flexible packaging markets.
Why is Asia-Pacific expected to retain its lead?
The region combines 62.60% of 2025 volume with new capacity additions in China and India, and posts a 6.72% CAGR through 2031.
How are producers mitigating methanol price volatility?
Strategies include captive methanol integration, bio-based feedstock adoption, and commodity hedging.
Which new technologies could disrupt the market?
CO₂-to-acetic-acid and cellulosic biomass routes promise lower carbon footprints and reduced reliance on fossil methanol.
What is the outlook for solvent applications?
Solvents are projected to rise at a 6.43% CAGR as acetic-acid-based systems gain favor in adhesives and sealants under stricter VOC rules.
What is the current market size of glacial acetic acid market?
The Glacial Acetic Acid Market size is estimated at 12.38 Million tons in 2026, and is expected to reach 16.12 Million tons by 2031, at a CAGR of 5.43% during the forecast period (2026-2031).