
Market Overview
| Study Period | 2021 - 2031 |
|---|---|
| Forecast Data Period | 2026 - 2031 |
| Historical Data Period | 2021 - 2024 |
| Market Volume (2026) | 132.25 gigawatt |
| Market Volume (2031) | 235.5 gigawatt |
| Growth Rate (2026 - 2031) | 12.23 % |
| Market Concentration | Medium |
Major Players *Disclaimer: Major Players sorted in no particular order Image © Mordor Intelligence. Reuse requires attribution under CC BY 4.0. | |
Germany Solar Energy Market Analysis by Mordor Intelligence
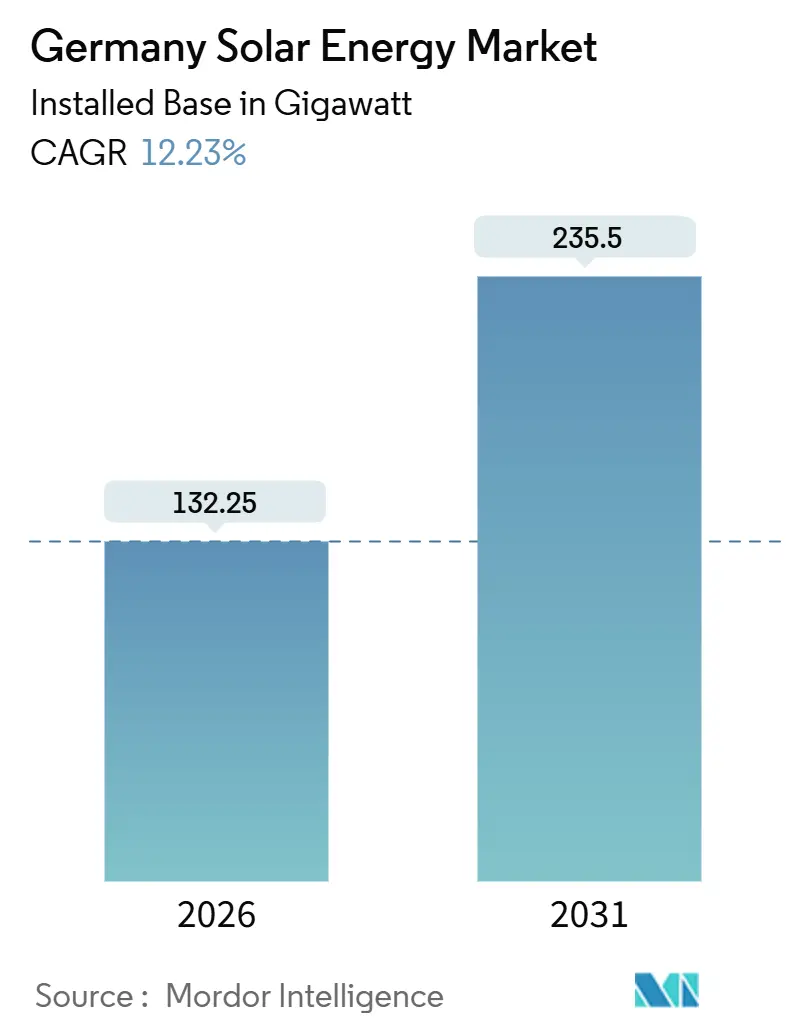
The Germany Solar Energy Market size in terms of installed base is expected to grow from 132.25 gigawatt in 2026 to 235.5 gigawatt by 2031, at a CAGR of 12.23% during the forecast period (2026-2031).
A federal permitting overhaul in 2024 spurred an 86% jump in approved projects, positioning the country to command roughly 60% of all solar capacity auctioned across Europe in the first half of 2025. Developers added 16.2 GW in 2024, and preliminary 2025 figures show another 15.9 GW, underscoring a rapid build-out that lifted solar generation to 63.3 TWh in 2024 and an expected 89 TWh in 2025. Utility-scale plants now compete head-to-head with wholesale power prices as module costs collapsed to about USD 0.11 per watt-DC in early 2024, enabling bids below 5 cents / kWh even after capture-rate discounts. Behind-the-meter PV plus storage adoption is surging because redispatch costs above EUR 4 billion flow through rising grid fees, cutting typical commercial payback periods to under eight years.
Key Report Takeaways
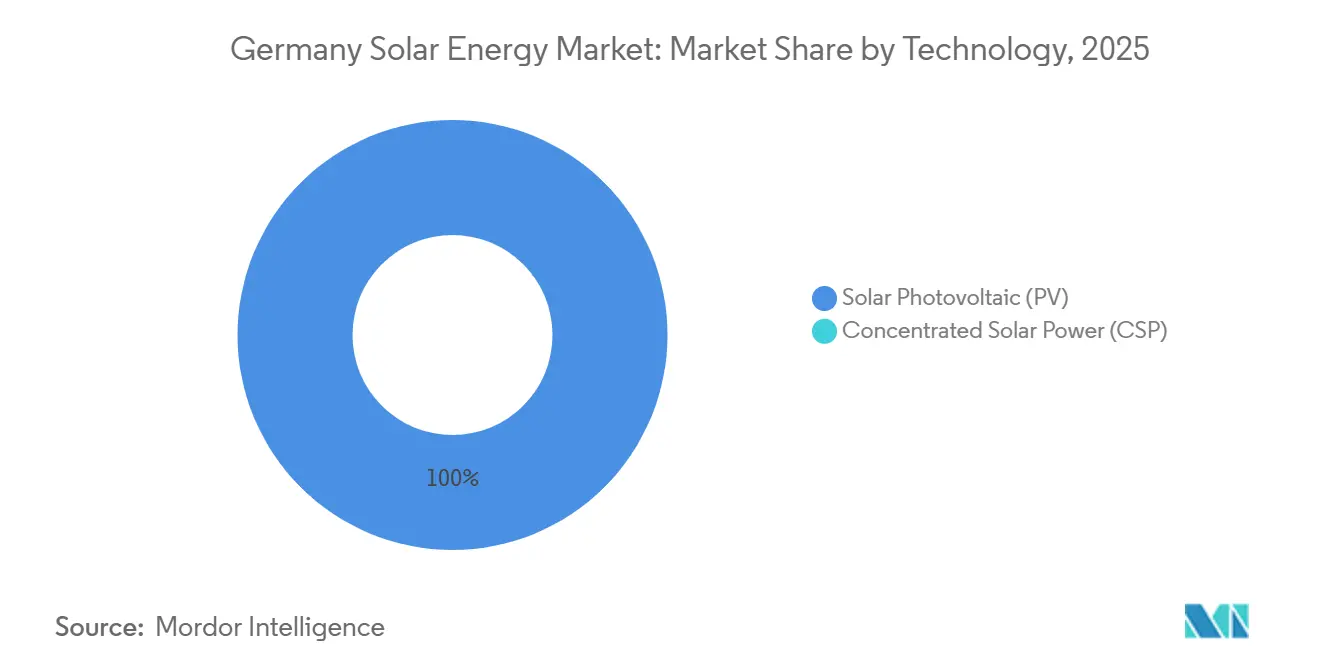
- By technology, solar PV held 100% of Germany's solar energy market share in 2025 and is forecast to grow at a 12.2% CAGR through 2031.
- By grid type, on-grid systems accounted for 94.1% of Germany's solar energy market size in 2025, while off-grid installations are expanding at a leading 16.4% CAGR to 2031.
- By end-user, utility-scale projects captured 50.5% of Germany's solar energy market share in 2025 and are projected to rise at 14.9% CAGR through 2031.
Note: Market size and forecast figures in this report are generated using Mordor Intelligence’s proprietary estimation framework, updated with the latest available data and insights as of January 2026.
Germany Solar Energy Market Trends and Insights
Drivers Impact Analysis*
| Driver | (~) % Impact on CAGR Forecast | Geographic Relevance | Impact Timeline |
|---|---|---|---|
| Solar Package I & Rooftop Mandates Accelerating Approvals | +2.1% | National, with early gains in Bavaria, Baden-Württemberg | Short term (≤ 2 years) |
| Corporate PPA Boom Lifting Unsubsidised Utility Projects | +1.8% | National, concentrated in North Rhine-Westphalia, Lower Saxony | Medium term (2-4 years) |
| Rising Grid-Fee Inflation Driving Behind-the-Meter PV + Storage | +1.5% | National, urban commercial hubs | Medium term (2-4 years) |
| Mass Adoption of Balcony-Plug-in PV by Renters | +0.9% | National, urban centers (Berlin, Hamburg, Munich) | Short term (≤ 2 years) |
| 87% Module-Price Collapse Enables Cost-Parity vs. Wholesale | +2.4% | National | Short term (≤ 2 years) |
| Integrated BIPV Requirements in New-Build Codes (from 2026) | +1.2% | National, state-level enforcement in Baden-Württemberg, Bavaria | Long term (≥ 4 years) |
| Source: Mordor Intelligence | |||
Solar Package I & Rooftop Mandates Accelerating Approvals
The 2024 Solar Package I simplified registrations and raised the balcony-PV inverter limit to 800 W, allowing tenants to self-install systems without landlord consent. Registrations reached about 780,000 units by year-end 2024, adding 435,000 systems in a single year and equaling 2.6% of national solar additions. State-level mandates now require solar on new roofs in Baden-Württemberg and Bavaria, cutting average permitting times from 18 months to under six and adding roughly 2.1 percentage points to forecast growth. Rooftop auction volumes ticked up in October 2025, with 281 MW awarded at 9.66 cents/kWh, confirming early traction. The driver is strongest in southern states, but uptake is expected to broaden as other regions align with the revised Energy Performance of Buildings Directive.
Corporate PPA Boom Lifting Unsubsidised Utility Projects
Long-term corporate PPAs are increasingly displacing subsidy auctions. Energiekontor’s 2024 deal with Currenta to power a chemical park shows industrial buyers locking in fixed-price solar to hedge wholesale volatility. Unsubsidised projects already propel growth because developers can finance plants outside capped auction volumes. North Rhine-Westphalia and Lower Saxony lead activity thanks to large industrial loads, lower curtailment risk, and quicker grid connections. Falling module prices let developers offer PPA rates below 5 cents/kWh, supporting pipeline acceleration through 2028.
Rising Grid-Fee Inflation Driving Behind-the-Meter PV + Storage
Annual redispatch costs above EUR 4 billion inflate network charges, motivating businesses to cut imports with rooftop PV paired with batteries. Bundesnetzagentur logged 9,710 storage connection requests in 2024, equal to 400 GW of power and 661 GWh of energy, but only 921 plants were live, highlighting grid bottlenecks.[1] When batteries are added, commercial paybacks fall to under eight years compared with 12 years for PV alone. Urban commercial hubs feel the strongest pull as high demand coincides with expensive grid tariffs.
Mass Adoption of Balcony-Plug-in PV by Renters
Balcony systems give renters cheap self-generation. Official registrations hit 780,000 by end-2024, likely understating true adoption that may already top 1 million units. Each kit averages 0.5 kW, summing to about 0.4 GW or 2.6% of 2024 solar capacity growth. Uptake is heavily urban, notably in Berlin, Hamburg, and Munich.
Restraints Impact Analysis*
| Restraint | (~) % Impact on CAGR Forecast | Geographic Relevance | Impact Timeline |
|---|---|---|---|
| Distribution-Grid Congestion & 24-Month Queue Times | -1.9% | National, acute in Bavaria, Baden-Württemberg | Medium term (2-4 years) |
| Skilled-Labour Shortages in Licensed Electricians & Installers | -1.3% | National | Medium term (2-4 years) |
| 60% Cost Gap on EU-vs-China Modules Creating Supply-Risk | -0.8% | National, EU-wide supply-chain exposure | Short term (≤ 2 years) |
| Declining FiTs & Sudden Subsidy Tweaks Eroding Residential ROI | -1.1% | National, residential segment | Short term (≤ 2 years) |
| Source: Mordor Intelligence | |||
Distribution-Grid Congestion & 24-Month Queue Times
Connection backlogs near 24 months in Bavaria and Baden-Württemberg delay project cashflow and shave 1.9 percentage points off the baseline CAGR. Redispatch costs above EUR 4 billion in 2022 and onshore solar curtailment topping 13% on peak 2024 days illustrate the grid’s limited headroom.[2] Developers are redirecting pipelines toward Lower Saxony and North Rhine-Westphalia, yet even there, transformer slots fill fast, forcing bids to price in lower capture rates. Bundesnetzagentur still issued around 3,800 connection commitments in 2024, but the gap between commitment and energization widens every quarter. Unless accelerated cable upgrades materialize, the German solar energy market faces staggered commissioning schedules that dampen near-term additions.
Skilled-Labour Shortages in Licensed Electricians & Installers
More than half of installation firms reported critical hiring gaps in 2025, lifting wage bills and stretching lead times from six to nine months for residential rooftops. The overlap between heat-pump and PV skill sets intensifies competition for certified electricians, subtracting about 1.3 percentage points from forecast growth. Federal training schemes launched in 2024 aim to certify 10,000 new installers annually, but meaningful relief will not arrive before 2027. As a result, developers phase projects to match labor availability rather than capital access, and component stock often sits in warehouses awaiting crews. The constraint is national, but rural districts with the fastest build-outs feel the tightest pinch.
*Our forecasts treat driver/restraint impacts as directional, not additive. The impact forecasts reflect baseline growth, mix effects, and variable interactions.
Segment Analysis
By Technology: Solar PV Retains Total Share, Tandems Promise Density Gains
Solar PV held 100% of Germany's solar energy market share in 2025 and is forecast to expand at 12.2% annually through 2031. Efficiency leaps matter more than raw silicon volume now that Fraunhofer ISE and Hanwha Q CELLS certified a 30.8% perovskite-silicon tandem cell in 2024, hinting at commercial modules by 2028. Higher power density can cut racking and land costs up to 15%, a vital lever as permitting favors brownfield sites. Agrivoltaic pilots in Bavaria show crops and panels co-existing under elevated bifacial trackers, easing land-use opposition and broadening farmer income. Concentrated solar power remains absent because diffuse irradiation weakens its thermodynamic advantage.
Perovskite durability is the remaining hurdle, but German research spending represented 64% of EU private PV R&D during 2010-2020, positioning domestic labs to solve it. Once bankability proofs emerge, utility developers can fit more megawatts per kilometer of feeder line, alleviating some curtailment. The German solar energy market, therefore, embeds a technology upside optionality that could temper future grid constraints by delivering more output per site footprint.

By Grid Type: On-Grid Dominates, but Off-Grid Grows Quickest
On-grid arrays accounted for 94.1% of Germany's solar energy market size in 2025. They benefit from auction prices that fell to 4.84 cents /kWh in July 2025, below the 7.85 cents wholesale average, even after negative-price discounts. However, off-grid and microgrid systems are rising 16.4% per year as industrials chase energy security and tariff avoidance. Remote agrivoltaics powering irrigation pumps, plus containerized PV-battery-diesel hybrids at factories, headline this surge.
Developers quote four-year paybacks when batteries let factories shave peak-demand surcharges. Grid operators welcome the relief, yet still require permits for back-feed capability, extending paperwork cycles. Because off-grid avoids curtailment entirely, financiers see lower revenue volatility. Over the forecast, its share inches upward but remains single-digit, keeping on-grid the anchor of the German solar energy market.
By End-User: Utility-Scale Leads on PPAs, Residential Lags on Tariffs
Utility-scale plants captured 50.5% of Germany's solar energy market share in 2025 and will post the fastest 14.9% CAGR to 2031. Corporate PPAs let developers bypass auction caps; Energiekontor’s supply deal to Currenta’s chemical park is emblematic. Large arrays also secure dedicated transmission corridors, cutting queue risk. Commercial and industrial rooftops follow, thanks to grid-fee inflation that lowers eight-year payback thresholds.
Residential rooftops, once the growth engine, now face declining tariffs and policy uncertainty. Balcony-plug-in kits soften the slowdown but cannot offset the wattage gap versus full roofs. Overall, end-user dynamics skew toward players with creditworthy offtakers and balance-sheet strength, underscoring consolidation pressure in the German solar energy market.

Geography Analysis
Bavaria added 4 GW in 2024, maintaining the state lead, yet rising curtailment and 24-month queues push developers north. Lower Saxony and North Rhine-Westphalia now host the bulkiest utility-scale pipelines because stronger grids couple with industrial PPA demand. Saxony’s 162 MW plant, commissioned in 2024, signals eastern states’ ability to clear land quickly and tap spare transmission.
Southern rooftop strength endures due to high irradiance and strict building mandates that start in 2026. Baden-Württemberg and Bavaria require 0.06 kW per square meter on new roofs, adding roughly 1.2 GW a year once fully enforced. Meanwhile, Berlin, Hamburg, and Munich drive mass balcony-PV adoption, widening urban self-generation as grid fees bite renters.
Cross-border electricity flows sharpen regional urgency. Germany was a net importer in 2024, buying 67 TWh and exporting 35 TWh, so every new solar gigawatt cuts external dependence.[3] EU-wide REPowerEU goals place moral suasion on laggard states to accelerate permits. Consequently, the geography split of the German solar energy market is re-balancing: southern states still dominate rooftops, but northern and eastern regions now command the growth pulse in utility-scale capacity.
Regulatory Landscape
Germany's solar framework is anchored by the Renewable Energy Sources Act (EEG 2023, as amended), which ties support eligibility to registration in the Marktstammdatenregister and routes price discovery through Bundesnetzagentur-administered auctions. Bundesnetzagentur runs two main auction tracks, ground-mounted systems and roof-top/building-integrated systems. For 2026, it sets 3,300,000 kW per auction date for ground-mounted systems (March 1, July 1, December 1) and 366,667 kW per auction date for roof-top/building-integrated systems (February 1, June 1, October 1).
Policy updates since 2024 have focused on cutting bureaucracy and accelerating approvals, including Solar Package I measures that simplified registrations and widened access for small plug-in PV. In May 2026, Bundesnetzagentur published considerations to reform the regulatory framework for electricity grid connections, with a formal consultation indicated for summer 2026, pointing to the role of connection rules and queue management in how quickly auctioned and merchant solar can reach commissioning.
Competitive Landscape
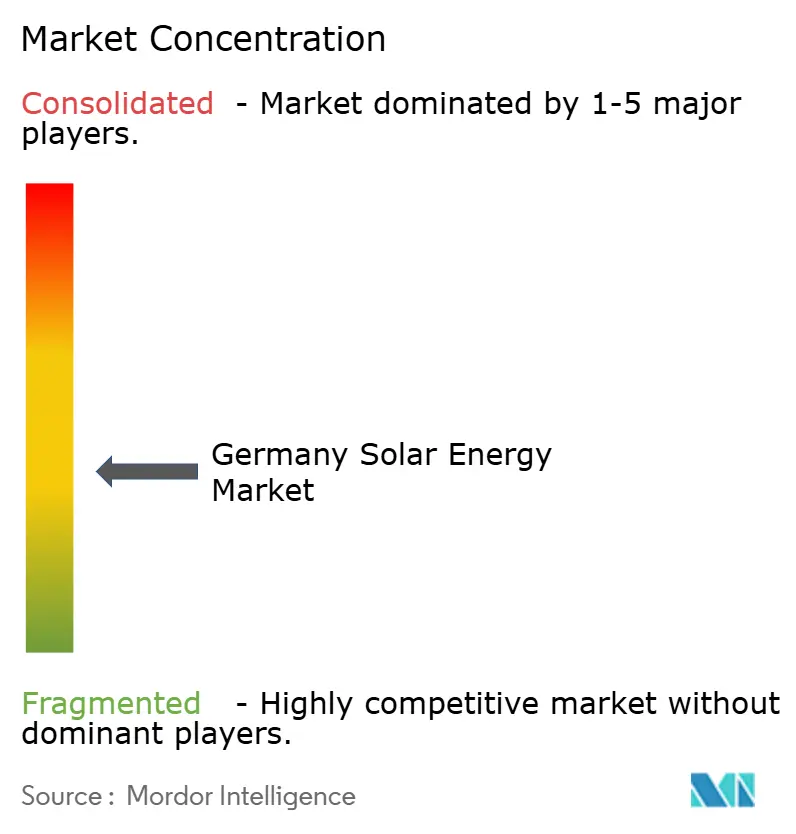
The German solar energy market remains moderately fragmented, with no company controlling more than 10% of installed capacity, yet price-based rivalry is intense because Chinese modules account for 95% of European Union imports. BayWa r.e. entered insolvency in 2024, while Meyer Burger sought court protection in June 2025, underscoring how plunging panel prices to USD 0.11 /W-DC squeezed European manufacturers. Wacker Chemie continues to operate the bloc’s only polysilicon plant at 60,000 t/y, but downstream wafer and cell stages remain Asia-centric, forcing developers in the German solar energy market to rely on long-distance supply chains that amplify geopolitical risk.
Developers are reshaping strategy around long-term corporate PPAs that bypass capped auctions. Energiekontor’s 2024 deal with Currenta locked 50 MW of output for a chemical park in North Rhine-Westphalia, and RWE committed to building 7 GW of new renewables domestically by 2030, all outside subsidy support. SMA Solar, insulated from module price swings, recorded EUR 353.9 million in Q3-2024 sales and a 7.3% EBIT margin by focusing on inverter systems and digital fleet services.[4] These plays illustrate how the German solar energy market rewards firms that pivot toward system integration and power-trading expertise rather than pure module throughput.
Technology leadership is a second battlefront. Hanwha Q CELLS expanded its Thalheim factory to 3.3 GW of module capacity and, together with Fraunhofer ISE, certified a 30.8% perovskite-silicon tandem cell in October 2024, pointing to a commercial launch before 2028. Start-ups such as 1KOMMA5° aggregate small installers on a digital platform to speed residential roll-outs, while Next2Sun pilots vertical bifacial arrays for agrivoltaic dual use. Altogether, competitive moves show that the German solar energy market favors vertically integrated developers, inverter specialists, and niche innovators that can capture value in financing, permitting, and advanced cell architectures.
Germany Solar Energy Industry Leaders
-
BayWa r.e. AG
-
Enerparc AG
-
Hanwha Q CELLS GmbH
-
SMA Solar Technology AG
-
EnBW Energie Baden-Württemberg AG
- *Disclaimer: Major Players sorted in no particular order
Market Opportunities and Future Outlook
A primary opportunity is utility-scale and C&I solar paired with battery storage, where developers and grid operators are working through congestion and price-capture effects by adding flexibility at the plant and site level. Bundesnetzagentur recorded 9,710 storage connection requests in 2024 (400 GW power, 661 GWh energy), while only 921 storage plants were live, which indicates a large conversion gap and supports demand for EPCs, integrators, and project platforms able to execute grid-compliant storage-plus-PV deployments and manage connection processes.
A second opportunity is distributed volume growth, supported by simplified rules and mass-market adoption dynamics. Plug-in balcony PV moved from niche to material scale after Solar Package I, with registrations reaching about 780,000 units by end-2024. Bundesnetzagentur also recorded about 430,000 additional plug-in installations in 2025 (around 0.5 GW). In parallel, EEG auction calendars and the predefined 2026 auction volumes for both ground-mounted and rooftop/building-integrated systems provide a recurring procurement pathway, while corporate PPAs and industrial offtake arrangements (for example, Energiekontor's deal with Currenta) keep unsubsidized procurement active alongside auctions.
Recent Industry Developments
- May 2026: BayWa r.e. secured an eight-year operations management service contract for a major battery storage system in Germany. The agreement strengthens its recurring-services footprint as hybrid solar-plus-storage configurations are used to manage grid constraints and merchant revenue volatility.
- July 2025: EnBW inaugurated an 80 MW solar facility in Langenenslingen, Baden-Wuerttemberg. Bringing one of the state’s largest PV plants online supports continued utility-led build-out in regions where rooftop mandates and local permitting are translating into commissioning activity.
- May 2024: Energiekontor signed a long-term corporate PPA with Currenta to supply solar power to an industrial chemical park. The deal highlights how creditworthy industrial offtakers are underwriting unsubsidized solar pipelines, helping developers finance projects outside capped support volumes.
Research Methodology Framework and Report Scope
Market Definition and Coverage
For this report, the market is defined as solar power capacity installed in Germany, measured as cumulative installed capacity in gigawatts, across solar PV and CSP systems used by utility, commercial, and residential users.
Scope exclusions: We exclude imported electricity from other countries and very small off-grid pico-solar kits below 1 kW that are not tracked consistently in national capacity totals.
Segmentation Overview
- By Technology
- Solar Photovoltaic (PV)
- Concentrated Solar Power (CSP)
- By Grid Type
- On-Grid
- Off-Grid
- By End-User
- Utility-Scale
- Commercial and Industrial (C&I)
- Residential
- By Component (Qualitative Analysis)
- Solar Modules/Panels
- Inverters (String, Central, Micro)
- Mounting and Tracking Systems
- Balance-of-System and Electricals
- Energy Storage and Hybrid Integration
Data Sources, Market Sizing, and Validation
Desk Research
Desk research set the factual base for the model, especially around installed capacity, annual additions, and the policy and grid context that affects build rates. We mainly relied on public sources such as German federal energy and climate publications, national grid and system operator statistics, international energy agency dashboards, and large renewable trade association releases.
To make inputs usable year to year, we also reviewed customs and trade statistics for PV equipment flows, patent databases to sense technology direction (for example inverter and module efficiency changes), and public company filings and investor decks to understand typical pricing and delivery timing. For spot checks, we used a paid subscription for company financials and another for news and financials to confirm major project announcements and commissioning dates. These examples are not exhaustive, and other public sources were also used for data collection, validation, and research clarification.
Primary Interviews and Surveys
Primary interviews and surveys were used to pressure-test build-out expectations and the implied pace of commissioning, since capacity markets can shift faster than annual summaries captured in public datasets. We spoke with stakeholders across development, EPC, distribution, and buyer groups, and we also included voices that track permitting, grid connection, and financing constraints to close the gaps left by public data.
Coverage was balanced across Germany-wide demand pockets so that assumptions on rooftop pull, utility pipeline timing, and grid readiness could be checked against what is being contracted and installed in the field.
Distribution of primary research fieldwork respondents
| Company type | Respondent position |
|---|---|
| Top tier: 31% | CXOs: 17% |
| Mid tier: 49% | Functional/Unit leaders: 37% |
| Smaller Players: 20% | Managers: 46% |
Market-Sizing & Forecasting
Sizing starts with a top-down reconstruction of Germany installed solar capacity using official capacity series and annual commissioning additions, and then it is translated into the report scope across PV and CSP, grid type, and end-use context. Once the national totals were anchored, selective bottom-up approximations were used to sanity-check the curve, such as sampled project pipeline roll-ups, distributor channel checks on module and inverter volumes, and typical ASP times volume checks for equipment value signals.
Key inputs that shaped the model included annual capacity additions (GW), grid-connection and permitting lead times, auction and tariff signals that affect utility economics, rooftop adoption indicators (such as residential and C&I installation momentum), and expected technology-driven performance and repowering patterns. For forecasting, scenario analysis was applied around policy continuity, grid bottlenecks, and financing conditions, and the final trajectory was refined after expert feedback aligned the assumptions to what is realistically buildable each year. Where bottom-up signals were incomplete, gaps were handled by using conservative penetration ranges and then rechecking the implied totals against the official capacity series before finalizing.
Data Validation & Update Cycle
Outputs are checked against independent signals such as reported yearly additions, policy targets, and grid readiness indicators, and any large step changes are reviewed to confirm that they reflect real commissioning behavior rather than a modeling artifact. Before sign-off, the model goes through a multi-step analyst review, and respondents are re-contacted when assumptions drift from what is being observed in procurement, permitting, or interconnection timelines.
The report is refreshed annually, and interim updates are made when a material policy change, tariff revision, or major pipeline shift is confirmed. Right before delivery, an analyst completes a fresh pass on the newest public releases so clients receive the latest updated view.
Mordor Intelligence's Germany Solar Energy Market Size Compared With Other Published Estimates
Published market sizes for Germany solar can look far apart because some sources measure revenue from equipment and services, while others track installed capacity, and each choice changes the number and even the unit. Differences also come from what is counted as solar, how grid-connected versus off-grid systems are treated, and whether the estimate follows commissioning timing or sales timing.
Annual installed-capacity additions and the cumulative GW totals reported in official statistics are the evidence used to keep Mordor Intelligence's estimate tied to what is physically installed in Germany, rather than mixing in broader solar solution revenues or adjacent storage value.
Benchmark comparison
| Source | Market Size | Gaps in Research Methodology |
|---|---|---|
| Mordor Intelligence | USD 132.25 B (2026) | |
| Global Consultancy A | USD 6.50 B (2024) | This figure is revenue-based for photovoltaic products, so it reflects equipment sales value and pricing assumptions, not cumulative installed capacity in GW. Service bundles and component boundaries can also shift the total, especially when installation and O&M are included. |
| Industry Publisher B | USD 2.40 B (2024) | This estimate is framed as solar energy solutions and can include system packages and services, which makes it sensitive to what is bundled and the assumed mix of residential and C&I systems. It also uses a different base year and may align to sales cycles rather than commissioning dates. |
The table shows that the spread is mainly a unit and scope issue, not a simple disagreement on market direction. When capacity tracking is separated from solution revenue, and when commissioning timing is used consistently, the resulting market size becomes easier to reproduce and update with clear public signals and practical field checks.
Key Questions Answered in the Report
How large is Germany’s installed solar base in 2026?
Installed capacity reached 132.25 GW in 2026 and is projected to grow at a 12.23% CAGR to 235.5 GW by 2031.
What segments are expanding fastest within German solar?
Utility-scale plants grow the quickest at a 14.9% CAGR, propelled by corporate PPAs and merchant exposure.
Why are module prices so low in Germany now?
A global 87% price collapse from 2022 highs, driven by Chinese oversupply and cheaper polysilicon, pushed spot rates to about USD 0.11 /W-DC.
Which states attract the most new utility-scale projects?
Lower Saxony, North Rhine-Westphalia, and Saxony draw rising investment thanks to stronger grids and shorter connection queues.
How do rising grid fees influence commercial PV adoption?
Higher network charges make behind-the-meter PV plus batteries profitable in under eight years, spurring rapid uptake among businesses.