Germany Fertilizer Market Size and Share
Market Overview
| Study Period | 2017 - 2030 |
|---|---|
| Base Year For Estimation | 2024 |
| Forecast Data Period | 2025 - 2030 |
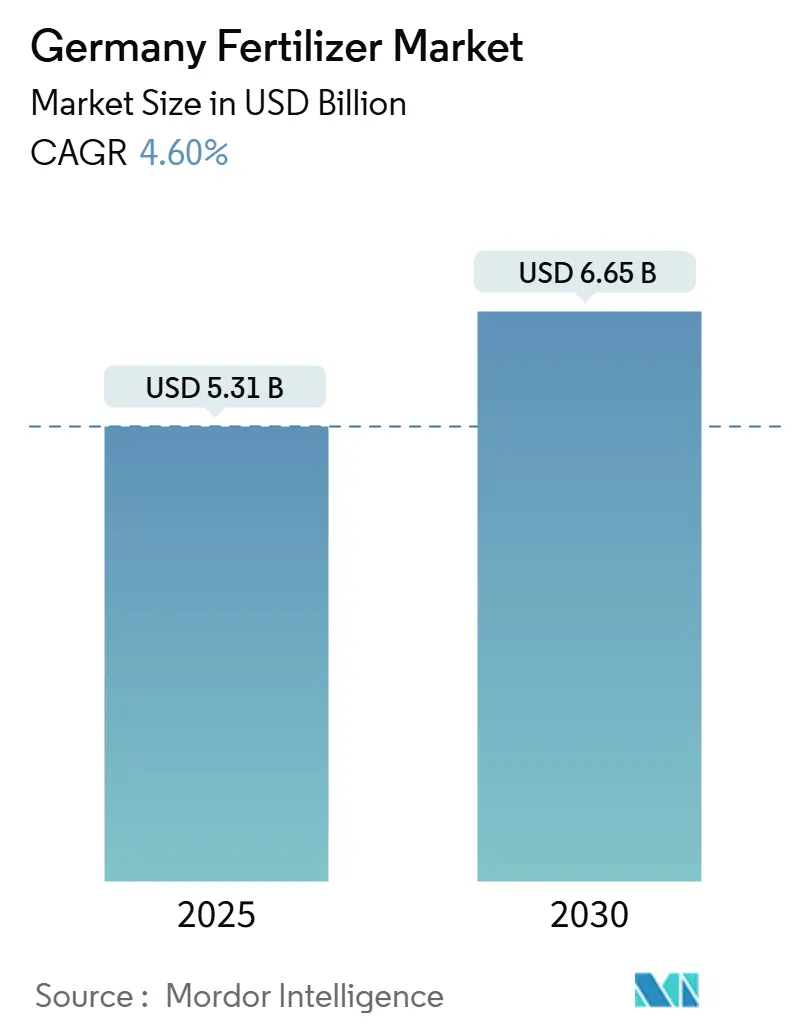
| Market Size (2025) | USD 5.31 Billion |
| Market Size (2030) | USD 6.65 Billion |
| Growth Rate (2025 - 2030) | 4.60% CAGR |
| Market Concentration | Low |
Major Players
*Disclaimer: Major Players sorted in no particular order Image © Mordor Intelligence. Reuse requires attribution under CC BY 4.0. |
|
Germany Fertilizer Market Analysis by Mordor Intelligence
The Germany Fertilizer market size is valued at USD 5.31 billion in 2025 and is projected to reach USD 6.65 billion by 2030, advancing at a 4.6% CAGR during the forecast period. Demand growth stems from the rapid shift toward precision farming, the uptake of enhanced-efficiency nutrients, and tougher environmental rules that favor lower-emission products.[1]Source: Federal Ministry of Food and Agriculture, “Fertilisation in Agriculture,” BMEL.DE Digital tools that fuse soil data, weather feeds, and satellite imagery are helping growers match application rates to crop needs, while public funding for smart equipment is expanding adoption in Bavaria, Baden-Württemberg, and other intensive regions. Green ammonia import corridors, led by the H2Global program, are laying the groundwork for a decarbonized nitrogen supply chain, and higher commodity prices have improved farm cash flow, turning fertilizers into a planned investment rather than a cost. Competition is moderate with the five largest vendors commanding 32.7% of value, leaving room for specialty suppliers that focus on controlled-release and water-soluble grades. Long-run opportunities center on products that ease compliance with nitrate caps, improve soil carbon scores, or integrate seamlessly with fertigation systems.
Key Report Takeaways
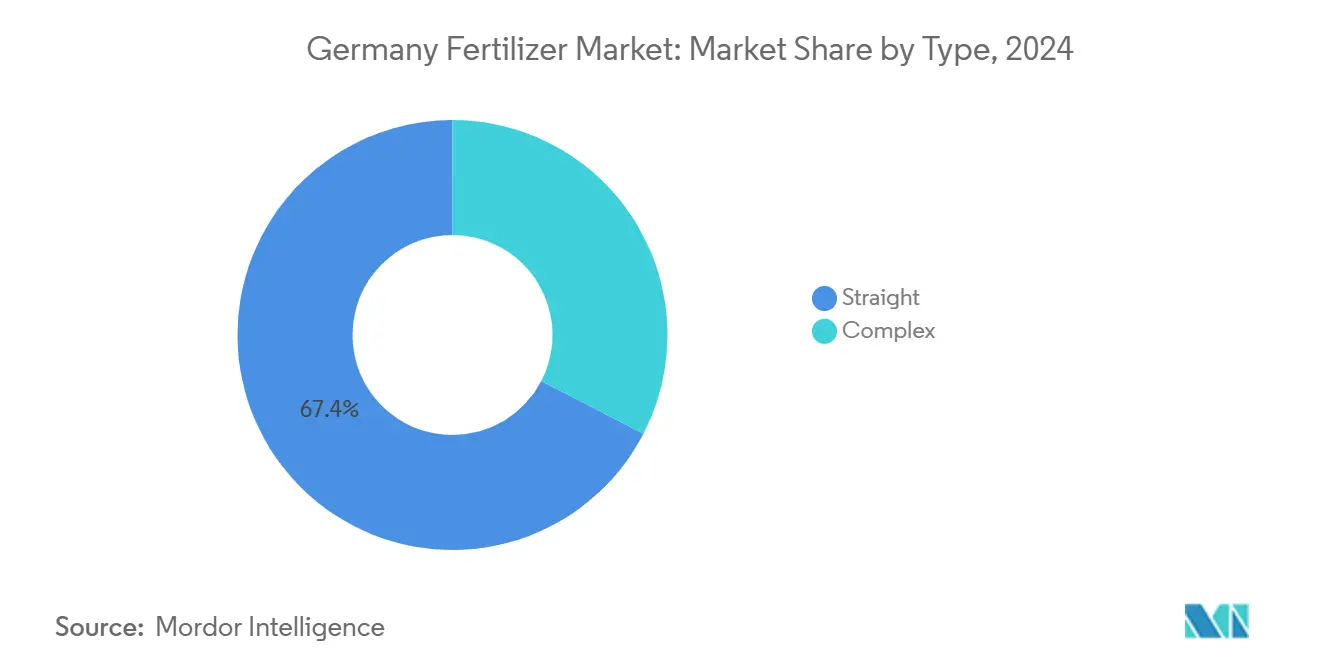
- By Type, straight fertilizers held 67.4% of Germany Fertilizer market share in 2024 and are forecast to post the fastest 5.3% CAGR to 2030.
- By Form, conventional grades captured 83.8% of Germany Fertilizer market size in 2024, while specialty grades are set to grow at a 5.1% CAGR through 2030.
- By Application Mode, soil methods accounted for 85.1% of the value in 2024, while fertigation is advancing at a 5.0% CAGR to 2030.
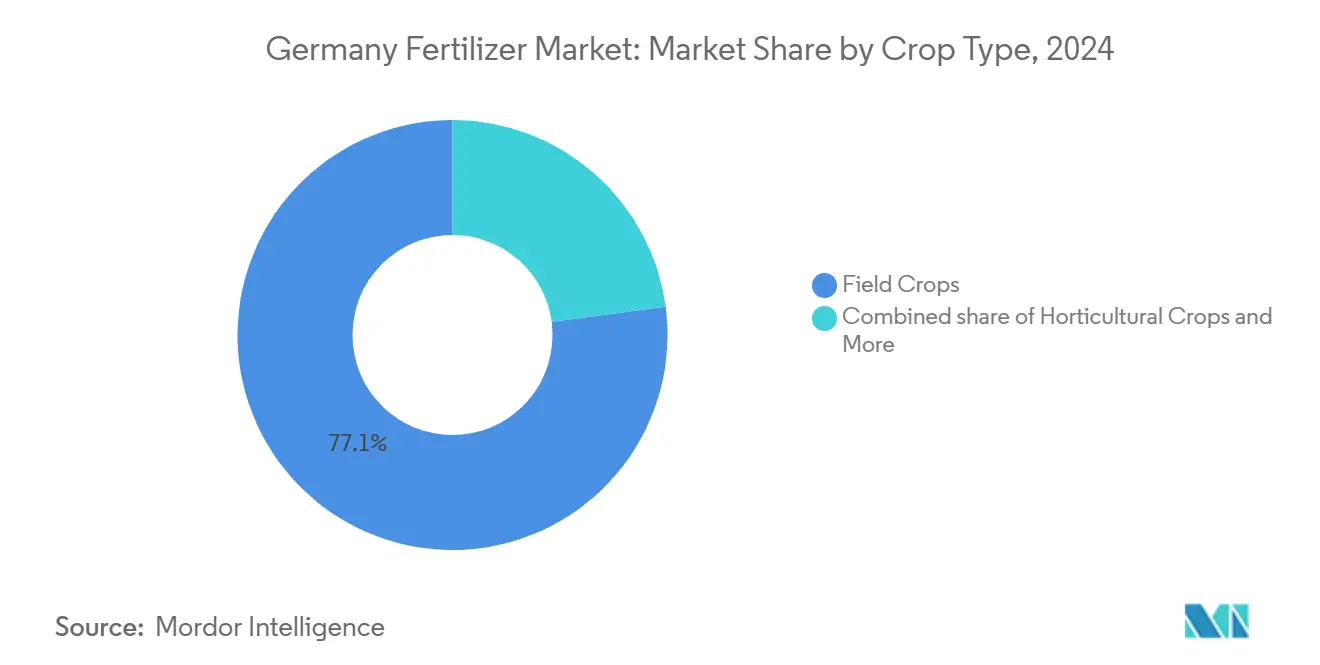
- By Crop Type, field crops led with 77.1% revenue share in 2024, while horticulture is expanding at a 5.2% CAGR through 2030.
Germany Fertilizer Market Trends and Insights
Drivers Impact Analysis
| Driver | (~) % Impact on CAGR Forecast | Geographic Relevance | Impact Timeline |
|---|---|---|---|
| Precision-ag fertigation boom | +1.2% | Bavaria and Baden-Württemberg first, now national | Medium term (2-4 years) |
| Demand for enhanced-efficiency fertilizers | +0.9% | Intensive grain and specialty crop belts | Long term (≥ 4 years) |
| Greenhouse and hydroponic expansion | +0.7% | Urban fringes and protected zones | Medium term (2-4 years) |
| Rising crop prices and farm income | +0.8% | Country-wide, notable for grains and sugar beet | Short term (≤ 2 years) |
| Federal humus carbon-credit scheme | +0.5% | Carbon-intensive arable regions | Long term (≥ 4 years) |
| Green-ammonia import corridors | +0.4% | Northern port states | Long term (≥ 4 years) |
| Source: Mordor Intelligence | |||
Precision-ag fertigation boom
Germany's precision agriculture revolution is fundamentally reshaping fertilizer application methods, with fertigation systems experiencing unprecedented adoption rates among commercial growers. The integration of IoT sensors, GPS-guided application equipment, and variable-rate technology enables farmers to optimize nutrient delivery with unprecedented precision, reducing input costs while maximizing crop yields. Digital agriculture platforms now monitor soil conditions in real-time, allowing for dynamic fertilizer adjustments based on weather patterns, crop growth stages, and nutrient availability.
Demand for enhanced-efficiency fertilizers
Controlled-release, stabilized nitrogen, and nitrification-inhibitor products shield nutrients from volatilization and leaching, a key advantage as nitrate-vulnerable zones rise to 28% of farmland[2]Source: German Federal Environment Agency, “Nitrate Contamination in Groundwater,” UBA.DE. BASF’s investment of EUR 150 million (USD 163 million) at Ludwigshafen expands the local supply of urease-inhibitor coatings, while premium pricing gaps tighten as growers factor in fewer passes and higher yield stability. The premium pricing of enhanced-efficiency fertilizers, typically 20-30% higher than conventional products, is being offset by reduced application frequency and improved crop performance, making these technologies economically viable for progressive farmers.
Greenhouse and hydroponic expansion
Germany's protected cultivation sector is experiencing robust growth, driven by consumer demand for locally produced vegetables, climate change adaptation strategies, and year-round production capabilities. The country's greenhouse area expanded by 8% in 2024, with new facilities incorporating advanced climate control systems and soilless growing media that require specialized fertilizer formulations. Hydroponic and aeroponic systems demand water-soluble fertilizers with precise nutrient ratios, creating opportunities for specialty fertilizer manufacturers to develop customized solutions.
Rising crop prices and farm income
Elevated commodity prices for key German crops, including wheat, rapeseed, and sugar beets, are providing farmers with increased financial capacity to invest in premium fertilizer technologies and precision application equipment. The war in Ukraine disrupted global grain markets, leading to sustained price increases that improved German farm profitability and fertilizer purchasing power throughout 2024. Higher crop values justify the use of enhanced-efficiency fertilizers and precision agriculture technologies that optimize yield potential and quality parameters. German farmers are increasingly viewing fertilizer investments as profit centers rather than cost centers, leading to more sophisticated nutrient management strategies and a willingness to adopt premium products.
Restraints Impact Analysis
| Restraint | (~) % Impact on CAGR Forecast | Geographic Relevance | Impact Timeline |
|---|---|---|---|
| Stricter nitrate application caps | -0.8% | National, with intensive enforcement in water protection zones | Short term (≤ 2 years) |
| Volatile gas and phosphate-rock costs | -0.6% | National, affecting all fertilizer types | Short term (≤ 2 years) |
| Protest-driven policy uncertainty | -0.4% | National, concentrated in agricultural regions | Medium term (2-4 years) |
| Protein-crop rotation cannibalizing N demand | -0.3% | National, affecting grain-producing regions | Long term (≥ 4 years) |
| Source: Mordor Intelligence | |||
Stricter Nitrate Application Caps
Germany's implementation of increasingly restrictive nitrate application limits under the revised Fertilizer Ordinance is constraining traditional fertilizer usage patterns and forcing farmers to reconsider their nutrient management strategies. The designation of additional nitrate-vulnerable zones, now covering approximately 28% of German agricultural land, imposes mandatory reductions in nitrogen application rates of up to 20% compared to crop requirements. These restrictions are particularly challenging for intensive crop production systems that have historically relied on high nitrogen inputs to maximize yields.
Volatile Gas and Phosphate-Rock Costs
The German fertilizer industry's exposure to volatile natural gas and phosphate rock prices creates significant cost pressures that impact both manufacturer margins and farmer purchasing decisions. Natural gas price volatility, exacerbated by geopolitical tensions and supply chain disruptions, directly affects the costs of ammonia and urea production, with gas accounting for 70-80% of nitrogen fertilizer production expenses.
Segment Analysis
By Type: Straight products hold sway while micronutrients climb
Straight fertilizers command 67.4% market share in 2024, reflecting German farmers' preference for single-nutrient products that enable precise nutrient management and cost optimization. The segment's dominance stems from the flexibility it provides in customizing fertilizer programs based on soil testing results and crop-specific requirements. Urea remains the leading nitrogen source due to its high nutrient content and compatibility with precision application equipment, while diammonium phosphate (DAP) and muriate of potash (MoP) maintain strong positions in their respective nutrient categories. Complex fertilizers, representing the remaining market share, are gaining traction in regions where labor costs favor single-application approaches over multiple straight fertilizer treatments.
The fastest-growing segment within the type category is straight fertilizers at 5.3% CAGR through 2030, driven by precision agriculture adoption and enhanced-efficiency formulations. Micronutrient fertilizers, including boron, zinc, and manganese products, are experiencing particularly strong growth as soil testing reveals widespread micronutrient deficiencies in intensive cropping systems. Secondary macronutrients, especially sulfur-containing fertilizers, are benefiting from increased awareness of sulfur's role in protein synthesis and oil quality in rapeseed production. The trend toward customized fertilizer blending at regional distribution centers is supporting straight fertilizer demand, as farmers increasingly seek tailored nutrient solutions rather than standardized complex formulations.
Note: Segment shares of all individual segments available upon report purchase
By Form: Conventional remains predominant yet specialty accelerates
Conventional fertilizers maintain 83.8% market share in 2024, demonstrating the continued importance of traditional granular and prilled formulations in German agriculture. The segment's stability reflects farmers' familiarity with conventional products and their compatibility with existing application equipment and storage infrastructure. Granular urea, DAP, and potash products remain the workhorses of German crop production, offering reliable nutrient delivery at competitive prices. Conventional fertilizers benefit from established supply chains, standardized quality specifications, and widespread dealer networks that ensure product availability across all agricultural regions.
Specialty fertilizers represent the fastest-growing form segment at 5.1% CAGR through 2030, driven by regulatory pressures and farmer demand for enhanced performance characteristics. Controlled-release fertilizers (CRF) are gaining market share in high-value crop production, where their ability to synchronize nutrient release with plant uptake patterns justifies premium pricing. Water-soluble fertilizers are experiencing robust growth in greenhouse and fertigation applications, where precise nutrient control and rapid plant response are critical success factors. Slow-release fertilizers (SRF) are finding applications in environmentally sensitive areas where nitrate leaching restrictions favor extended-release formulations. Liquid fertilizers are expanding beyond their traditional foliar application niche into soil injection and fertigation systems, offering improved mixing capabilities and reduced handling costs compared to dry products.
By Application Mode: Soil spreading dominates yet fertigation quickens
Soil application maintains 85.1% market share in 2024, reflecting the predominance of traditional broadcast and incorporation methods in German crop production systems. The segment's dominance is supported by the widespread availability of conventional spreading equipment and farmers' familiarity with soil-applied fertilizer management practices. Granular fertilizers applied through spinner spreaders and pneumatic applicators remain the most cost-effective method for covering large acreages in field crop production. Soil application methods are continuously evolving to incorporate precision agriculture technologies, including GPS guidance systems and variable-rate application capabilities that optimize nutrient placement and timing.
Fertigation represents the fastest-growing application mode at 5.0% CAGR through 2030, driven by greenhouse expansion and precision agriculture adoption in field crop production. The method's ability to deliver nutrients directly to the root zone through irrigation systems enables precise timing and reduces nutrient losses compared to broadcast applications. German greenhouse operators are increasingly adopting closed-loop fertigation systems that recycle nutrient solutions and minimize environmental impact. Foliar application, while representing a smaller market share, is growing steadily as farmers recognize its value for micronutrient delivery and crop stress mitigation. The integration of drone technology for foliar fertilizer application is creating new opportunities for targeted nutrient delivery in areas inaccessible to ground-based equipment.
By Crop Type: Field crops anchor volumes yet horticulture shines
Field crops command 77.1% market share in 2024, reflecting Germany's position as a major grain and oilseed producer within the European Union. Wheat, barley, rapeseed, and corn production across Germany's 16.7 million hectares of arable land drives the majority of fertilizer consumption, with nitrogen applications representing the largest nutrient requirement. The segment benefits from established crop production practices, government support programs, and strong export markets for German grain and oilseed products. Sugar beet cultivation, concentrated in Lower Saxony and North Rhine-Westphalia, represents a particularly intensive fertilizer user within the field crop category due to its high nutrient requirements and extended growing season.
Horticultural crops represent the fastest-growing segment at 5.2% CAGR through 2030, driven by consumer demand for locally produced vegetables and the expansion of protected cultivation systems. Germany's greenhouse vegetable production, concentrated in regions with favorable climate conditions and proximity to major population centers, requires specialized fertilizer formulations and precise nutrient management. The segment's growth is supported by investments in modern greenhouse facilities equipped with climate control systems and automated fertigation equipment. Turf and ornamental applications, while representing a smaller market share, are benefiting from urbanization trends and increased investment in landscaping and sports facilities. The integration of organic and bio-stimulant products in horticultural production is creating opportunities for specialty fertilizer manufacturers to develop premium formulations that meet consumer preferences for sustainable production methods.
Note: Segment shares of all individual segments available upon report purchase
Geography Analysis
Regional sales trends align with crop intensity and livestock density. Bavaria and Lower Saxony collectively account for a substantial share of the Germany Fertilizer Market in 2024, driven by the nutrient requirements of mixed farms for both crops and forage. Lower Saxony’s sugar beet and pig units push high nitrogen and phosphate use, whereas Bavaria’s dairy meadows lean on potash and sulfur.
Southern states post faster growth due to greenhouse clusters and precision kit subsidies. Baden-Württemberg shows rising orders for water-soluble lines and coated urea as horticulture and specialty fruit acreage expand. Eastern states such as Saxony-Anhalt add capacity in large-scale arable farms adopting variable-rate spreaders that trim wastage yet keep yields steady.
Proximity to import docks shapes supply chains. Schleswig-Holstein, Hamburg, and Bremen are early movers on green ammonia terminals that will anchor low-carbon nitrogen supply after 2027. States with strict water rules create micro-markets for stabilized N and organo-mineral blends, nudging distributors to stock a broader range with tighter just-in-time logistics.
Competitive Landscape
The Germany Fertilizer market hosts global majors and agile specialists. EuroChem Group AG leads nitrogen and phosphate segments through integrated mines and logistic hubs, while K+S Aktiengesellschaft leverages domestic potash to supply chloride and sulfate variants. Yara International ASA differentiates itself via its digital farming suite that links satellite maps to variable-rate plans for clients covering extensive hectares in its first year.
Mid-tier players like AGROFERT and Grupa Azoty S.A. secure share through localized depots and advisory services, tailoring blends to regional soil tests. Patent filings in polymer-coated granules and bio-stimulant carriers have increased, with German institutes partnering on biodegradable coating research.[3]Source: European Patent Office, “Agricultural Technology Database,” ESPACENET.COM
Strategic moves center on capacity and channel control. BASF expanded enhanced-efficiency output with a significant investment, K+S acquired multiple southern depots, and EuroChem secured a cooperative supply deal that locks in distribution volume. Market share mobility stays high because specialty niches let smaller brands edge in without massive capital expenditure.
Germany Fertilizer Industry Leaders
-
EuroChem Group AG
-
K+S Aktiengesellschaft
-
Yara International ASA
-
AGROFERT A.S. (AGROFERT Group)
-
Grupa Azoty S.A.
- *Disclaimer: Major Players sorted in no particular order
Recent Industry Developments
- February 2025: K+S has launched a new line of CO₂-reduced potassium and magnesium fertilizers, aiming to support climate-friendly agriculture. The products are produced using renewable energy and optimized processes to significantly lower carbon emissions.
- May 2024: BASF and IPP to market and sell ammonia, methanol, and melamine plants at the Ludwigshafen Verbund site in Germany. This move aims to optimize asset portfolios and attract strategic partners for key chemical production facilities.
- April 2024: COMPO EXPERT plans to replace 25% of the ammonia used at its facility in Krefeld, Germany, with OCI's lower-carbon product this year. The company also intends to further increase the proportion of OCI-supplied lower-carbon ammonia in its production over the next two years. This partnership supports climate-friendly agriculture by reducing the carbon footprint of fertilizer manufacturing.
Germany Fertilizer Market Report Scope
The Germany Fertilizer Market Report is Segmented by Type (Complex and Straight), Form (Conventional and Specialty), Application Mode (Fertigation, Foliar, and Soil), and Crop Type (Field Crops, Horticultural Crops, and Turf and Ornamental). The Market Forecasts are Provided in Terms of Value (USD) and Volume (Metric Tons).
| Complex | ||
| Straight | Micronutrients | Boron |
| Copper | ||
| Iron | ||
| Manganese | ||
| Molybdenum | ||
| Zinc | ||
| Others | ||
| Nitrogenous | Urea | |
| Others | ||
| Phosphatic | DAP | |
| MAP | ||
| SSP | ||
| TSP | ||
| Potassic | MoP | |
| SoP | ||
| Secondary Macronutrients | Calcium | |
| Magnesium | ||
| Sulfur | ||
| Conventional | |
| Speciality | CRF |
| Liquid Fertilizer | |
| SRF | |
| Water Soluble |
| Fertigation |
| Foliar |
| Soil |
| Field Crops |
| Horticultural Crops |
| Turf and Ornamental |
| Type | Complex | ||
| Straight | Micronutrients | Boron | |
| Copper | |||
| Iron | |||
| Manganese | |||
| Molybdenum | |||
| Zinc | |||
| Others | |||
| Nitrogenous | Urea | ||
| Others | |||
| Phosphatic | DAP | ||
| MAP | |||
| SSP | |||
| TSP | |||
| Potassic | MoP | ||
| SoP | |||
| Secondary Macronutrients | Calcium | ||
| Magnesium | |||
| Sulfur | |||
| Form | Conventional | ||
| Speciality | CRF | ||
| Liquid Fertilizer | |||
| SRF | |||
| Water Soluble | |||
| Application Mode | Fertigation | ||
| Foliar | |||
| Soil | |||
| Crop Type | Field Crops | ||
| Horticultural Crops | |||
| Turf and Ornamental | |||
Market Definition
- MARKET ESTIMATION LEVEL - Market Estimations for various types of fertilizers has been done at the product-level and not at the nutrient-level.
- NUTRIENT TYPES COVERED - Primary Nutrients: N, P and K, Secondary Macronutrients: Ca, Mg and S, Micronutients: Zn, Mn, Cu, Fe, Mo, B, and Others
- AVERAGE NUTRIENT APPLICATION RATE - This refers to the average volume of nutrient consumed per hectare of farmland in each country.
- CROP TYPES COVERED - Field Crops: Cereals, Pulses, Oilseeds, and Fiber Crops Horticulture: Fruits, Vegetables, Plantation Crops and Spices, Turf Grass and Ornamentals
| Keyword | Definition |
|---|---|
| Fertilizer | Chemical substance applied to crops to ensure nutritional requirements, available in various forms such as granules, powders, liquid, water soluble, etc. |
| Specialty Fertilizer | Used for enhanced efficiency and nutrient availability applied through soil, foliar, and fertigation. Includes CRF, SRF, liquid fertilizer, and water soluble fertilizers. |
| Controlled-Release Fertilizers (CRF) | Coated with materials such as polymer, polymer-sulfur, and other materials such as resins to ensure nutrient availability to the crop for its entire life cycle. |
| Slow-Release Fertilizers (SRF) | Coated with materials such as sulfur, neem, etc., to ensure nutrient availability to the crop for a longer period. |
| Foliar Fertilizers | Consist of both liquid and water soluble fertilizers applied through foliar application. |
| Water-Soluble Fertilizers | Available in various forms including liquid, powder, etc., used in foliar and fertigation mode of fertilizer application. |
| Fertigation | Fertilizers applied through different irrigation systems such as drip irrigation, micro irrigation, sprinkler irrigation, etc. |
| Anhydrous Ammonia | Used as fertilizer, directly injected into the soil, available in gaseous liquid form. |
| Single Super Phosphate (SSP) | Phosphorus fertilizer containing only phosphorus which has lesser than or equal to 35%. |
| Triple Super Phosphate (TSP) | Phosphorus fertilizer containing only phosphorus greater than 35%. |
| Enhanced Efficiency Fertilizers | Fertilizers coated or treated with additional layers of various ingredients to make it more efficient compared to other fertilizers. |
| Conventional Fertilizer | Fertilizers applied to crops through traditional methods including broadcasting, row placement, ploughing soil placement, etc. |
| Chelated Micronutrients | Micronutrient fertilizers coated with chelating agents such as EDTA, EDDHA, DTPA, HEDTA, etc. |
| Liquid Fertilizers | Available in liquid form, majorly used for application of fertilizers to crops through foliar and fertigation. |
Research Methodology
Mordor Intelligence follows a four-step methodology in all our reports.
- Step-1: IDENTIFY KEY VARIABLES: In order to build a robust forecasting methodology, the variables and factors identified in Step-1 are tested against available historical market numbers. Through an iterative process, the variables required for market forecast are set and the model is built on the basis of these variables.
- Step-2: Build a Market Model: Market-size estimations for the forecast years are in nominal terms. Inflation is not a part of the pricing, and the average selling price (ASP) is kept constant throughout the forecast period for each country.
- Step-3: Validate and Finalize: In this important step, all market numbers, variables and analyst calls are validated through an extensive network of primary research experts from the market studied. The respondents are selected across levels and functions to generate a holistic picture of the market studied.
- Step-4: Research Outputs: Syndicated Reports, Custom Consulting Assignments, Databases & Subscription Platforms


