
Market Overview
| Study Period | 2020 - 2031 |
|---|---|
| Forecast Data Period | 2026 - 2031 |
| Base Year Market Size (2025) | USD 541.88 Million |
| Market Size (2026) | USD 575.26 Million |
| Market Size (2031) | USD 775.03 Million |
| Growth Rate (2026 - 2031) | 6.16 % |
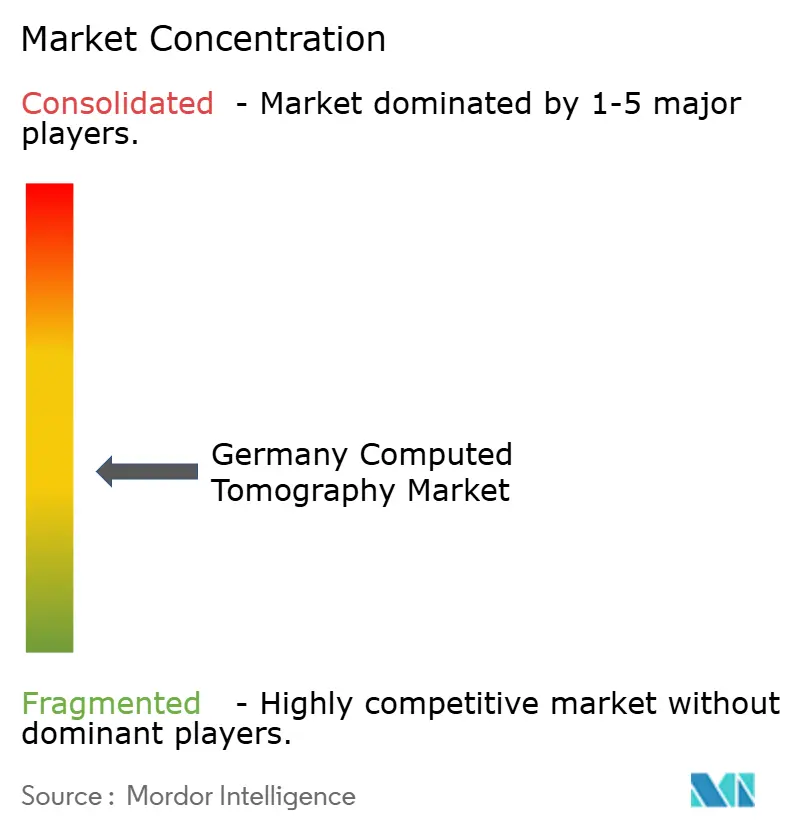
| Market Concentration | Medium |
Major Players *Disclaimer: Major Players sorted in no particular order Image © Mordor Intelligence. Reuse requires attribution under CC BY 4.0. | |
Germany Computed Tomography Market Analysis by Mordor Intelligence
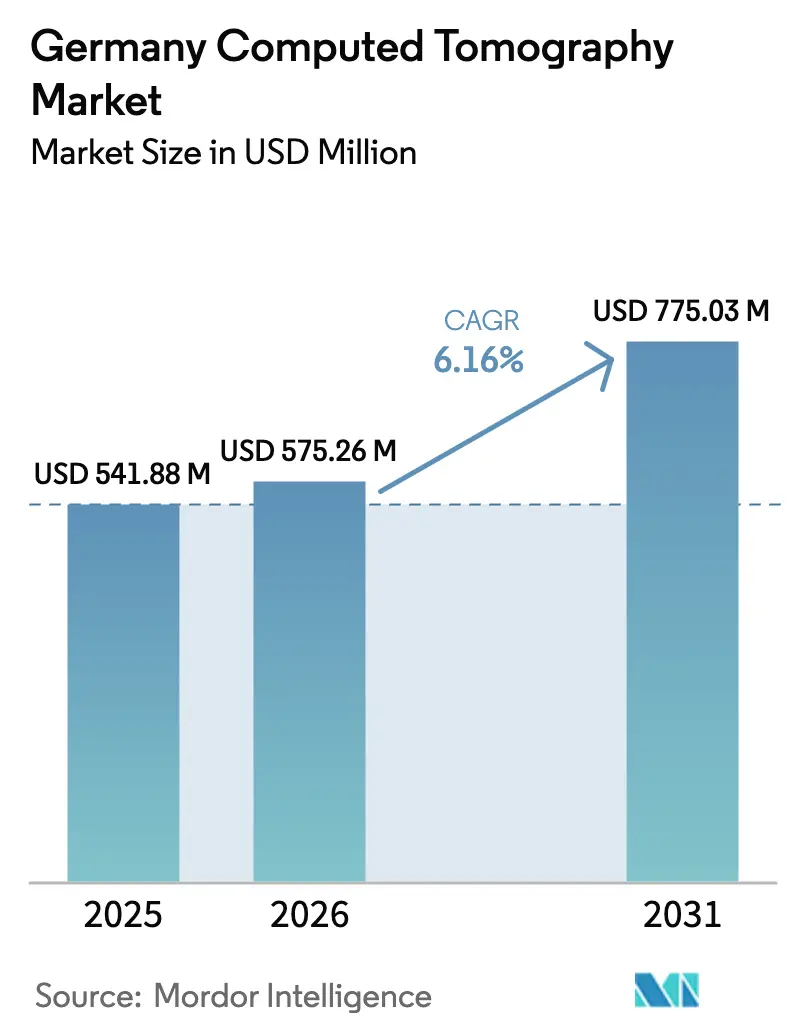
The Germany computed tomography market size is expected to grow from USD 541.88 million in 2025 to USD 575.26 million in 2026 and is forecast to reach USD 775.03 million by 2031 at 6.16% CAGR over 2026-2031. Growth stems from the country’s universal insurance coverage, a dense network of more than 1,900 hospitals, and rising demand for non-invasive diagnostics as the share of citizens aged 65 and above approaches 23% by 2030. Rapid product innovation—most notably photon-counting detectors and AI-enhanced reconstruction—reduces radiation dose by up to 45% while improving throughput, which appeals to hospitals grappling with staff shortages. Reimbursement reform in 2025 introduced GOP 34370 and 34371 for cardiac CT angiography, accelerating adoption in outpatient cardiology and radiology practices. Mobile CT programs such as Berlin’s STEMO ambulances cut stroke treatment times by 25 minutes, illustrating how point-of-care imaging reshapes acute neurology workflows. Regulatory rigor under the Medical Device Regulation (MDR) ensures patient safety but lengthens approval timelines, compelling vendors to invest early in clinical evidence generation.
Key Report Takeaways
- By product type, High Slice systems led with 35.88% of Germany computed tomography market share in 2025, while Medium Slice systems are projected to expand at a 6.71% CAGR through 2031.
- By application, oncology accounted for a 31.78% share of the Germany computed tomography market size in 2025, whereas neurology is forecast to grow fastest at a 6.62% CAGR to 2031.
- By mobility, fixed scanners commanded 65.25% of the Germany computed tomography market size in 2025; mobile systems post the highest 6.90% CAGR between 2026-2031.
- By end user, hospitals generated 48.22% of revenue in 2025, while diagnostic imaging centers record the quickest expansion at a 6.78% CAGR through 2031.
Note: Market size and forecast figures in this report are generated using Mordor Intelligence’s proprietary estimation framework, updated with the latest available data and insights as of 2026.
Germany Computed Tomography Market Trends and Insights
Drivers Impact Analysis*
| Driver | (~) % Impact on CAGR Forecast | Geographic Relevance | Impact Timeline |
|---|---|---|---|
| Chronic-disease burden & ageing population | +1.8% | National, higher intensity in rural and eastern states | Long term (≥ 4 years) |
| Continuous detector, AI & photon-counting breakthroughs | +1.2% | National, early adoption at university hospitals | Medium term (2-4 years) |
| Reimbursement of cardiac CT angiography from 2025 | +0.9% | National, immediate effect in outpatient settings | Short term (≤ 2 years) |
| Growth of low-dose lung-cancer screening programs | +0.7% | National, pilot activity in high-risk regions | Medium term (2-4 years) |
| Outpatient imaging platform roll-ups | +0.5% | Berlin, Munich, Hamburg | Short term (≤ 2 years) |
| Rural teleradiology demand | +0.4% | Brandenburg, Saxony, Saxony-Anhalt | Long term (≥ 4 years) |
| Source: Mordor Intelligence | |||
Chronic-Disease Burden & Ageing Population
Germany computed tomography market volumes climb steadily as 15.3 million residents live with cardiovascular disease and annual cancer incidence reaches 500,000 cases [1]. Each oncology patient undergoes an average of 4-6 scans during therapy, forming a predictable revenue stream for imaging providers. The demographic shift is more pronounced in sparsely populated eastern states where hospital consolidation raises concern over access. To maintain throughput amid staffing gaps, providers invest in automation tools that shorten exam times and standardize image quality. Hospitals use these efficiency gains to accommodate a growing share of chronic-care follow-ups without lengthening wait lists.
Continuous Detector, AI & Photon-Counting Breakthroughs
Photon-counting CT delivers sub-0.2 mm spatial resolution and 45% lower dose relative to conventional detectors [2]. University Hospital Augsburg has already completed more than 8,000 clinical cases, validating spectral imaging benefits in complex cardiovascular and orthopedic evaluations. AI-based reconstruction drives a further 50-80% dose reduction while tripling daily scan capacity, helping radiology departments mitigate workforce shortages. As Germany computed tomography market participants bundle detectors, AI and workflow software, competitive focus shifts from hardware alone to integrated platforms that optimize room utilization.
Reimbursement of Cardiac CT Angiography from 2025
Statutory insurance now reimburses coronary CT angiography under GOP 34370, reducing economic barriers for non-invasive assessment of suspected coronary artery disease. Evidence shows the procedure costs EUR 98.60 against EUR 317.75 for invasive angiography, promising significant savings for payers. Early forecasts suggest 30-40% of diagnostic coronary angiographies could migrate to CT by 2030, infusing new momentum into the Germany computed tomography market. Outpatient cardiology practices plan equipment upgrades, while radiology societies publish training guidelines to preserve image quality and patient safety in rapidly expanding cardiac programs.
Growth of Low-Dose Lung-Cancer Screening Programs
Pilot studies evaluate national deployment of low-dose CT screening to curb lung-cancer mortality, which claimed 56,690 new cases in 2024. International clinical trials confirmed a 20% mortality drop among high-risk smokers, prompting German policymakers to outline eligibility criteria and funding models. Domestic research groups apply AI algorithms to filter noise and detect sub-centimeter nodules at radiation levels comparable to annual background exposure, addressing scepticism over cumulative dose [3]. Scaling the program will require additional systems in regions with elevated smoking prevalence, buoying equipment sales over the medium term.
Restraints Impact Analysis*
| Restraint | (~) % Impact on CAGR Forecast | Geographic Relevance | Impact Timeline |
|---|---|---|---|
| High scanner CAPEX & OPEX | -1.1% | Nationwide, acute at small community hospitals | Long term (≥ 4 years) |
| Stringent BfArM / CE-MDR approval timelines | -0.8% | Nationwide | Medium term (2-4 years) |
| Radiographer & radiologist workforce shortages | -0.7% | Nationwide, more pressing in rural facilities | Long term (≥ 4 years) |
| Oversupply in metro areas compressing scan prices | -0.4% | Berlin, Munich, Hamburg | Short term (≤ 2 years) |
| Source: Mordor Intelligence | |||
High Scanner CAPEX & OPEX
A state-of-the-art 128-slice CT costs up to USD 3 million, and annual service contracts add 8-12% of purchase value. Under Germany’s diagnosis related group (DRG) financing, hospitals face fixed reimbursements that rarely cover high-end equipment lifecycle costs. Providers need a minimum of 1,065 scans per year to reach breakeven for a dedicated radiology unit, pushing smaller facilities toward teleradiology partnerships. Capital constraints slow uptake of photon-counting systems despite their clinical upside, reinforcing the preference for mid-range platforms that balance capability and cost.
Stringent BfArM / CE-MDR Approval Timelines
Class IIb and III CT devices must complete exhaustive conformity assessments, extending market entry by 12-18 months and inflating regulatory expenses. Post-market clinical follow-up and vigilance reporting add administrative burden, especially for smaller vendors. While the framework raises safety standards, it lowers agility, delaying the commercial impact of technological breakthroughs. Manufacturers pre-fund extensive clinical trials to secure early evidence, raising barriers for new entrants and tightening competition within the Germany computed tomography market.
*Our forecasts treat driver/restraint impacts as directional, not additive. The impact forecasts reflect baseline growth, mix effects, and variable interactions.
Segment Analysis
By Product Type: Medium Slice Systems Drive Growth
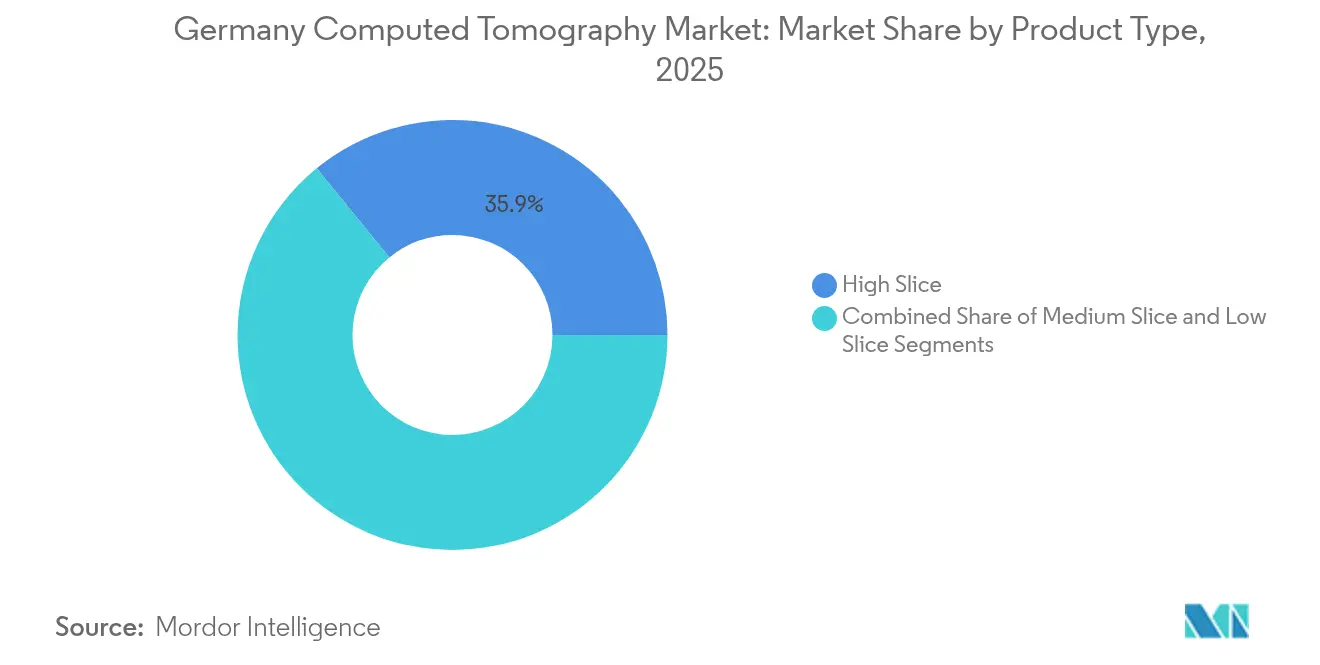
Medium Slice platforms capture buyers seeking advanced functionality at sustainable prices, and this category is forecast to grow at a 6.71% CAGR, outpacing the overall Germany computed tomography market. High Slice units retained a 35.88% Germany computed tomography market share in 2025 on the strength of premium cardiac and oncology applications. University hospitals prefer ≥256-slice or photon-counting scanners for ultra-high-resolution cases, whereas regional clinics migrate to 64-slice systems that cover most diagnostic pathways without exceeding budget ceilings.
Rapid detector improvements enable Medium Slice devices to deliver near-isotropic imaging and spectral post-processing once reserved for flagship models. This democratization aligns with procurement policies emphasizing value-based care. The Germany computed tomography market size for Medium Slice systems is projected to advanced steadily as outpatient imaging chains refurbish ageing fleets to meet cardiac CT reimbursement demand. Conversely, Low Slice scanners remain niche, serving emergency backups and small trauma centers where acquisition cost trumps advanced features.

By Application: Neurology Segment Accelerates
Neurology is projected to register a 6.62% CAGR, the fastest within the Germany computed tomography market, driven by nationwide stroke pathways and expanding endovascular therapy capacity. Berlin’s STEMO ambulances demonstrate how on-board CT raises thrombolysis rates above 30%, underscoring clinical and economic payoffs of pre-hospital imaging. Oncology preserved the largest 31.78% slice of Germany computed tomography market size in 2025 as comprehensive cancer centers rely on serial CT for staging, treatment planning and surveillance.
Cardiovascular imaging will benefit most directly from the 2025 reimbursement change. As payers encourage non-invasive coronary pathways, mid-tier hospitals invest in dual-source systems that deliver one-beat cardiac studies. Musculoskeletal and trauma indications remain steady, sustained by high road-traffic and workplace injury volumes. AI decision-support tools shorten neurological scan interpretation times, freeing radiologists to handle surging demand without sacrificing diagnostic accuracy.
By Mobility: Mobile Systems Transform Care Delivery
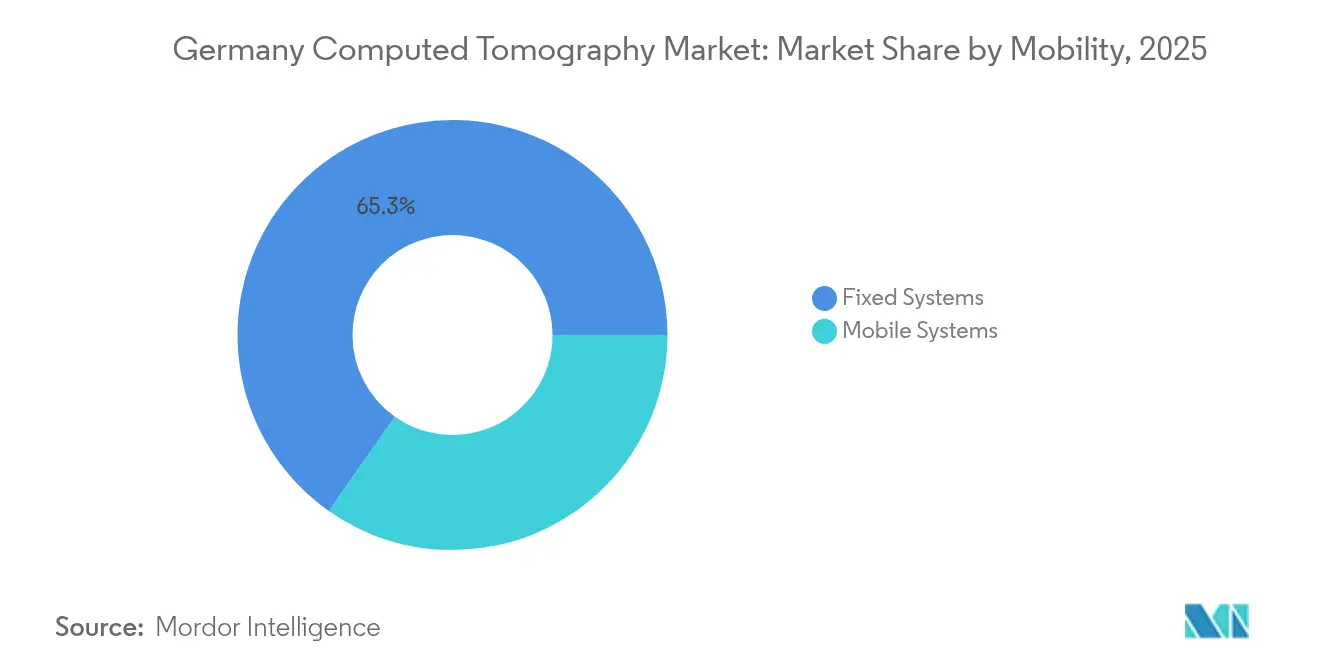
Fixed systems accounted for 65.25% of Germany computed tomography market size in 2025, yet mobile platforms are expected to post the highest 6.90% CAGR through 2031. Critical care teams deploy head-only systems beside ICU beds to reduce intra-hospital transfers that risk ventilator disconnections. Devices such as SOMATOM On.site deliver diagnostic-grade images in 20 minutes and integrate seamlessly with hospital PACS networks. Rural hospitals use trailer-mounted scanners on rotation schedules to guarantee weekly access without full-time staffing, a model supported by federal telemedicine grants.
Continuous software updates improve image quality and radiation dose on mobile units, reinforcing their suitability for stroke, trauma and pediatrics. As workforce constraints intensify, health systems treat mobile CT as a multiplier that spreads specialist capacity across multiple sites, sustaining the Germany computed tomography market momentum in underserved regions.
By End User: Diagnostic Centers Lead Expansion
Hospitals commanded 48.22% of 2025 revenue due to comprehensive inpatient and emergency case-mix needs. However, diagnostic centers are projected to expand fastest at a 6.78% CAGR as private equity consolidates small practices into scalable outpatient platforms. These groups negotiate equipment volume discounts and standardize AI-enabled workflows that lift daily scan counts above hospital averages.
Legislation governing Medical Treatment Centers (MVZ) clarifies licensing, spurring new builds near large employers for convenient screening services. Public insurers increasingly steer non-acute referrals to outpatient providers to contain costs, reinforcing volume migration. In response, hospital managers position themselves as tertiary centers for complex cardiology, oncology and trauma, focusing capital budgets on premium High Slice or photon-counting technology that secures referral loyalty within the Germany computed tomography market.
Geography Analysis
Market demand clusters in Bavaria, Baden-Württemberg and North Rhine-Westphalia, where dense populations and robust economies support early adoption of photon-counting and AI-augmented scanners. Bavaria’s hospital plan prioritizes replacement of ageing systems with dual-energy or spectral models, sustaining supplier order pipelines. Berlin and Hamburg deploy mobile stroke units featuring CT to reduce door-to-needle times, expanding neurology volumes outside traditional emergency departments.
Eastern states such as Brandenburg and Saxony modernize infrastructure funded by federal-state programs that target legacy equipment dating from the 1990s upgrade wave. These facilities often adopt Medium Slice systems paired with teleradiology contracts to offset limited on-site radiologist availability. Teleradiology networks link more than 30 sites, demonstrating how cloud-based reporting expands specialist reach and stabilizes scan demand in low-density regions.
Oversupply pressures appear in urban corridors where scan prices trend downward as new outpatient chains enter the Germany computed tomography market. Providers counter by differentiating through dose reduction protocols and subspecialty services such as cardiac CT or spectral oncology imaging. National reimbursement uniformity ensures consistent revenue per scan, yet operational efficiency dictates profitability, reinforcing regional competition based on workflow productivity rather than pricing variance.
Regulatory Landscape
Germany applies the EU Medical Device Regulation (MDR) and the national Medizinproduktegesetz (MPDG) for CT devices. The Federal Institute for Drugs and Medical Devices (BfArM) is the competent federal authority for medical devices in Germany, and clinical investigation applications must be filed through the Medical Devices Information and Database System (DMIDS). A favorable ethics-committee opinion, along with BfArM authorization, is required before a study can start, which affects launch sequencing and site strategy for advanced CT features such as photon-counting detectors and AI-enabled reconstruction.
For higher-risk CT devices (Class IIb and III), conformity assessments can extend market-entry cycles, and post-market surveillance obligations add to compliance workload. As a result, vendors tend to front-load local clinical data generation and align their governance approach when introducing photon-counting and AI-enabled workflows.
Competitive Landscape
The Germany computed tomography market is moderately fragemented, with Siemens Healthineers, GE HealthCare, Philips and Canon Medical Systems controlling the majority of installed units. Siemens leverages its Forchheim production hub and first-to-market photon-counting portfolio to preserve domestic leadership. GE HealthCare focuses on AI-driven cardiac workflows, exemplified by the Revolution Vibe launch that targets new CCTA reimbursement. Philips emphasizes iterative reconstruction and dose management in its CT 5300, appealing to providers seeking radiation stewardship. Canon differentiates through detector coverage combined with aquilion spectral imaging that reduces contrast dose for renal-compromised patients.
Strategic activity centers on partnerships that embed AI algorithms into scanners at the point of acquisition. NEXUS/CHILI’s alliance with deepc distributes an FDA-cleared algorithm marketplace to more than 500 German hospitals, simplifying integration and support. Vendors also invest in service contracts offering uptime guarantees that alleviate staffing shortages for in-house biomedical engineers. Patent filings exceed 500 for photon-counting detector innovations, indicating sustained R&D despite regulatory headwinds.
Providers explore mobile CT fleet leasing and usage-based pricing that lower capital barriers, an emerging business model that could reshape competitive dynamics. Domestic startups develop thin-slice reconstruction software that interfaces with legacy hardware, allowing older units to meet modern image-quality expectations and extending system lifespan.
Germany Computed Tomography Industry Leaders
-
GE Healthcare
-
Koninklijke Philips NV
-
Canon Medical Systems Corporation
-
Siemens Healthineers AG
-
Fujifilm Holdings Corp.
- *Disclaimer: Major Players sorted in no particular order
Market Opportunities and Future Outlook
The 2025 reimbursement reform added GOP 34370 and 34371 for coronary CT angiography, reducing economic barriers for statutory-insured patients and speeding up non-invasive diagnostic pathways in outpatient settings. Berlin STEMO stroke ambulances also illustrate how point-of-care imaging and workflow changes can reshape acute neurology delivery. Separately, BVMed data indicates the German medtech sector has over 300 member organizations, more than 210,000 employees, and about EUR 55 billion in revenue, with exports representing a substantial share of sales.
Technology-led differentiation is extending replacement and upgrade demand beyond university hospitals, supported by Siemens Healthineers' German R&D and production footprint and its ongoing focus on dose stewardship and spectral capability. Together, the evidence set out by BVMed and domestic manufacturers points to an installed base where AI-enabled, detector-based platforms and multi-site imaging networks can improve throughput and standardization across Germany's imaging chains.
Recent Industry Developments
- May 2026: Philips introduced the Rembra CT system at the 107th German Roentgen Congress in Leipzig. The launch expands acute-care and high-throughput CT deployment in Germany. The capacity addition strengthens Philips’ footprint in the German market with AI-enabled, rapid-imaging capabilities.
- March 2026: Philips European premiere of Verida CT with detector-based spectral imaging and AI integration at ECR. The event highlights European market adoption of spectral CT with AI. It enhances product differentiation and AI-enabled workflows in Germany.
- March 2026: GE HealthCare received FDA 510(k) clearance for Photonova Spectra photon-counting CT system. The clearance enables clinical entry of photon-counting CT. It supports expansion of the photon-counting technology portfolio in Germany through an FDA-cleared system.
Research Methodology Framework and Report Scope
Market Definition and Coverage
For this report, we define the Germany computed tomography market as the revenues earned from CT systems and related sales in Germany for clinical diagnosis and care, captured at the manufacturer selling level and counted in USD.
Scope exclusions: We exclude used equipment resale, most stand-alone service contracts, and software-only tools that are not bundled or directly tied to CT system sales.
Segmentation Overview
- By Product Type
- Low Slice
- Medium Slice
- High Slice
- By Application
- Oncology
- Neurology
- Cardiovascular
- Musculoskeletal
- Other Applications
- By Mobility
- Fixed Systems
- Mobile Systems
- By End User
- Hospitals
- Diagnostic Imaging Centers
- Others
Data Sources, Market Sizing, and Validation
Desk Research
Desk research set the boundary and gave us the clean starting numbers needed to model demand, replacement needs, and pricing direction. We reviewed public healthcare and population signals in Germany, and then mapped them to imaging demand and installation behavior over time.
Sources used included, for example, Federal Statistical Office of Germany (Destatis) for population and hospital metrics, OECD Health Statistics for imaging context, European Commission and EU MDR documentation for regulatory timelines, German radiology and hospital association publications where available, and peer reviewed journals covering CT utilization, dose, and clinical workflow. We also checked company filings, investor presentations, and reputable press for product cycle cues, and used a paid subscription for company financials and news screening plus patent databases to understand innovation pace. These examples are not exhaustive, and many other public documents were also used for data collection, validation, and clarification.
Primary Interviews and Surveys
Primary work focused on confirming how CT demand is actually formed in Germany across hospitals, outpatient imaging, and procurement groups, and then pressure testing pricing and replacement assumptions. We spoke with a mix of clinical users, imaging administrators, procurement teams, and channel-side experts so gaps from desk research could be closed and the final totals could be cross-checked.
Distribution of primary research fieldwork respondents
| Company type | Respondent position |
|---|---|
| Top tier: 37% | CXOs: 12% |
| Mid tier: 47% | Functional/Unit leaders: 31% |
| Smaller Players: 16% | Managers: 57% |
Market-Sizing & Forecasting
Sizing started with a top-down build that reconstructs Germany demand from the active installed base, expected replacement cycle, and annual procurement flow, which is then converted into value using an ASP ladder by slice class. We then corroborated the total with selective bottom-up checks, such as supplier mix logic, channel feedback on tender flow, and sampled ASP x unit assumptions by key end-user settings.
Key inputs (illustrative) included the number and type of imaging sites buying CT, the pace of replacement versus new installations, slice mix shifts toward higher performance systems, mobile CT uptake for acute and overflow use, and the observed direction of ASP changes tied to detector and reconstruction upgrades. Where direct unit counts were not clean, gaps were handled through proxy signals like procurement cadence and replacement timing shared by interviewees, followed by sensitivity tests on the unit and price ranges.
For forecasting, we relied on scenario analysis supported by expert views on hospital capital budgets, outpatient utilization growth, and technology refresh triggers. The output was kept consistent with practical constraints such as regulatory timelines, staffing pressure in radiology, and the realistic speed of adoption for newer detector architectures.
Data Validation & Update Cycle
Validation was done through repeated cross-checks rather than a single pass. Model outputs were compared against independent signals like typical replacement behavior, procurement timing, and how mix shifts affect realized ASP, and then any unusual jumps were reviewed before sign-off.
We also re-contact experts when assumptions moved outside expected ranges, or when new product or reimbursement changes could shift demand in a short time. Reports refresh annually, with interim updates for material events, and right before delivery an analyst runs a fresh review so clients receive the latest updated view.
Mordor Intelligence's Germany Computed Tomography Market Size Compared With Other Published Estimates
It is normal to see different market values for the same CT topic because studies do not always count the same revenue lines, the same buyer channels, or the same timing for currency and price updates. Differences also show up when one model leans heavily on installed-base replacement logic, and another assumes a faster expansion in new placements.
Installed base replacement signals, slice-mix shifts, and tender cadence checks are the evidence that keeps Mordor Intelligence tied to equipment revenues in Germany (instead of loosely mixing in broader diagnostic imaging or service-heavy totals). In practice, the biggest gaps usually come from whether mobile systems are counted consistently, whether software and multi-year service are included as full value, and how ASP progression is handled during technology transitions.
Benchmark comparison
| Source | Market Size | Gaps in Research Methodology |
|---|---|---|
| Mordor Intelligence | USD 541.88 M (2025) | |
| Industry Data Outlet A | USD 510.00 M (2022) | Uses an older base year and tends to hold ASPs flatter, which can understate value when slice mix upgrades accelerate and premium system adoption rises. |
| Regional Consultancy B | USD 610.00 M (2025) | Often broadens scope to include a larger share of service and software value and may assume faster replacement cycles, which pushes totals above an equipment-focused boundary. |
The spread in published numbers is mainly explained by base-year timing, what is counted as CT revenue, and how pricing and replacement are refreshed. By keeping the model anchored to observable purchase cycles and a clear ASP-by-class structure, the estimate stays traceable to inputs that can be checked and repeated.
Key Questions Answered in the Report
What is the current value of the Germany computed tomography market?
The market is valued at USD 575.26 million in 2026 and is set to reach USD 775.03 million by 2031.
Which application segment contributes the largest revenue?
Oncology holds the leading 31.78% share owing to Germany’s extensive cancer screening and treatment infrastructure.
Why are Medium Slice CT systems growing faster than other product types?
They balance advanced imaging capability with lower acquisition cost, matching budget priorities of community hospitals and outpatient centers.
How will reimbursement changes affect cardiac imaging volumes?
New GOP codes introduced in 2025 enable full statutory insurance coverage for coronary CT angiography, potentially shifting up to 40% of diagnostic coronary cases from invasive to non-invasive CT.
What is driving interest in mobile CT scanners?
Mobile units reduce patient transport risks, support stroke ambulances and ICU imaging, and address staff shortages by bringing the scanner to the bedside.
How stringent are regulatory requirements for new CT technology in Germany?
Class IIb and III CT devices must undergo lengthy conformity assessments under the MDR, extending market entry by up to 18 months and increasing compliance costs for manufacturers.