
Global Gene Delivery Systems Market Size and Share
Market Overview
| Study Period | 2020 - 2031 |
|---|---|
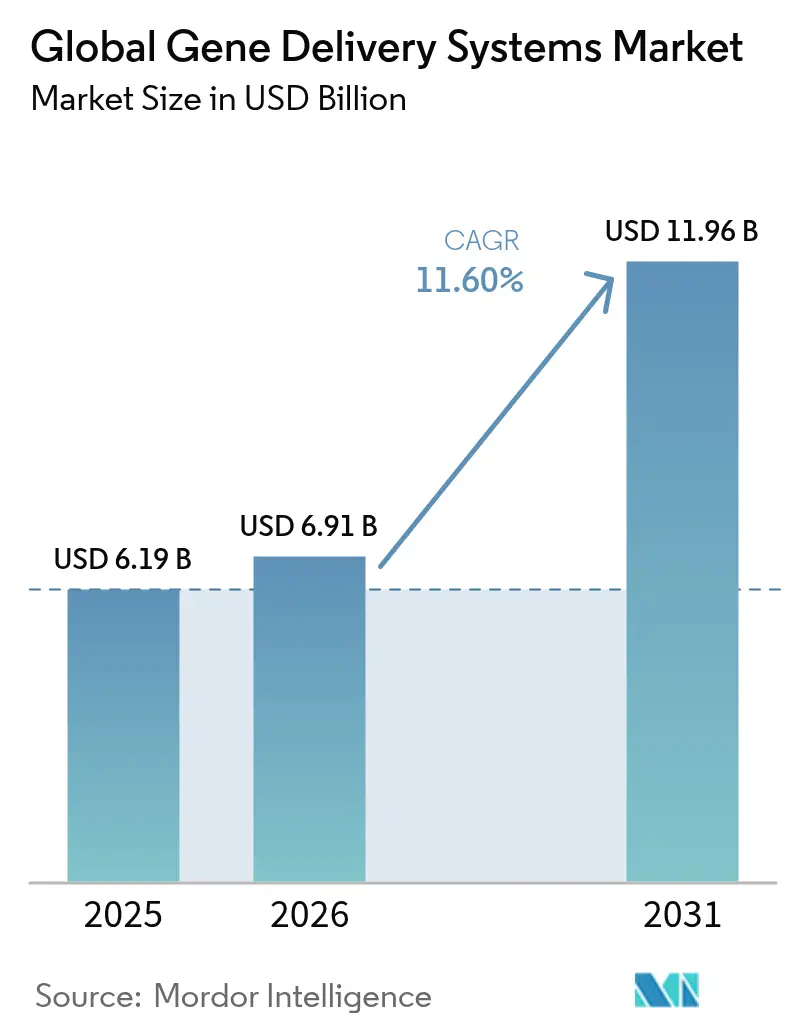
| Market Size (2026) | USD 6.91 Billion |
| Market Size (2031) | USD 11.96 Billion |
| Growth Rate (2026 - 2031) | 11.60 % |
| Fastest Growing Market | Asia Pacific |
| Largest Market | North America |
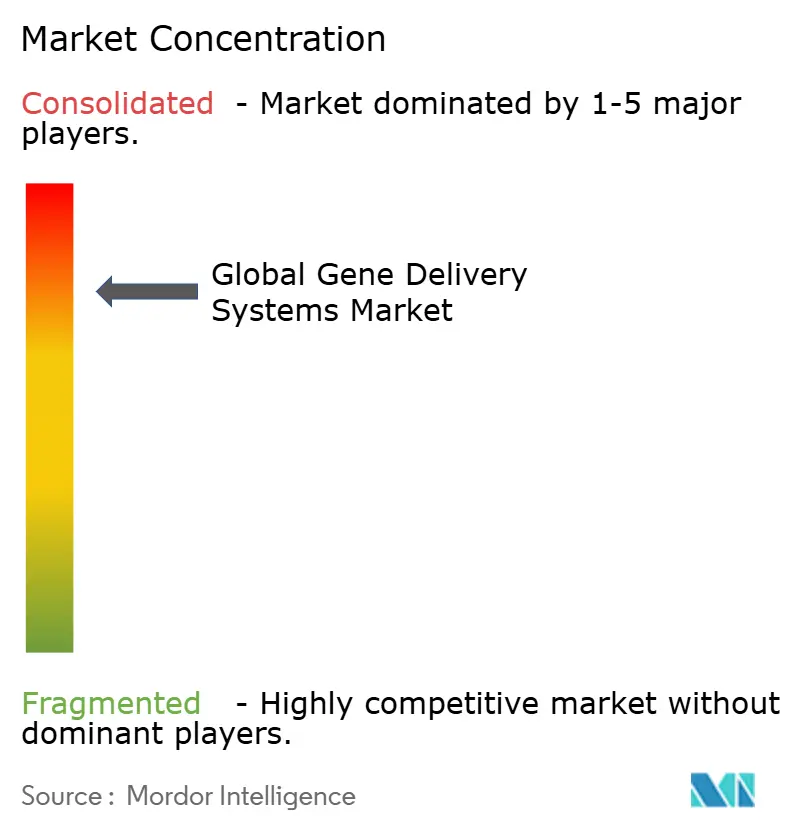
| Market Concentration | High |
Major Players *Disclaimer: Major Players sorted in no particular order Image © Mordor Intelligence. Reuse requires attribution under CC BY 4.0. | |
Global Gene Delivery Systems Market Analysis by Mordor Intelligence
The gene delivery systems market size is expected to grow from USD 6.19 billion in 2025 to USD 6.91 billion in 2026 and is forecast to reach USD 11.96 billion by 2031 at 11.60% CAGR over 2026-2031. Momentum stems from the U.S. Food and Drug Administration’s clearances of transformative therapies such as CASGEVY and LYFGENIA for sickle cell disease, alongside large-scale capacity investments that reduce production bottlenecks. Demand is reinforced by oncology’s rapid adoption of viral vectors, infectious-disease programs leveraging novel lipid nanoparticles, and AI-enabled vector optimization that speeds candidate selection. Meanwhile, growing CDMO partnerships mitigate the 500% shortfall in commercial-scale plasmid and viral vector capacity, allowing developers to meet clinical timelines. Heightened venture funding, government incentives, and collaborative R&D hubs further enlarge the opportunity pool.
Key Report Takeaways
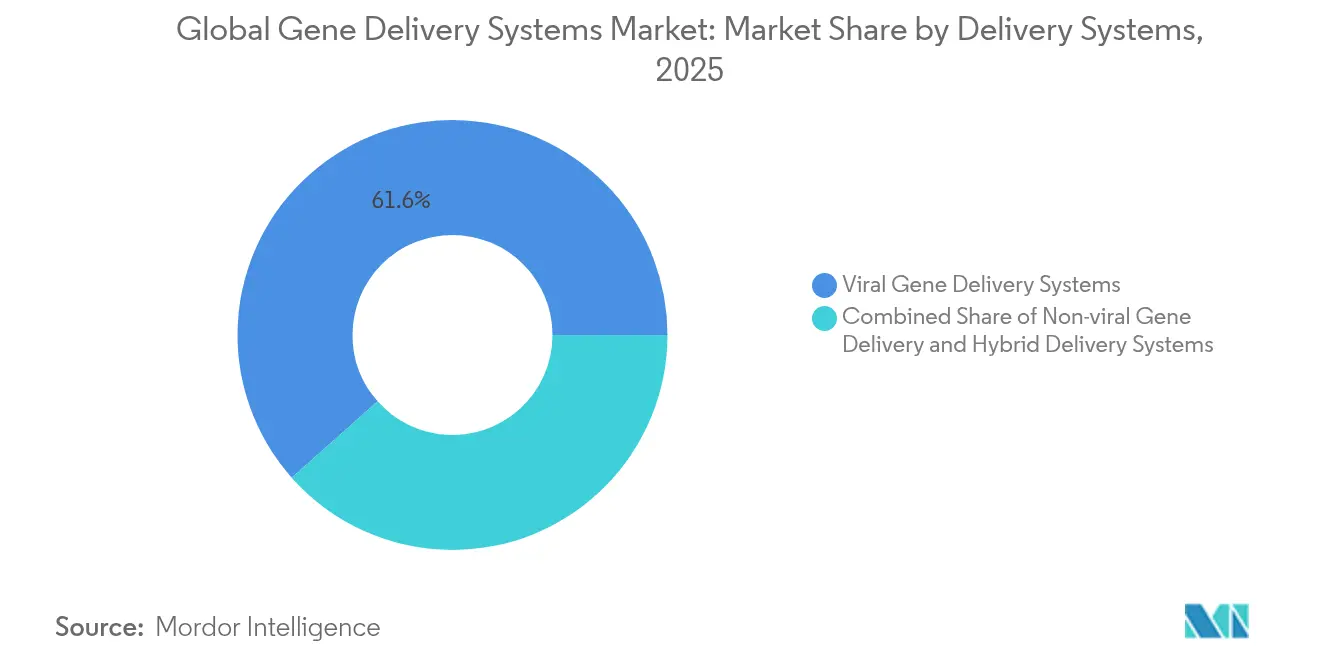
- By delivery system, viral vectors held 61.55% of 2025 gene delivery systems market share, whereas non-viral platforms registered the highest growth at a 12.98% CAGR to 2031.
- By application, oncology commanded 47.62% revenue share in 2025; infectious diseases are projected to advance at a 12.42% CAGR through 2031.
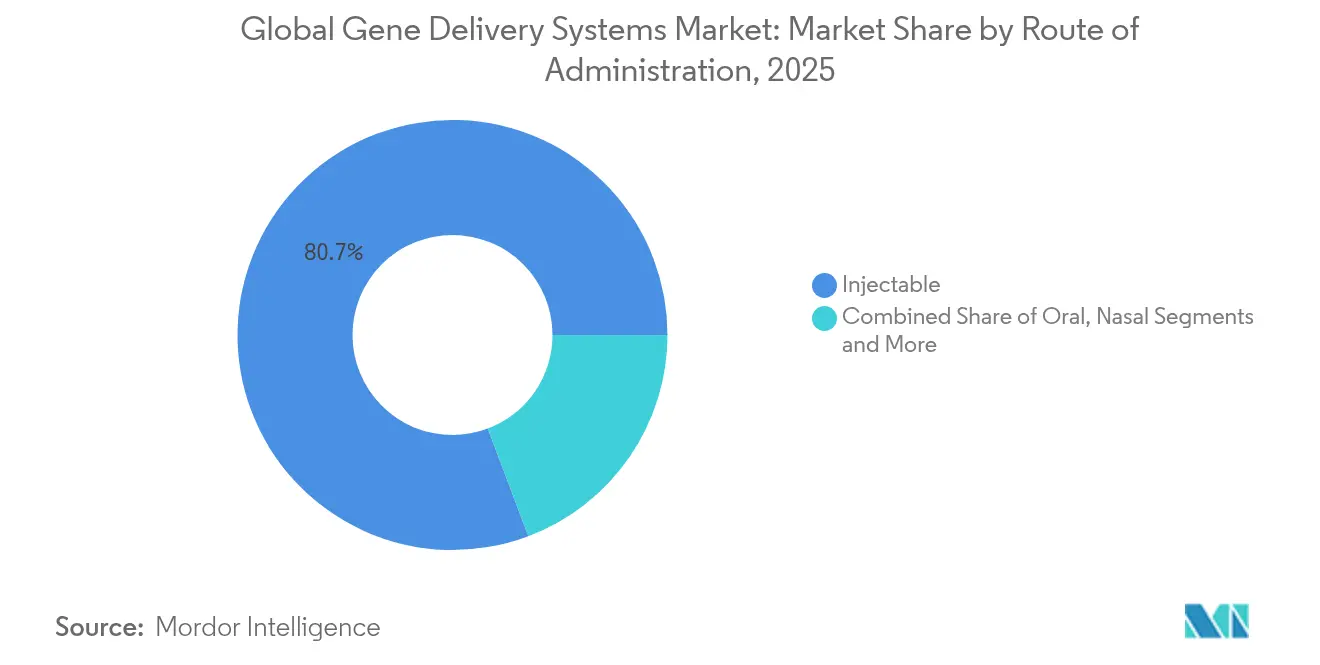
- By route of administration, injectable formats accounted for 80.74% of the gene delivery systems market size in 2025, while nasal delivery is set to grow at a 12.77% CAGR over the forecast period.
- By end user, biopharma and gene-therapy developers controlled 44.93% revenue share in 2025, with contract manufacturing & CDMOs recording the fastest expansion at 13.29% CAGR.
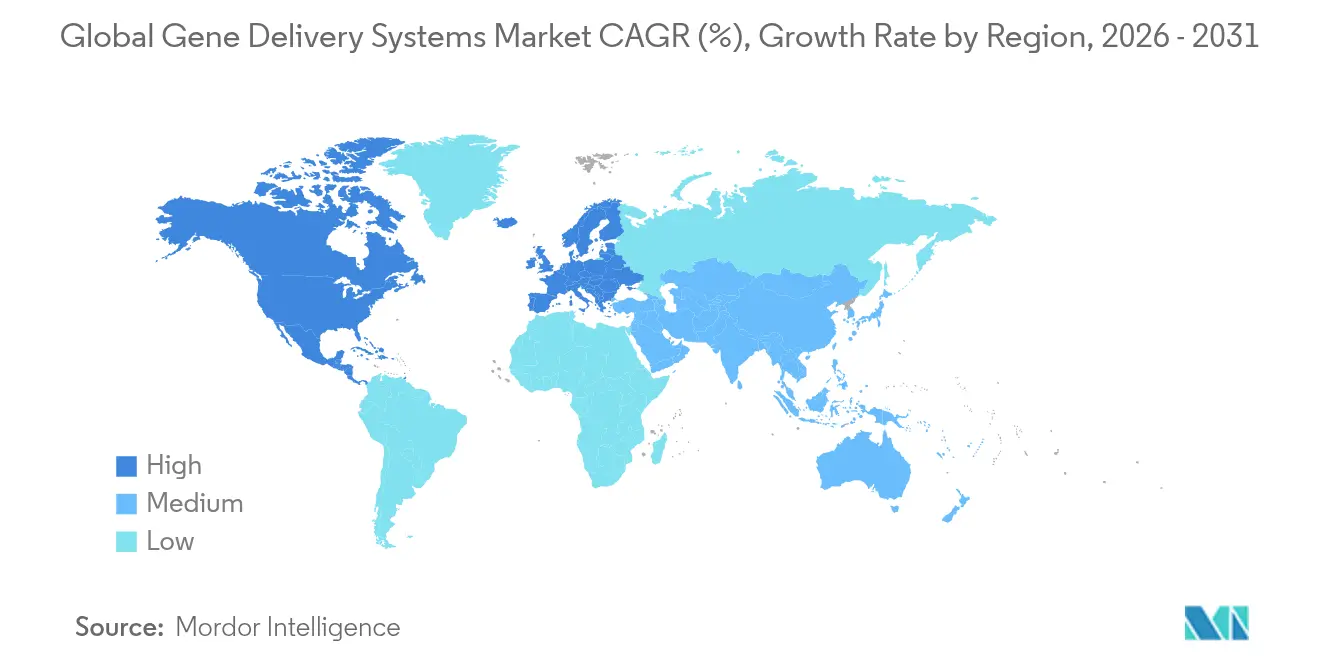
- By geography, North America led with 43.21% market share in 2025; Asia-Pacific is on track for the quickest rise at a 13.46% CAGR through 2031.
Note: Market size and forecast figures in this report are generated using Mordor Intelligence’s proprietary estimation framework, updated with the latest available data and insights as of 2026.
Market Trends and Insights
Drivers Impact Analysis of Global Gene Delivery Systems Market*
| Driver | (~) % Impact on CAGR Forecast | Geographic Relevance | Impact Timeline |
|---|---|---|---|
| Growing burden of chronic & lifestyle diseases | +2.8% | Global, strongest in North America & Europe | Long term (≥ 4 years) |
| Rapid R&D advances by biopharma companies | +2.5% | North America, Europe, emerging Asia-Pacific hubs | Medium term (2-4 years) |
| Rising approvals of vector-based therapies | +2.2% | North America & EU leadership, Asia-Pacific following | Short term (≤ 2 years) |
| Venture and strategic funding inflows | +1.8% | Global biotech clusters | Medium term (2-4 years) |
| AI-driven vector design tools | +1.5% | Innovation centers in North America & Europe | Long term (≥ 4 years) |
| Regional CDMO build-out of plasmid capacity | +1.0% | Asia-Pacific expansion; North America & Europe modernization | Medium term (2-4 years) |
| Source: Mordor Intelligence | |||
Growing Burden of Chronic & Lifestyle Diseases
Rising prevalence of genetic and chronic disorders fuels demand for curative gene therapies that replace lifelong symptom management with one-time molecular correction. Sickle cell disease affects 100,000 Americans, and hemophilia B impacts 1 in 40,000 males worldwide, motivating developers to pursue durable treatments. CASGEVY’s pivotal trial showed 96.7% of recipients free of vaso-occlusive crises for at least one year, validating the clinical and economic rationale for broader deployment. Success in hematologic indications accelerates exploration in cardiovascular, metabolic, and neurodegenerative diseases where conventional pharmacology offers limited long-term benefit.
Rapid R&D Advances by Biopharma Companies
Large pharmaceutical groups intensify gene-therapy pipelines through acquisitions and partnerships exceeding USD 1 billion each, such as Roche–Poseida and Novartis expansions in nervous-system disorders. AI-guided design shortens vector optimization cycles, enabling Regeneron, AstraZeneca, and CRISPR Therapeutics to progress multiple in-vivo programs simultaneously. This R&D velocity aligns with CDMO build-outs, ensuring production scalability for late-stage assets.
Rising Approvals of Vector-Based Gene Therapies
Regulatory momentum continues with 12 FDA-approved gene therapies as of 2024, including BEQVEZ for hemophilia B and Kebilidi for AADC deficiency. Europe’s EMA complements this trend through conditional authorizations and joint clinical assessments that harmonize evaluation across member states, accelerating multinational launches while preserving safety.
Venture and Strategic Funding Inflows
Despite macro-economic headwinds, deal activity remains robust; VectorBuilder raised USD 76 million for new GMP facilities, while Charles River Laboratories partnered with the Gates Institute on lentiviral production. Private-equity interest is evident in bluebird bio’s acquisition by Carlyle and SK Capital Partners, underscoring long-term confidence in commercial viability.
AI-Driven Vector Design Tools
Machine-learning platforms achieve 88-90% accuracy in predicting AAV capsid performance, dramatically improving selection of tissue-specific variants [1] Linus Meier, “Fit4Function Capsid Design,” nature.com . Stanford’s immune-safe zinc-finger proteins and the Broad Institute’s Fit4Function system showcase how computational approaches cut iteration cycles, potentially lowering manufacturing costs and enabling re-dosing strategies.
Regional CDMO Build-Out of Plasmid Capacity
Samsung Biologics, Fujifilm Diosynth, and GenScript collectively invest over USD 5 billion in large-scale plasmid and viral vector plants across Asia-Pacific and North America. Kaneka Eurogentec’s 1 kg GMP plasmid batch milestone and Takara Bio’s adoption of high-volume single-use bioreactors illustrate step-change throughput improvements that ease supply constraints.
Restraints Impact Analysis of Global Gene Delivery Systems Market*
| Restraint | (~) % Impact on CAGR Forecast | Geographic Relevance | Impact Timeline |
|---|---|---|---|
| High Treatment & Reimbursement Costs | -2.5% | Global, acute in emerging markets | Long term (≥ 4 years) |
| Safety / Immune-Response Concerns For Viral Vectors | -1.8% | Global regulatory oversight, clinical development | Medium term (2-4 years) |
| Complex Multi-Jurisdiction Regulatory Pathways | -1.2% | Global, particularly Europe-US-Asia coordination | Medium term (2-4 years) |
| Scarcity Of GMP-Grade Plasmid Manufacturing Slots | -0.8% | Global, concentrated in established manufacturing hubs | Short term (≤ 2 years) |
| Source: Mordor Intelligence | |||
High Treatment & Reimbursement Costs
Pricing peaks at USD 4.25 million for Lenmeldy and USD 2.2 million for CASGEVY, out-stripping payer budgets and slowing uptake despite lifetime health-economic benefits. Outcomes-based agreements and installment models offer relief but remain inconsistently adopted, creating access disparities, particularly in low- and middle-income countries.
Safety / Immune-Response Concerns for Viral Vectors
EMA’s pause of Elevidys trials after acute liver-failure events highlights ongoing immunogenicity challenges. Neutralizing antibodies limit AAV redosing and exclude patients with pre-existing immunity, pressuring developers to engineer stealth capsids and refine manufacturing controls.
*Our forecasts treat driver/restraint impacts as directional, not additive. The impact forecasts reflect baseline growth, mix effects, and variable interactions.
Global Gene Delivery Systems Market Segment Analysis
By Delivery Systems:
Viral Dominance, Non-Viral AccelerationViral platforms captured 61.55% of 2025 revenue, led by AAV vectors validated in recent approvals. Lentiviral systems grow in ex-vivo oncology and hemoglobinopathies despite production complexity. Non-viral approaches expand at 12.98% CAGR, propelled by lipid nanoparticles delivering CRISPR payloads with 90-100% encapsulation efficiency. Hybrid technologies blending viral precision with synthetic materials promise manufacturability and regulatory flexibility. Collectively, these dynamics sustain the gene delivery systems market’s transition toward diversified modalities.
Manufacturing capacity remains a pinch-point; industry surveys reveal potential lentiviral shortfalls without further scale-up. CDMOs respond with large-volume single-use bioreactors and continuous-flow purification that cut cycle times by 30%, narrowing the cost gap between viral and non-viral options.


By Application:
Oncology Leads, Infectious Diseases SurgingOncology held 47.62% of 2025 revenue, driven by CAR-T and solid-tumor gene therapies that demonstrably extend survival. Infectious-disease programs exhibit 12.42% CAGR through breakthroughs against HIV, herpes, and hepatitis B. Cardiovascular candidates advance with cBIN1 showing 30% functional improvement in large-animal models. Diabetes and pulmonary pipelines leverage inhaled and tissue-specific vectors that address longstanding delivery challenges. Orphan-disease portfolios benefit from accelerated review pathways, supporting a diverse set of rare-condition approvals.
By Route of Administration:
Injectable Standard, Nasal UpswingInjectable formats retained 80.74% share in 2025, reflecting regulatory familiarity and controlled dosing. Nasal delivery rises at 12.77% CAGR as AAV.CPP.16 and borneol-modified nanoparticles demonstrate high CNS penetration without systemic exposure . Oral, transdermal, and intra-ocular routes remain niche but evolve through protective coatings and device innovations that improve bioavailability.
By End User:
Biopharma Core, CDMOs Scaling FastBiopharma developers commanded 44.93% revenue in 2025, retaining strategic control of IP and late-stage pipelines. CDMOs are the fastest-expanding cohort at 13.29% CAGR, buoyed by alliances such as Vertex–Lonza for CASGEVY and Catalent’s exclusive FDA-approved commercial AAV line . Academic institutes spearhead early discovery partnerships, while hospitals refine point-of-care manufacturing for autologous cell-based therapies.
Geography Analysis
North America and Europe Gene Delivery Systems Market
North America led with 43.21% market share in 2025, backed by 12 FDA approvals in 2024 alone, deep venture capital pools, and cluster-based talent. Capacity additions like GenScript’s USD 224 million ProBio plant in New Jersey and Fujifilm Diosynth’s USD 1.2 billion North Carolina site underpin domestic manufacturing resilience. Europe follows with strong EMA oversight; Lonza’s Geleen facility supplies global CASGEVY demand, and 88% of approved ATMPs operate under additional monitoring, ensuring post-marketing safety.
APAC Gene Delivery Systems Market
Asia-Pacific posts the highest 13.46% CAGR to 2031 as Samsung Biologics invests USD 1.46 billion for 784,000 L of vector capacity and China’s biopharmaceutical sales could top 1.4 trillion yuan by 2029. Regulatory harmonization and local investment incentives attract multinational trials while fostering indigenous innovation.
MEA and South America Gene Delivery Systems Market
Middle East & Africa and South America remain under-penetrated yet promising as vector costs fall and technology transfers expand. Only 5 of 32 approved therapies are currently accessible in LMICs, underscoring a need for collaborative financing and localized manufacturing to broaden treatment equity.

Regulatory Landscape
Regulation of gene delivery systems is anchored in biologics and advanced-therapy pathways, with regulators emphasizing Chemistry, Manufacturing, and Controls (CMC) rigor while still allowing development-stage flexibility. In the United States, the FDA has highlighted flexible approaches for CMC expectations for human cellular and gene therapy products in 2026, including draft guidance actions and subsequent CMC-focused guidance that informs how sponsors handle comparability, process changes, and control strategy expectations as programs move toward commercialization.
In Europe, gene therapy products are regulated as advanced therapy medicinal products (ATMPs) under EMA oversight, including review and scientific recommendation activity through the Committee for Advanced Therapies (CAT), with CAT meeting work reflected in the February 2026 and April 2026 sessions. For combined products integrating a medicinal product with a delivery device, sponsors must manage both ATMP requirements and applicable medical-device obligations, such as essential requirements under EU medical device rules. This adds validation needs around biocompatibility, sterilization, and any software used in administration systems.
Value Chain Analysis
The gene delivery systems value chain runs from raw materials and critical inputs, including plasmid DNA, cell banks, lipids and polymers, enzymes, and single-use assemblies, to vector or nanoparticle production (upstream expression and downstream purification). It then covers analytical characterization and release (including potency, full-to-empty ratios for AAV, residuals, and sterility), followed by fill-finish and packaging, and finally distribution to biopharma developers, CDMOs, and clinical sites for administration. Viral vectors in particular remain sensitive to capacity availability and process yield, so upstream productivity, downstream recovery, and analytical throughput are recurring constraints for both clinical and commercial supply.
Manufacturing scale-up and platformization are becoming more common at the CDMO and technology-provider layers, where process standardization and regional capacity help reduce bottlenecks. In 2026, SK pharmteco qualified a commercial-scale viral vector facility in Corbeil-Essonnes, France (5,000 square meters), and launched the SKyvec multimodal platform spanning AAV, lenti, and adeno workflows. Lonza also introduced the Xcite AAV stable producer cell line platform to lift titers versus transient transfection, and Cirsium Biosciences opened a manufacturing site in San Diego. Together, these moves shift value toward integrated development-to-GMP execution, automation, and reproducible CMC packages that fit the comparability and quality focus regulators apply as programs progress.
Competitive Landscape
Market concentration is moderate: established pharma leaders compete with specialized biotech innovators and AI-centric start-ups. Roche’s USD 1 billion Poseida acquisition and Novartis’ nervous-system investment reflect vertical expansion into delivery science.
Dyno Therapeutics and the Broad Institute’s machine-learning engines secure competitive edges by predicting capsid performance with 90% accuracy, enabling tailored vectors that improve efficacy while reducing dose-related toxicity.
Catalent’s status as the only CDMO with FDA-cleared commercial AAV lines positions it strategically amid soaring outsourcing demand. Meanwhile, Pfizer, Novartis, and Roche leverage patent exclusivities and manufacturing alliances to defend share. White-space opportunities persist in extra-hepatic targeting, cost-down process intensification, and combination therapies pairing gene editing with small-molecule modulation.
Global Gene Delivery Systems Industry Leaders
Pfizer, Inc.
Becton, Dickinson and Company
Takara Bio
Novartis AG
F. Hoffmann-La Roche Ltd
- *Disclaimer: Major Players sorted in no particular order
Global Gene Delivery Systems Market Companies Covered in this Report
- Pfizer
- Novartis
- Roche
- Bayer
- Amgen
- Takara Bio
- Beckton Dickinson
- Thermo Fisher Scientific
- Lonza Group
- Catalent
- SIRION Biotech
- Genscript
- Genezen LLC
- Oxford Biomedica plc
- uniQure N.V.
- 4D Molecular Therapeutics
- Sarepta Therapeutics
- Spark Therapeutics

Market Opportunities and Future Outlook
One major opportunity centers on cost-down and de-risked scale-up for viral vectors and next-generation non-viral platforms as programs move from clinical development into commercial demand. Platform manufacturing offerings that raise yields and standardize CMC documentation are expanding, including Lonza's Xcite AAV stable producer cell line platform (introduced in May 2026) and SK pharmteco's SKyvec multimodal viral vector platform (June 2026), both designed to improve productivity across AAV and other vector types. These developments support broader outsourcing by developers constrained by limited GMP slots and high-quality analytical requirements, while reinforcing CDMOs' role as suppliers of validated processes, not only capacity.
White-space also persists in delivery modalities that address immunogenicity limits, re-dosing constraints, and tissue specificity, alongside administration formats that improve real-world usability for injectable gene therapies. Commercialization-oriented supply chain positioning includes Catalent and Nanoscope Therapeutics expanding their partnership in July 2026 to support late-phase development and commercial supply for MCO-010 under a rolling BLA submission with the FDA, and Skylark Bio partnering with Forge Biologics in June 2026 to access AAV development and cGMP manufacturing infrastructure. In parallel, NIST work on gene delivery systems points to ongoing standard-setting and measurement focus that can reduce friction in comparability, release testing, and cross-site technology transfer.
Recent Industry Developments in Global Gene Delivery Systems Market
- February 2026: Pfizer exercised an option to license a liver-targeted in vivo base editing candidate from Beam Therapeutics after a multi-year collaboration, moving the program into development and manufacturing. The deal highlights continued demand for delivery-enabling capabilities for in vivo editing and raises the emphasis on scalable vector and non-viral delivery solutions in late-stage pipelines.
- July 2025: BD announced the first pharma-sponsored clinical trial using its BD Libertas wearable injector technology for biologic drugs. As gene-based and biologic therapies increasingly rely on patient-friendly, high-volume subcutaneous administration, validation in sponsored clinical use supports broader adoption of advanced injection platforms across developer programs.
- July 2024: uniQure divested its Massachusetts gene-therapy manufacturing plant to Genezen, with Genezen positioned to manufacture Hemgenix for CSL Behring. The asset transfer reflects ongoing restructuring and specialization in manufacturing, with dedicated CDMO capacity taking on commercial supply roles for approved gene therapies.


Global Gene Delivery Systems Market Report Scope and Research Methodology
Market Definition and Coverage
This market covers tools and platforms used to transport genetic material into cells for research and therapeutic development, including viral, non-viral, and hybrid delivery approaches. The market value is measured as revenue generated from these delivery systems.
Scope exclusions: It excludes downstream gene therapy drug sales and clinical service revenue where delivery tools are bundled and not separately priced.
Segments Covered in This Report
- By Delivery Systems
- Viral Gene Delivery Systems
- Adenoviral Vectors
- Lentiviral Vectors
- Retroviral Vectors
- Other Viral Vectors (AAV, HSV, etc.)
- Non-viral Gene Delivery
- Combined / Hybrid Delivery Systems
- Viral Gene Delivery Systems
- By Application
- Oncology
- Infectious Diseases
- Cardiovascular Disorders
- Diabetes
- Pulmonary Disorders
- Other Applications
- By Route of Administration
- Injectable
- Oral
- Nasal
- Transdermal / Topical
- Other Routes
- By End User
- Biopharma & Gene-therapy Developers
- Contract Manufacturing & CDMOs
- Academic & Research Institutes
- Hospitals & Specialty Clinics
- By Geography
- North America
- United States
- Canada
- Mexico
- Europe
- Germany
- United Kingdom
- France
- Italy
- Spain
- Rest of Europe
- Asia-Pacific
- China
- Japan
- India
- Australia
- South Korea
- Rest of Asia-Pacific
- Middle East & Africa
- GCC
- South Africa
- Rest of Middle East & Africa
- South America
- Brazil
- Argentina
- Rest of South America
- North America
Data Sources, Market Sizing, and Validation
Desk Research
Desk research was used to build the fact base around demand signals, regulatory activity, and research intensity that typically pulls gene delivery spending. We relied on public sources such as FDA databases and FDA guidance materials, NIH and other public grant trackers, ClinicalTrials.gov trial listings, and WHO health and R&D statistics to understand how pipelines and funding are shifting.
We also reviewed patent databases and peer reviewed journals to track technology mix changes, for example viral vector innovation versus lipid nanoparticle progress, and to sanity check adoption timing. Company filings, earnings call transcripts, investor decks, association updates, and reputable press were used to map capacity additions and pricing direction. Select paid subscriptions for company financials and patent intelligence supported cross checks on revenue disclosures and IP intensity. These sources are illustrative only, and many other public references were used for data collection, clarification, and validation.
Primary Interviews and Surveys
Primary work was used to validate what is counted as a delivery system sale, how pricing is moving by modality, and where demand is rising faster, research use versus clinical translation. We spoke with a mix of manufacturers, research labs, CDMOs, and end users across major regions so the model assumptions could be corrected where public data was thin or not comparable.
Distribution of primary research fieldwork respondents
| Company type | Respondent position | Region |
|---|---|---|
| Top tier: 34% | CXOs: 12% | APAC: 42% |
| Mid tier: 51% | Functional/Unit leaders: 36% | EMEA: 35% |
| Smaller Players: 15% | Managers: 52% | Americas: 23% |
Market-Sizing & Forecasting
Market sizing starts with a top-down build where R&D and clinical activity are translated into a realistic demand pool for delivery systems, then shaped by modality mix and typical spend per program. To keep the totals practical, we used inputs such as active gene therapy and gene editing trial volume, funding trends for advanced therapies, viral vector and plasmid related capacity announcements, route of administration patterns that affect delivery choice, and adoption of lipid nanoparticles in adjacent nucleic acid workflows.
After that, selective bottom-up approximations were used as a cross check, including sampled supplier revenue signals, channel checks on common kit and reagent pricing, and a volume times ASP sanity check for high use platforms where volumes can be inferred. When data was missing for smaller geographies, gaps were handled using proxy indicators like trial intensity and public funding levels, followed by expert review to avoid over extrapolation.
For forecasting, scenario analysis was used with a short set of drivers that interviewees agreed are most sensitive, including regulatory approval pace, clinical trial starts, manufacturing capacity utilization, and expected ASP movement for viral and non-viral solutions. The forecast was then adjusted when the implied growth did not align with real world constraints such as scale up timelines and quality related bottlenecks.
Data Validation & Update Cycle
Outputs are checked against independent signals like trial counts, funding direction, and reported capacity moves so one data series cannot steer the model by itself. Variance checks are run at region and modality level, and outliers are reviewed to confirm whether they reflect a real step change or a data mismatch.
Before sign off, the model and assumptions go through multiple analyst reviews, and re contact is triggered when a key input shifts or two sources disagree beyond a reasonable band. The report is refreshed annually, and interim updates are made for material events such as major approvals, policy changes, or manufacturing expansions. Right before delivery, a final pass is completed so clients receive the most current view available.
Mordor Intelligence's Gene Delivery Systems Market Sizing Compared With Other Published Estimates
Published market sizes for gene delivery systems can look far apart because the line between tools, enabling services, and downstream therapy revenue is not drawn the same way. Differences also come from how analysts time currency conversion, how they step up average selling prices during supply tightness, and how often assumptions are refreshed.
A refresh-led gap is common in this market because pricing and mix can swing when capacity expands or when a new clinical wave increases demand for a specific vector type. When ASP logic is updated using recent quotes and conversion is kept consistent to the stated year, and then validated against trial momentum and funding shifts, the final number stays closer to the addressable delivery tool revenue, which is the approach used by Mordor Intelligence.
Benchmark comparison
| Source | Market Size | Gaps in Research Methodology |
|---|---|---|
| Mordor Intelligence | USD 6.19 B (2025) | |
| Industry Publisher A | USD 3.44 B (2024) | Uses an earlier base year and a longer horizon, and the counted revenue appears to lean more toward core delivery tools, which can understate near term pricing and modality mix shifts seen in recent years. |
| Global Consultancy B | USD 10.80 B (2024) | Likely applies a broader scope that can blend delivery technologies with adjacent gene therapy enabling categories, and the higher value can also reflect different currency timing and faster ASP progression assumptions. |
The spread is mainly explained by what gets counted as a delivery system sale and how quickly pricing and modality mix are updated year to year. By keeping scope boundaries explicit, checking totals against pipeline and funding signals, and making sure year specific currency and ASP assumptions are consistent, we get a number that is easier to trace and repeat.


Key Questions Answered in the Report
What is the current Global Gene Delivery Systems Market size?
The market is valued at USD 6.91 billion in 2026 and is projected to reach USD 11.96 billion by 2031.
Who are the key players in Global Gene Delivery Systems Market?
Pfizer, Inc., Becton, Dickinson and Company, Takara Bio, Novartis AG and F. Hoffmann-La Roche Ltd are the major companies operating in the Global Gene Delivery Systems Market.
Which is the fastest growing region in Global Gene Delivery Systems Market?
Infectious-disease programs are expanding at a 12.42% CAGR through 2031, powered by HIV and hepatitis B pipelines.
Which application segment is growing fastest?
In 2025, the North America accounts for the largest market share in Global Gene Delivery Systems Market.
Why are CDMOs becoming important in this market?
Developers face a 500% shortage in commercial-scale capacity; CDMOs fill the gap with specialized facilities and regulatory expertise.
Page last updated on:


 Your data is secure and never sold or shared.


