
GCC Flat Glass Market Size and Share
Market Overview
| Study Period | 2020 - 2031 |
|---|---|
| Forecast Data Period | 2026 - 2031 |
| Base Year Market Size (2025) | 1.43 Million tons |
| Market Volume (2026) | 1.49 Million tons |
| Market Volume (2031) | 1.81 Million tons |
| Growth Rate (2026 - 2031) | 3.98 % |
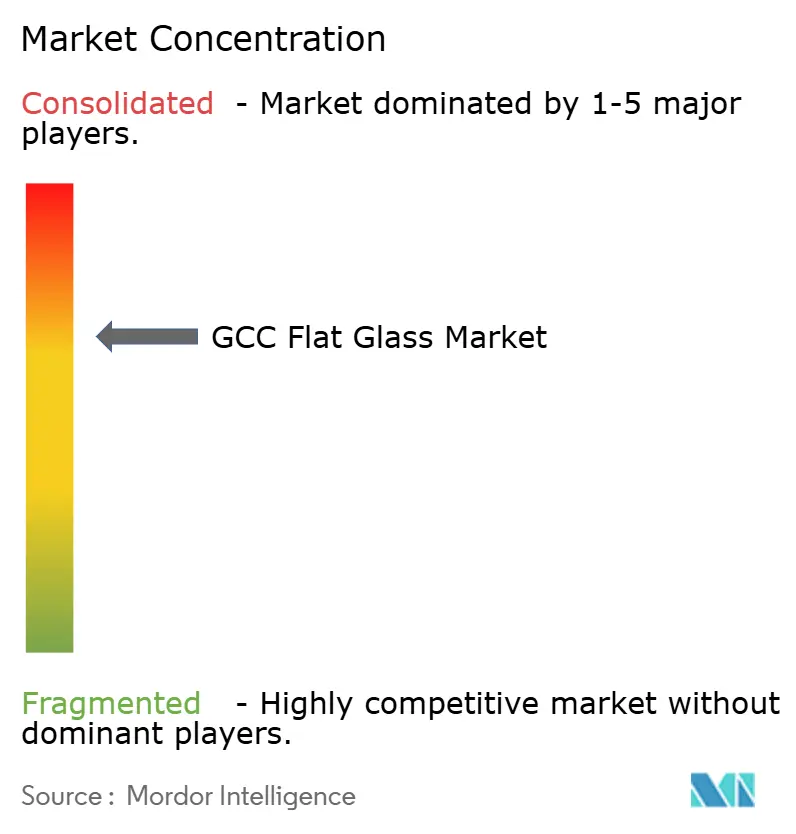
| Market Concentration | Medium |
Major Players *Disclaimer: Major Players sorted in no particular order Image © Mordor Intelligence. Reuse requires attribution under CC BY 4.0. | |
GCC Flat Glass Market Analysis by Mordor Intelligence
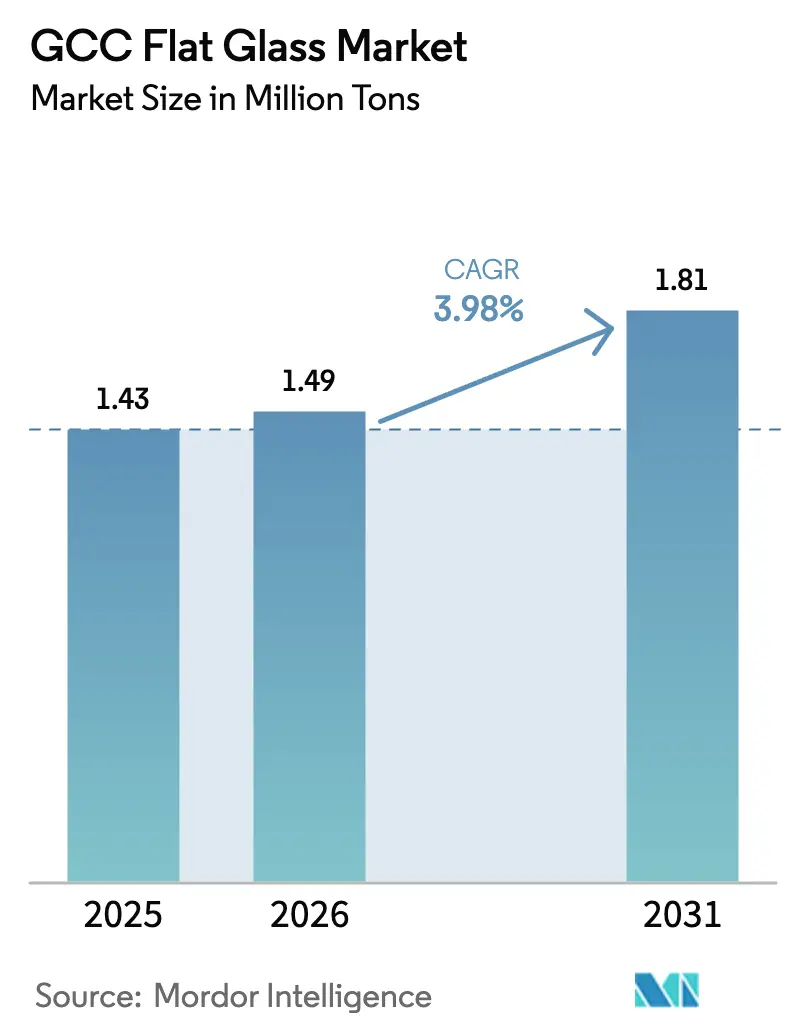
The GCC Flat Glass Market size was valued at 1.43 million tons in 2025 and estimated to grow from 1.49 million tons in 2026 to reach 1.81 million tons by 2031, at a CAGR of 3.98% during the forecast period (2026-2031). Expansion stems from the synchronized infrastructure agenda of Gulf economies, the steady rollout of renewable energy megaprojects, and policy pressure to localize material supply. Energy-efficient glazing regulations in Saudi Arabia, the United Arab Emirates, and Qatar have accelerated the switch from basic to value-added products, while the solar industry’s rapid scale-up is introducing specialized demand for low-iron, anti-reflective glass. Manufacturing investments totaling more than USD 1 billion since 2024 underscore confidence in regional self-sufficiency, although natural gas price swings and trade defense measures complicate cost planning for producers. Competitive positioning depends on integrated production footprints, advanced coating capabilities, and the ability to serve engineering, procurement, and construction contractors that prefer single-source façade packages.
Key Report Takeaways
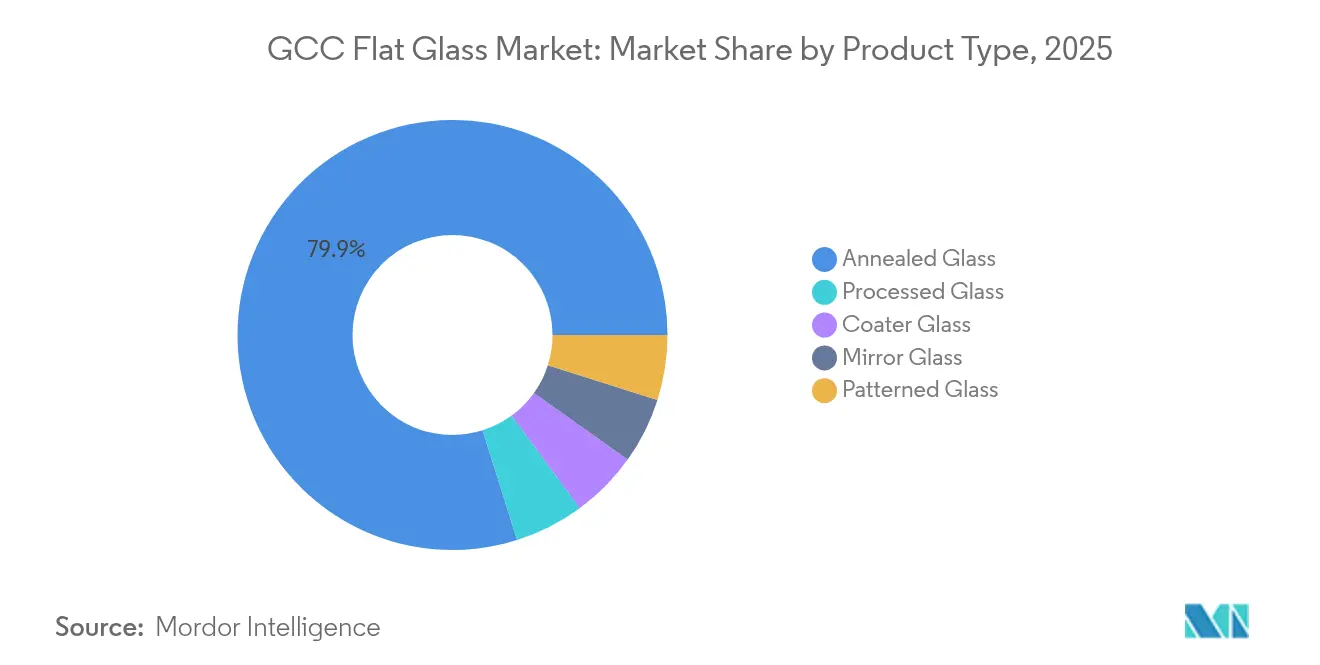
- By product type, annealed glass led with an 79.86% share of the GCC flat glass market in 2025, while processed glass is projected to post the fastest growth of 4.72% CAGR through 2031.
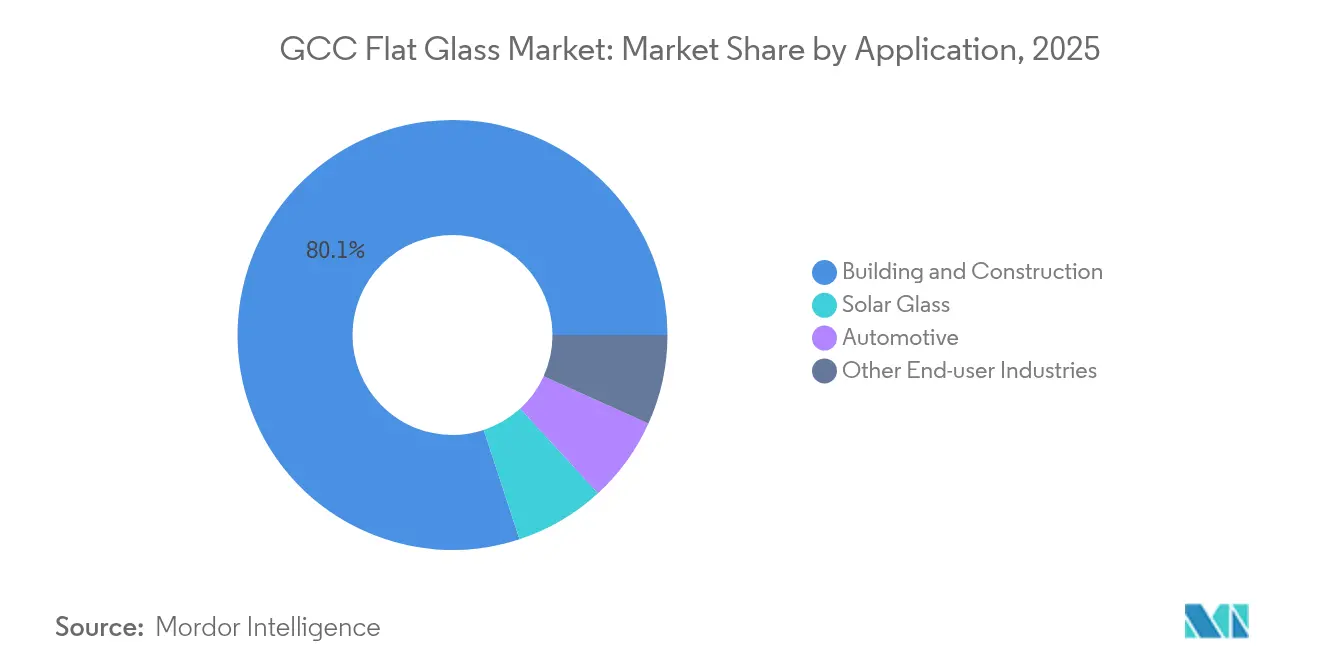
- By application, building and construction accounted for 80.05% share of the GCC flat glass market size in 2025, and solar glass is expected to expand at a 6.65% CAGR between 2026 and 2031.
- By geography, Saudi Arabia accounted for 60.10% of the GCC flat glass market share in 2025 and is projected to grow at a 4.64% CAGR through 2031.
Note: Market size and forecast figures in this report are generated using Mordor Intelligence’s proprietary estimation framework, updated with the latest available data and insights as of 2026.
GCC Flat Glass Market Trends and Insights
Drivers Impact Analysis*
| Driver | (~) % Impact on CAGR Forecast | Geographic Relevance | Impact Timeline |
|---|---|---|---|
| Boom in GCC Green-Building Mandates | +1.2% | Saudi Arabia, UAE, Qatar | Medium term (2-4 years) |
| Mega-Projects (NEOM, Lusail, Expo-City) Unlocking Demand | +1.8% | Saudi Arabia, UAE, Qatar | Long term (≥4 years) |
| Rise of Integrated Façade Contracting | +0.7% | GCC-wide, led by UAE, Saudi Arabia | Short term (≤2 years) |
| Localization Push for Float-Line Capacity | +0.9% | Saudi Arabia, spillover to Kuwait, Bahrain | Medium term (2-4 years) |
| Growth of Solar-Glass for CSP Plants | +1.1% | Saudi Arabia, UAE | Long term (≥4 years) |
| Source: Mordor Intelligence | |||
Boom In GCC Green-Building Mandates
Tighter building codes, introduced in 2024, require energy-saving glazing for large new projects. Saudi Arabia’s Green Building Code requires structures exceeding 1,000 m² to utilize glass configurations that meet stringent thermal-performance targets, which has prompted developers to adopt low-emissivity coatings[1]. Dubai’s Al Sa’fat framework enhances rating points for façades, ensuring solar heat-gain coefficients remain below 0.25 —a requirement that drives demand for coated or laminated units. Qatar and Kuwait have enacted parallel code updates capping allowable U-values, further widening the specification gap between annealed and processed products. Collectively, these rules support the 4.80% growth path for processed glass by channeling mainstream demand into higher-margin categories. Manufacturers capable of securing GSO 2663:2024 and GSO 2891:2024 certifications now enjoy preferred status in major tenders, giving established regional producers a competitive edge.
Mega-Projects (NEOM, Lusail, Expo-City) Unlocking Demand
Flagship schemes are multiplying overall square meters of glazing consumed. NEOM alone is estimated to need 50 million m² of specialized glass for its linear city, industrial districts, and tourism assets. Saudi Arabia’s Red Sea Amaala and Diriyah Gate clusters add thousands of hotel keys, each specified with high-performance façades. Qatar’s post-World-Cup project slate in Lusail keeps specialty glass orders flowing, while Dubai’s Expo City is committed to net-zero operations that depend on smart glazing. Developers favor local or regional suppliers to minimize logistics risk and comply with local-content rules, prompting manufacturers to expand their capacity near demand centers. Specifications often exceed commodity thresholds, favoring suppliers who can tailor optical, acoustic, and safety properties to meet project briefs.
Rise Of Integrated Façade Contracting (EPC-Glass Synergies)
Contractors are shifting away from fragmented sourcing in favor of single-vendor façade packages that encompass design, manufacturing, and installation. Dubai Investments’ glass cluster secured AED 2 billion in 2024 contracts by offering float, coating, and assembly services from a single platform. The integrated approach shortens project cycles and reduces coordination risk, creating entry barriers for standalone processors. Regional firms with local code knowledge and logistics agility can compete effectively against import-dependent suppliers. Consolidation among mid-sized processors is accelerating as they seek to achieve scale and technical breadth to meet EPC expectations.
Localization Push For Float-Line Capacity (Saudi Vision 2030)
Vision 2030 aims for 70% local content in construction inputs by 2030. Obeikan’s SAR 520 million second float line raised domestic capacity by 180,000 tons in 2024, supported by loans from the Saudi Industrial Development Fund, which covered up to 75% of the project cost. Import-duty adjustments further tilt price structures in favor of domestic output. New processing partnerships, such as Obeikan’s 2025 alliance with Isoclima, extend the localization narrative into automotive glass and advanced laminates. Rising self-sufficiency is expected to shift intra-GCC trade flows, positioning Saudi Arabia as a net exporter by the decade’s close.
Restraints Impact Analysis*
| Restraint | (~) % Impact on CAGR Forecast | Geographic Relevance | Impact Timeline |
|---|---|---|---|
| Natural-Gas Price Volatility Affecting Furnace Economics | -0.8% | GCC-wide, especially UAE, Qatar | Short term (≤2 years) |
| Increasing Antidumping Probes On Imported Flat Glass | -0.5% | GCC-wide | Medium term (2-4 years) |
| Slow Certification Cycles For New Glazing Technologies | -0.3% | GCC-wide, led by Saudi Arabia, UAE | Long term (≥4 years) |
| Source: Mordor Intelligence | |||
Natural-Gas Price Volatility Affecting Furnace Economics
Glass furnaces run nonstop at nearly 1,600 °C and consume 80-87% of plant energy. When gas costs surge past 40% of total production expense, small producers face margin compression and may idle capacity[2]. UAE and Qatar, which link gas tariffs to global LNG benchmarks, feel volatility more acutely than Saudi Arabia’s administered system. Larger groups like Emirates Float Glass hedge exposure with long-term contracts and heat-recovery upgrades. Smaller players lacking scale or capital for efficiency retrofits risk market exit, a trend that accelerates capacity consolidation.
Increasing Antidumping Probes On Imported Flat Glass
The GCC initiated an antidumping investigation in October 2024, covering imports from China and Iran under HS 7005.21 and 7005.29. Preliminary margins range from 15% to 40%, signaling likely duties that will increase import costs. Domestic producers stand to gain share, yet builders may face higher glazing bills just as mega-projects peak. Potential duty imposition influences foreign investors to relocate manufacturing to the region, balancing supply loss from curtailed imports with new localized output.
*Our forecasts treat driver/restraint impacts as directional, not additive. The impact forecasts reflect baseline growth, mix effects, and variable interactions.
Segment Analysis
By Product Type: Annealed Glass Dominance Faces Processing Revolution
Annealed glass remains the workhorse of the GCC flat glass market, accounting for 79.86% of the volume in 2025, thanks to its cost-efficient supply for mass residential and commercial builds. The rising popularity of curtain-wall façades with low-emissivity coatings is steering architects toward processed options. This shift is evident in procurement for NEOM’s mixed-use towers, where coated units replace commodity clear glass to meet thermal comfort targets.
Processed glass, led by tempered and laminated categories, is on track for a 4.72% annual growth rate through 2031, signaling a structural upgrade cycle. Coated products benefit from low-solar-gain specifications, while mirror and decorated variants are used in hotel and luxury retail fit-outs in Dubai, Riyadh, and Doha. Investments by Saint-Gobain and Guardian in magnetron-sputter coating lines enable the local production of triple-silver low-e glass, which was previously imported. Domestic processors, such as Obeikan, are forming technical alliances with European firms to capture premium applications, thereby shrinking lead times and reducing currency exposure for contractors. As these capabilities scale, the GCC flat glass market will rely less on imported processed units, an inflection that supports the region’s localization agenda.

By Application: Solar Glass Accelerates Beyond Construction Dominance
Building and construction kept an 80.05% share of the GCC flat glass market size in 2025. Mid-market residential towers, hospitals, and educational campuses, which form part of national housing and social infrastructure programs, anchor baseline demand. Curtain-wall systems, atriums, and skylights across mixed-use complexes reinforce high-volume draw.
Solar glass, though starting from a smaller base, outpaces all other applications at a 6.65% CAGR to 2031. Renewable-energy targets adopted by the UAE and Saudi Arabia require low-iron, anti-reflective sheets for utility-scale CSP and photovoltaic farms. Almaden’s planned 500,000-ton plant in Abu Dhabi alone will add enough capacity to glaze 5 GW of panels yearly, a scale that reconfigures supply dynamics. Automotive glass is expected to maintain mid-single-digit growth, buoyed by Saudi Arabia's ambitions to localize vehicle assembly. Building-integrated photovoltaic façades illustrate convergence between construction and solar applications, combining energy generation with envelope performance. As policy incentives broaden, specialized solar glass could erode construction’s share by the end of the decade, diversifying revenues for producers able to meet optical and durability benchmarks.
Geography Analysis
Saudi Arabia holds the lion’s share of 60.10% of the GCC flat glass market and is forecast to compound at 4.64% per year through 2031. The pipeline of giga-projects—NEOM, Red Sea, and Diriyah Gate—creates scale unmatched in the region. Local production is expanding: Obeikan’s second float line lifted nameplate capacity to 360,000 tons, and Gulf Guard is commissioning a USD 215 million expansion. Vision 2030 incentives favor domestic over imported glass, and duty tweaks reinforce price competitiveness. The kingdom’s renewables push adds solar-glass pull, aligning construction and energy sectors in driving demand.
The United Arab Emirates serves as a technology hub within the GCC flat glass market. Ras Al Khaimah’s industrial zone hosts Guardian Glass, Saverglass, and a growing cohort of solar-glass specialists. Glass Technology’s AED 350 million plant, inaugurated in April 2025, produces 5.5 million module sets annually, underpinning Abu Dhabi’s solar roadmap. Dubai’s luxury high-rise backlog sustains the appetite for smart and decorative glazing, allowing for premium pricing that funds further coating innovations. UAE manufacturers export across the Gulf and East Africa, leveraging free-zone logistics and trade pacts.
Qatar, Oman, Kuwait, and Bahrain represent smaller but stable slices. Qatar continues to retrofit stadium infrastructure into mixed-use assets, keeping specialty orders alive. Oman’s Duqm projects and Kuwait’s oil-sector office schemes maintain baseline consumption. These markets increasingly secure supply from Saudi and UAE plants, shaving lead times and reducing currency fluctuation risks tied to Asian imports. Over the forecast horizon, intra-GCC trade is expected to dominate more than 70% of shipments, confirming the bloc’s manufacturing self-reliance.
Value Chain Analysis
The GCC flat glass value chain starts with inputs such as silica sand, soda ash, limestone/dolomite, and cullet, supported by energy, followed by float-glass melting and forming in continuous furnaces that anchor cost competitiveness. Upstream-to-midstream integration is visible in Saudi Arabia and the UAE, where producers colocate float output with magnetron sputter vacuum deposition (MSVD) low-e coating and downstream processing to align with green-building specifications and EPC preferences for consolidated facade packages.
Downstream, fabricators and facade contractors assemble performance glazing into curtain walls, skylights, and other architectural systems for mega-projects. In this segment, logistics and lead times differentiate suppliers, particularly as imports face trade defense scrutiny. Vertically integrated platforms such as Emirates Glass (Dubai Investments) span raw-glass handling through fabrication and installation, while Obeikan Glass operates large-scale float capacity and supports higher uptime through onsite industrial gas supply, reflecting the region’s push to localize value-added glazing rather than importing finished units.
Competitive Landscape
The GCC Flat Glass market is moderately concentrated. Global majors Saint-Gobain, Guardian Industries, and AGC maintain a formidable presence via patented coating technology, global procurement leverage, and long-standing ties with multinational contractors operating in the Gulf. Their regional subsidiaries enjoy early-spec status on mega-projects that require documented performance histories. Nevertheless, regional champions such as Emirates Glass, Obeikan Glass, and Dubai Investments have closed the capability gap by adding magnetron sputter lines, automated cutting facilities, and integrated façade-assembly units.
GCC Flat Glass Industry Leaders
-
Saint-Gobain
-
Guardian Industries
-
Emirates Glass LLC
-
Obeikan Glass Company
-
Şişecam
- *Disclaimer: Major Players sorted in no particular order
Market Opportunities and Future Outlook
Saudi Vision 2030 and the Saudi Green Initiative are strengthening foundational demand for sustainable glazing and Low-E products. Giga-projects such as NEOM and the Red Sea Project concentrate purchasing around high-performance architectural glass, with NEOM alone estimated to require 50 million square meters of specialized glass, creating practical scope for local coating and processing capacity.
In the UAE and Qatar, urbanization and smart city mandates increase requirements for energy-efficient materials to meet Estidama Pearl Rating System and Dubai Municipality Green Building Regulations. Government incentives for domestic manufacturing support reduced import dependency, and Almaden’s planned 500,000-ton plant in Abu Dhabi illustrates ongoing capacity expansion. Solar-heat-coefficient disclosures for new construction above 5,000 square meters also raise the bar for online low-E coating capabilities.
Recent Industry Developments
- July 2026: Emirates Glass highlighted its architectural glass innovations, including new coatings, fire rated glass, and digital printing solutions, at the Zak World of Façades 2026 event in Dubai. The presentation underscored Emirates Glass's focus on expanding high-value facade solutions. The event points to continued market movement toward performance-oriented glazing for new developments.
- December 2025: GulfGuard announced plans to develop a second float glass line and a second glass coater at its Jubail Industrial City facility in Saudi Arabia. The expansion increases GCC flat glass capacity and strengthens local supply. The move also supports single-source packaging capabilities for major projects.
- September 2025: Obeikan Glass Company began on-site works for its second float glass production line in Yanbu Light Industrial Park, with 650 tpd capacity. The expansion increases capacity for GCC solar and building glass markets. It also strengthens the company's regional production footprint and vertical integration.
Research Methodology Framework and Report Scope
Market Definition and Coverage
For this methodology, the GCC flat glass market covers flat glass manufactured and consumed across GCC countries for building, automotive, solar, and other end uses, tracked as volume in tons and consolidated across key product forms used in these applications.
Scope exclusions: It excludes glassware and container glass, optical or lab glass, and small decorative items that do not follow flat-glass sheet production and conversion routes.
Segmentation Overview
- By Product Type
- Annealed Glass
- Coater Glass
- Processed Glass
- Mirror Glass
- Patterned Glass
- By Application
- Building and Construction
- Automotive
- Solar Glass
- Other End-user Industries
- By Geography
- Saudi Arabia
- United Arab Emirates
- Qatar
- Oman
- Kuwait
- Bahrain
Data Sources, Market Sizing, and Validation
Desk Research
Desk research was used to map the demand pool and the supply footprint before assumptions were applied. We referenced public construction and infrastructure indicators from sources such as GCC national statistics portals, central bank releases, and planning and municipal authorities that publish project pipelines and permitting signals. Trade and customs direction was checked using official customs releases and UN Comtrade style series so import reliance and re-export patterns did not get mixed into real consumption.
On the supply side, company annual reports, sustainability updates, investor presentations, and local press were reviewed to understand furnace capacities, restart schedules, and product mix shifts (for example, higher share of coated or processed glass). Where coverage gaps existed, we used paid subscriptions for company financials and intelligence, shipment-level import and export checks, and patent lookups for coating and processing activity that can indicate upgrades. The sources listed here are illustrative, and additional public and paid references were used for cross-checks, clarification, and final validation.
Primary Interviews and Surveys
Primary work focused on how demand is placed and delivered in the GCC, since buyers often purchase through processors, fabricators, and project channels rather than directly from float lines. We spoke with stakeholders across producers, converters, distributors, EPC and facade contractors, and large end users, and then reconciled differences by country conditions across Saudi Arabia, the UAE, Qatar, Oman, Kuwait, and Bahrain. Inputs from these discussions were used to validate conversion yields, typical thickness and coating choices, and timing-driven volume swings tied to specific project cycles, which then tightened the final model assumptions.
Distribution of primary research fieldwork respondents
| Company type | Respondent position |
|---|---|
| Top tier: 31% | CXOs: 15% |
| Mid tier: 54% | Functional/Unit leaders: 25% |
| Smaller Players: 15% | Managers: 60% |
Market-Sizing & Forecasting
Sizing was built using a top-down demand reconstruction, where construction activity and glazing intensity patterns were used to estimate sheet demand, and then filtered through application splits for building, automotive, and solar. For the GCC, this approach works because a meaningful part of consumption is tied to the project cycle, and the cycle can be traced with practical signals that are discussed in interviews.
To keep totals realistic, selective bottom-up checks were added, such as capacity and utilization sanity checks for regional float lines, channel checks with processors and distributors, and sampled volume by typical thickness bands to avoid overstating tonnage through double counting. Key inputs included: new-build and refurbishment activity in major cities, facade and window area trends for commercial and residential projects, coated and processed conversion rates, import share changes by country, and the pace of solar additions that lift demand for certain flat glass types. Forecasting relied on scenario-based analysis supported by expert views on the construction pipeline, energy-efficiency adoption, and capacity changes, with conservative and higher-activity cases used to stress-test the midpoint outlook. When bottom-up evidence was missing for smaller flows, we used clearly stated proxies, and those proxies were rechecked through follow-up calls.
Data Validation & Update Cycle
Outputs were validated through multiple checks so the final numbers do not rely on a single indicator. We compared country totals against trade direction, known capacity constraints, and conversion logic so demand could not exceed plausible supply plus net imports once re-exports were considered. Any sharp jumps were reviewed again, and assumptions were revisited when they did not match what participants described for project timing and procurement behavior.
Before sign-off, the model goes through step-by-step peer review, followed by targeted re-contacts when a key variable changes or a gap remains unresolved. The report is refreshed annually, and interim updates are triggered if material events occur, such as major furnace shutdowns, restarts, or policy shifts affecting construction or solar deployments. Right before delivery, the analyst completes a final pass so the view reflects the most recent information available.
Mordor Intelligence's Gcc Flat Glass Market Size Versus Other Published Estimates
Published estimates for GCC flat glass do not always match because some are built in revenue terms and others are tracked in physical volume, and the boundary between flat glass and converted products is not treated the same way. Differences also come from how imports are handled, how fast average pricing is assumed to move, and whether the forecast year range aligns with the current project cycle.
Capacity utilization signals, net import direction, and conversion yield checks are the evidence points used to keep Mordor Intelligence's estimate tied to sheet-equivalent tonnage rather than mixing in downstream fabricated value, which can inflate revenue-based totals without a matching rise in real volume.
Benchmark comparison
| Source | Market Size | Gaps in Research Methodology |
|---|---|---|
| Mordor Intelligence | USD 1.43 M (2025) | |
| Trade Journal A | USD 1.20 B (2024) | Presented in revenue, and the write-up does not clarify if processed and fabricated value is included, so the number can reflect downstream markups beyond sheet demand. |
| Global Consultancy B | USD 3.20 B (2024) | Likely applies broad application scope and aggressive pricing progression, and the higher total suggests that downstream conversion and installation value may be counted together with flat glass shipments. |
The table shows that most of the spread is explained by unit choice and boundary setting, not by a sudden change in real GCC demand. By grounding the model in repeatable signals like capacity, net trade, and realistic conversion yields, the final view stays traceable and can be updated consistently when new project and supply data comes in.
Key Questions Answered in the Report
How large will GCC flat glass demand be by 2031?
Volumes are forecast to reach 1.81 million tons by 2031, rising from 1.49 million tons in 2026.
Which country drives most consumption?
Saudi Arabia accounts for 60.10% of regional demand and combines the highest volume with a 4.64% CAGR outlook.
What segment is growing quickest?
Solar glass leads with a projected 6.65% CAGR to 2031 due to large-scale CSP and photovoltaic projects.
Why are processors adding capacity in the UAE?
Free-zone logistics, proximity to solar-park projects, and supportive industrial policy attract investments like Almaden’s 500,000-ton plant.
How do energy prices affect manufacturers?
Natural-gas volatility can raise furnace running costs to more than 40% of total production expenses, eroding margins for smaller plants.