
Market Overview
| Study Period | 2019 - 2031 |
|---|---|
| Forecast Data Period | 2026 - 2031 |
| Base Year Market Size (2025) | USD 9.53 Billion |
| Market Size (2026) | USD 11.64 Billion |
| Market Size (2031) | USD 31.66 Billion |
| Growth Rate (2026 - 2031) | 22.15 % |
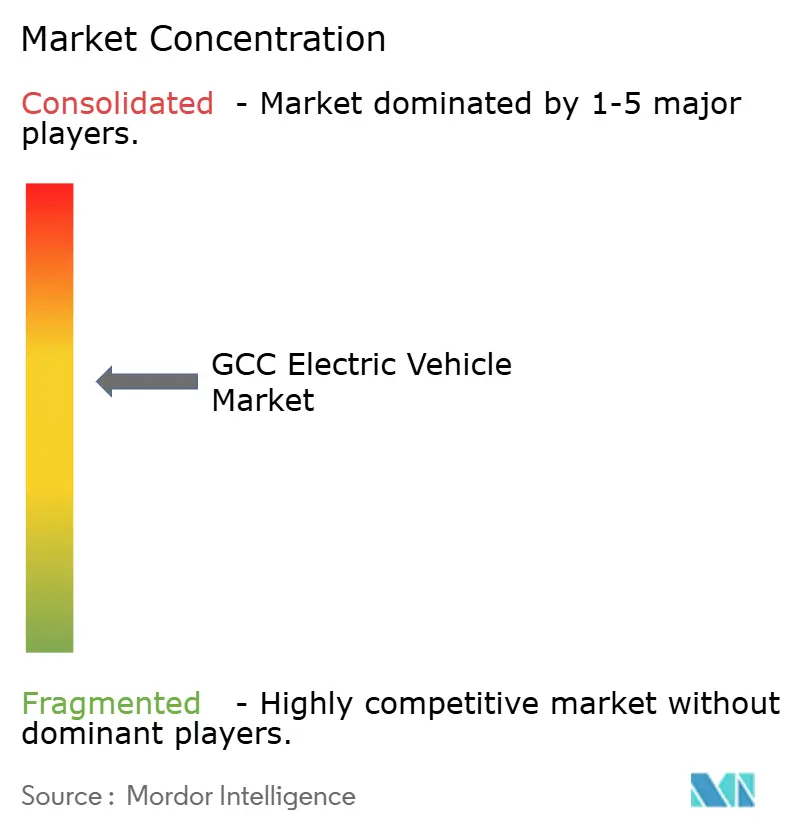
| Market Concentration | Medium |
Major Players *Disclaimer: Major Players sorted in no particular order Image © Mordor Intelligence. Reuse requires attribution under CC BY 4.0. | |
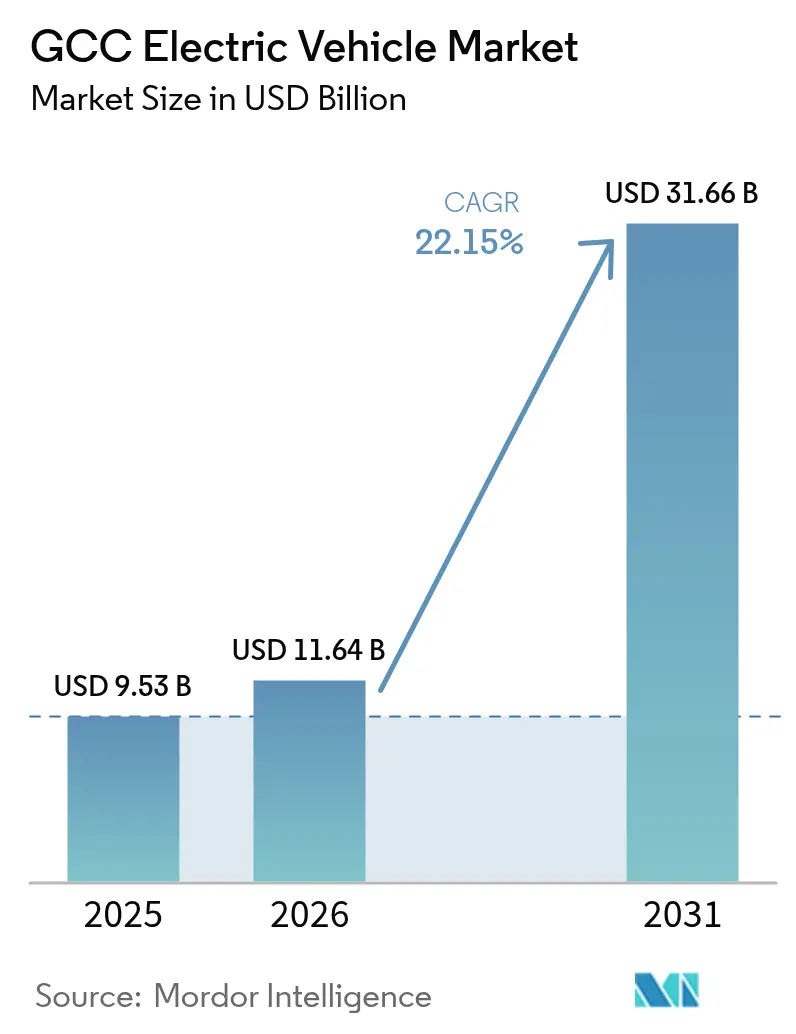
GCC Electric Vehicle Market Analysis by Mordor Intelligence
The GCC electric vehicle market size will rise from USD 9.53 billion in 2025 to USD 11.64 billion in 2026, reaching USD 31.66 billion by 2031, expanding at a CAGR of 22.15% over 2026-2031. Early-mover policy mandates, sovereign-wealth funding, and a rapid build-out of ultra-fast public chargers are synchronizing to accelerate adoption across every Gulf state. Automakers are localizing assembly to trim landed costs, while battery suppliers court regional gigafactory proposals that promise deeper supply-chain integration. Commercial fleets are electrifying faster as the total cost of ownership becomes more favorable, yet passenger cars still dominate absolute volumes. Competition remains moderate because no single brand controls more than 15% of the GCC electric vehicle market, creating space for regional entrants to win government and corporate tenders.
Key Report Takeaways
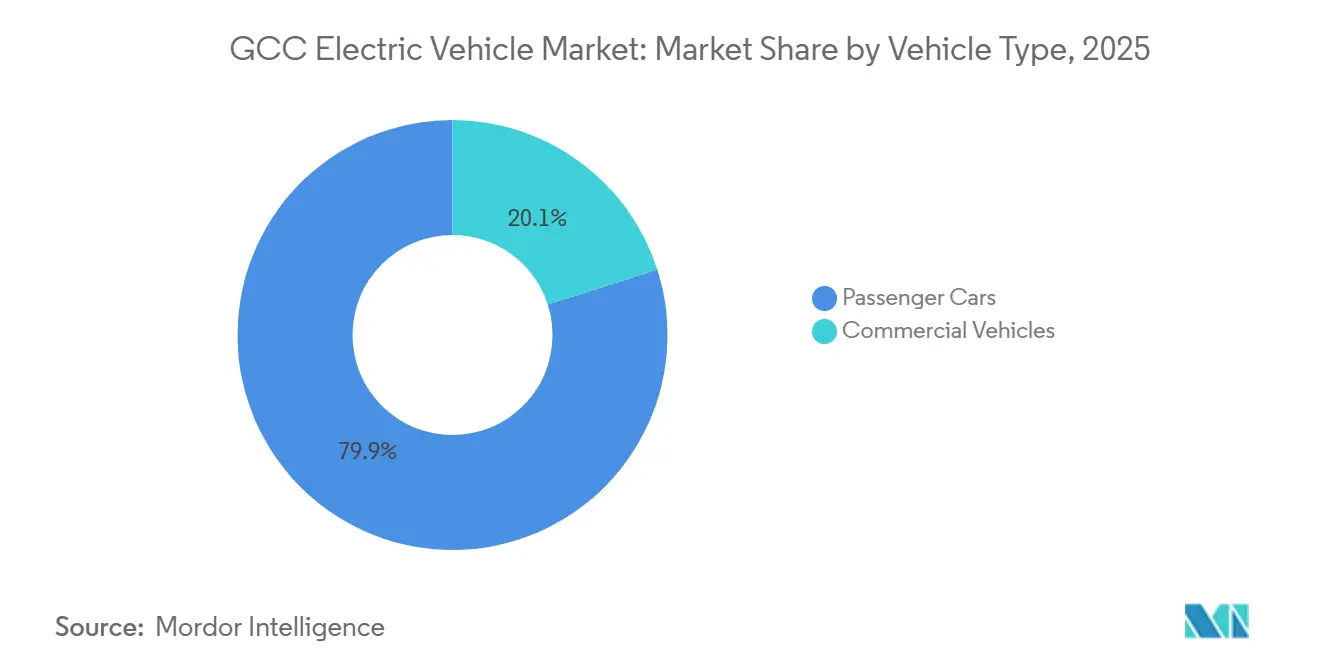
- By vehicle type, passenger cars hold 79.92% of the GCC electric vehicle market share in 2025, while commercial vehicles are forecast to grow at a 23.22% CAGR through 2031.
- By propulsion type, battery-electric vehicles captured 67.83% of the GCC electric vehicle market share in 2025; fuel-cell electric vehicles are projected to exhibit the highest CAGR of 23.98% through 2031.
- By battery capacity, 40–60 kWh packs accounted for 44.57% of the GCC electric vehicle market share in 2025, and packs above 100 kWh are advancing at a 22.99% CAGR through 2031.
- By charging infrastructure, AC slow chargers held 53.38% of the GCC electric vehicle market share in 2025, whereas ultra-fast units above 150 kW are set to post the fastest 28.51% CAGR through 2031.
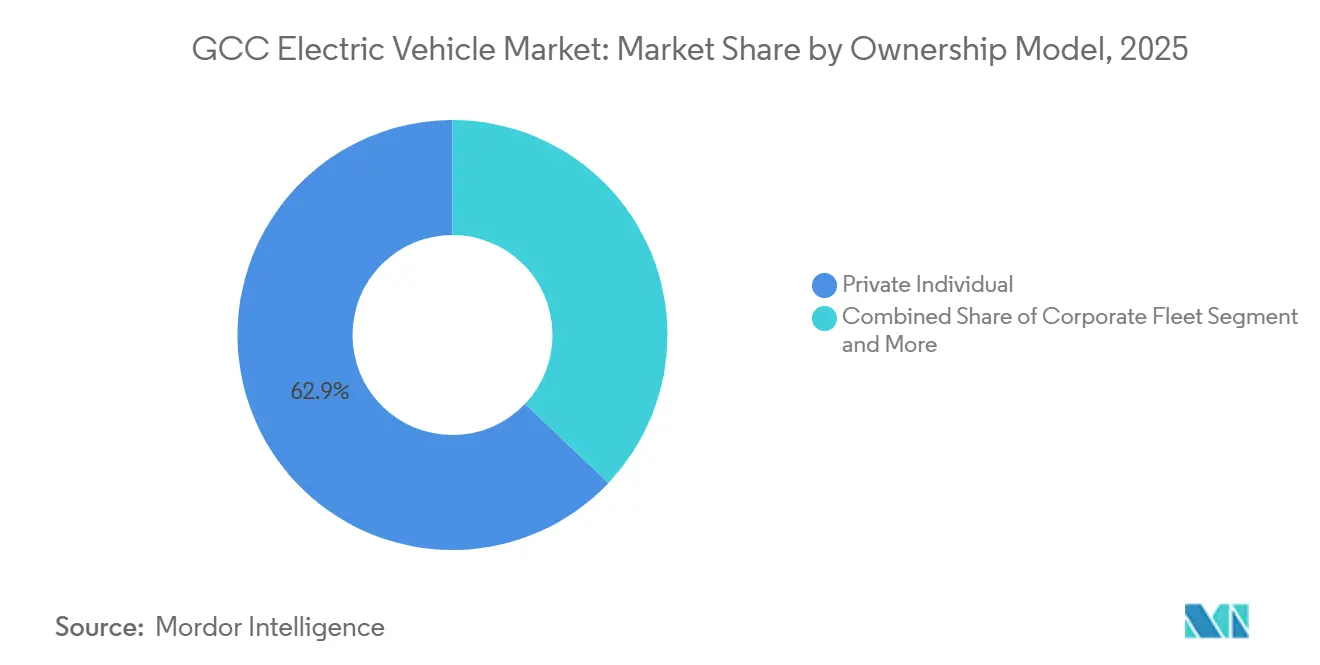
- By ownership model, private individuals accounted for 62.91% of the GCC electric vehicle market share in 2025, while corporate fleets are forecasted to record a 23.73% CAGR to 2031.
- By price segment, the USD 35,000–60,000 mid-range commanded 49.49% of the GCC electric vehicle market share in 2025, while the economy tier below USD 35,000 is projected to expand at 23.91% CAGR through 2031.
- By country, the United Arab Emirates accounted for 42.01% of the GCC electric vehicle market share in 2025; Saudi Arabia is forecast to post a 23.56% CAGR through 2031.
Note: Market size and forecast figures in this report are generated using Mordor Intelligence’s proprietary estimation framework, updated with the latest available data and insights as of 2026.
GCC Electric Vehicle Market Trends and Insights
Drivers Impact Analysis*
| Driver | (~) % Impact on CAGR Forecast | Geographic Relevance | Impact Timeline |
|---|---|---|---|
| Decarbonization Mandates and Zero-Emission Targets | +5.5% | Saudi Arabia, UAE, Qatar, Oman, Kuwait, Bahrain | Medium term (2-4 years) |
| Expenditure on Regional Assembly Plants | +4.2% | Saudi Arabia, UAE | Long term (≥ 4 years) |
| Expansion of Public Charging Infrastructure | +3.8% | UAE, Saudi Arabia, Qatar | Short term (≤ 2 years) |
| Falling Battery Pack Costs | +3.5% | Saudi Arabia, UAE, Qatar, Oman, Kuwait, Bahrain | Medium term (2-4 years) |
| Wealth Fund Equity in EV Start-Ups | +2.8% | Saudi Arabia, UAE, Qatar | Long term (≥ 4 years) |
| Cross-Border Green-Hydrogen Corridors | +2.0% | Saudi Arabia, UAE, Oman | Long term (≥ 4 years) |
| Source: Mordor Intelligence | |||
Government Decarbonization Mandates and Zero-Emission Targets
National programs such as Saudi Vision 2030’s 30% zero-emission vehicle goal for Riyadh and the UAE Climate Change Plan’s 50% cut in transport emissions are locking in long-term demand signals[1]. These mandates compel automakers to allocate production slots to the GCC electric vehicle market before other regions. Tier-1 suppliers are now scouting factory sites in Jeddah and Abu Dhabi to meet local content requirements. Fleet tenders embed zero-emission clauses, forcing bus and taxi operators to adopt electric drivetrains. As compliance windows tighten, incremental incentives such as reduced registration fees amplify consumer pull.
Automaker Capital Expenditure on Regional Assembly Plants
Ceer Motors, Lucid, and Hyundai together committed more than USD 5 billion to Saudi assembly capacity slated to start output in 2026. Local build lowers shipping and duty costs that historically inflated sticker prices in the GCC electric vehicle market. Assembly footprints anchor ancillary suppliers, nurturing a regional parts ecosystem. Shorter supply chains cut lead times, letting dealers hold leaner inventory. Over time, assembly plants may pivot to export, enhancing utilization and cost efficiency.
Rapid Expansion of Public Charging Infrastructure
EVIQ, ADNOC, DEWA, and Kahramaa collectively plan over 5,500 additional chargers by 2030, with ultra-fast sites spaced at 150-kilometer intervals on intercity corridors[2]. 15-minute recharge windows meet commercial-fleet uptime requirements, unlocking long-range battery-electric adoption. Charger density eases range anxiety for private buyers and supports tourism traffic across Gulf borders. Grid operators deploy smart-load software to align charging peaks with solar output, limiting new-build power-generation needs. Pilot battery-swap stations offer a complementary refueling model for ride-hailing fleets.
Falling Lithium-Ion Battery Pack Costs
Average pack prices slid to USD 108 per kWh in 2025 and trended toward the USD 100 threshold in 2026, narrowing the upfront premium versus gasoline cars. Cost parity accelerates the economy segment’s advance in the GCC electric vehicle market. Automakers channel savings into larger-capacity packs without higher retail prices, extending real-world range. Chinese LFP chemistries dominate import flows, balancing thermal stability with cost. Future breakthroughs in solid-state or sodium-ion could unlock another step-change if raw-material prices stabilize.
Restraints Impact Analysis*
| Restraint | (~) % Impact on CAGR Forecast | Geographic Relevance | Impact Timeline |
|---|---|---|---|
| High EV Price Vs ICE Parity | -2.8% | GCC-wide, particularly Kuwait, Oman | Short term (≤ 2 years) |
| Limited Model Availability | -1.9% | Saudi Arabia, UAE, Qatar | Medium term (2-4 years) |
| Grid-Scale Desalination | -1.4% | UAE, Saudi Arabia, Kuwait | Long term (≥ 4 years) |
| Sharia-Compliant Financing Structures | -1.1% | Saudi Arabia, UAE, Qatar | Medium term (2-4 years) |
| Source: Mordor Intelligence | |||
High Upfront EV Purchase Price Vs ICE Parity
Sticker prices remain significantly above internal-combustion equivalents across most Gulf showrooms, despite falling battery costs. Chinese brands partially bridge the gap below USD 35,000, yet luxury trims skew segment averages higher. Import duties in Kuwait and legacy financing norms elsewhere inflate effective ownership costs. Domestic assembly should shave 10–15% from prices as plants ramp, but broad parity for mass-market buyers is unlikely before 2027. Short-term subsidies or fee waivers can soften the transition for price-sensitive households.
Limited Model Availability for Extreme-Temperature Climates
Temperatures soaring past 40 °C can cut battery range by as much as 23%, dissuading potential buyers who frequently navigate long desert routes. Only a select few models come equipped with advanced thermal management and extended heat-warranty coverage. While added cooling hardware can elevate production costs, many entry-level imports choose to forgo it. Due to the absence of localized R&D, automakers are reluctant to certify their compact models for the sweltering Gulf summers. To fully embrace the market, there's a pressing need for advancements in heat-resistant chemistries and a more diverse model portfolio.
*Our forecasts treat driver/restraint impacts as directional, not additive. The impact forecasts reflect baseline growth, mix effects, and variable interactions.
Segment Analysis
By Vehicle Type: Commercial Fleets Accelerate Electrification
Passenger cars accounted for 79.92% of the GCC electric vehicle market share in 2025, underscoring the early dominance of private purchases. However, fleet operators’ focus on predictable duty cycles and bulk-energy contracts is steadily tilting momentum toward vans, buses, and trucks. Public-sector procurement aligns with low-emission targets, and logistics firms cite maintenance and fuel savings as pivotal factors. Depot-based overnight charging simplifies energy management, while governments grant preferential electricity tariffs to high-utilization fleets.
Commercial vehicles, expanding at a 23.22% CAGR through 2031, underscore the structural shift underway. Cities from Riyadh to Doha earmark dedicated bus lanes for zero-emission units, reinforcing modal confidence. Parcel-delivery networks deploy electric light vans that dovetail with e-commerce surge patterns. Pilot programs in medium-duty freight refine performance data under desert conditions, preparing the segment for scale. As corporate buyers aggregate demand, OEMs can justify sourcing chassis and batteries locally.
By Propulsion Type: Fuel Cells Gain Traction
Battery electric vehicles captured 67.83% of the GCC electric vehicle market size in 2025 by leveraging ubiquitous charger roll-outs and competitive total ownership costs. Incremental improvements in pack energy density address range anxiety for most daily routes. In tandem, software-based thermal controls mitigate degradation caused by high ambient heat, extending the usable lifespan. Fuel-cell electric vehicles are projected to deliver the fastest 23.98% CAGR through 2031, driven by funded green-hydrogen megaprojects in Saudi Arabia and Oman.
Three-minute refueling and heavy-load suitability position FCEVs as credible solutions for long-haul freight and intercity coaches. Early corridors anchor refueling nodes at existing truck stops, promoting operational familiarity. Policy makers monitor hydrogen price trajectories, aiming for sub-USD 4-per-kilogram parity milestones that could further diversify the GCC electric vehicle market's propulsion mix.
By Battery Capacity: High-Capacity Packs Gain Share
The 40–60 kWh band accounted for 44.57% of the GCC electric vehicle market share in 2025, mirroring the popularity of compact SUVs among urban drivers who prioritize affordability. Energy density gains enable this class to deliver well over 300 kilometers of real-world range, adequate for daily commuting and weekend trips within single emirates.
Packs above 100 kWh, forecasted to grow at 22.99% CAGR through 2031, headline the premium and commercial classes. Their extended range matches the Dubai–Riyadh round-trip flights with minimal stops, satisfying fleet-uptime imperatives. Luxury buyers also prize the thermal buffer that large packs afford during peak-heat months. As pack production scales in new regional facilities, the cost delta versus mid-size batteries is narrowing, accelerating adoption at both ends of the GCC electric vehicle market spectrum.
By Charging Infrastructure: Ultra-Fast Charging Accelerates
AC slow chargers below 22 kW constituted 53.38% of the GCC electric vehicle market share in 2025, a legacy of early residential incentives. Workplace landlords then layered mid-tier DC fast units to shorten top-up sessions during office hours, cultivating daily-use convenience for staff commuters. Ultra-fast chargers above 150 kW, advancing at a 28.51% CAGR through 2031, enable end-to-end Gulf crossings within standard driving breaks.
Energy companies retrofit highway service areas to host 350 kW dispensers that deliver 300 kilometers of range in about 10 minutes. Integration with solar-plus-storage arrays helps mitigate demand spikes. As high-power connectors become more universal, OEMs ensure next-generation models ship with compatible hardware, cementing ultra-fast’s role in the GCC electric vehicle market infrastructure mix.
By Ownership Model: Corporate Fleets Surge
Private individuals retained a 62.91% of the GCC electric vehicle market share in 2025, thanks to early adopters and expanding showroom availability. Government fee reductions, free parking, and subsidized home chargers sustained momentum in the premium districts of Dubai and Abu Dhabi. Corporate fleets, expected to grow at 23.73% CAGR through 2031, aggregate vehicle demand into multi-year contracts that reward OEM scale efficiencies.
Bulk procurements secure lower per-unit pricing and priority production slots. Ride-hailing and last-mile delivery firms piloting battery-swap platforms further emphasize the importance of uptime economics. Public bodies follow suit via tender mandates, channeling predictable volumes into domestic assembly pipelines and anchoring local supply chains inside the GCC electric vehicle market.

By Price Segment: Economy Tier Expands
The USD 35,000–60,000 mid-range held 49.49% of the GCC electric vehicle market share in 2025, buoyed by crossover models that blend practicality with brand cachet. Government salary profiles and consumer credit norms align naturally with this bracket, sustaining showroom traffic. Economy models priced below USD 35,000 are forecast to deliver the fastest CAGR of 23.91% through 2031, as Chinese brands expand their dealer networks across Riyadh, Jeddah, and Kuwait City.
Lithium-iron-phosphate chemistry slashes battery costs, and stripped-down trim lines cater to first-time buyers' budgets. When local assembly reaches volume, additional duty relief and logistics savings should propel mass-market adoption. Luxury tiers remain niche, constrained by sparse service networks and heat-warranty skepticism, yet they provide halo visibility that benefits the wider GCC electric vehicle market.
Geography Analysis
The United Arab Emirates accounted for 42.01% of the GCC electric vehicle market in 2025, reflecting Dubai and Abu Dhabi’s early investments in more than 3,000 public charging stations and generous registration incentives. Rapid consumer uptake snowballed as taxi, police, and municipal fleets integrated zero-emission targets. Showrooms clustered along Sheikh Zayed Road offered broad model ranges, sustaining brand competition—policy certainty, such as free Salik toll access for EVs, reinforced resale values, and buyer confidence.
Saudi Arabia is set to eclipse the UAE by 2031 on a 23.56% CAGR path, underpinned by Vision 2030’s 500,000-unit domestic-production mandate and the Public Investment Fund’s multi-billion-dollar commitments. Assembly lines for Ceer, Lucid, and Hyundai shorten delivery pipelines, while EVIQ’s 5,000-charger plan closes infrastructure gaps on major highways. Fleet conversions by SAPTCO and Aramco boost visibility and normalize EV usage in conservative consumer segments. Incentive frameworks, waiving import duties on battery cells, and guaranteeing low industrial-electricity tariffs further tilt the scales in favor of economics.
Qatar, Oman, Kuwait, and Bahrain collectively accounted for less than 15% of the GCC electric vehicle market in 2025, yet they pursue differentiated strategies to expand regional connectivity. Qatar’s Kahramaa eyes 600 to 1,000 public chargers and hydrogen ties to gas-export facilities, positioning Doha as a hub for fuel-cell freight to South Asia. Oman’s green-hydrogen megaproject pipeline secures financing that could underwrite FCEV refueling corridors. Kuwait trims customs duties on Chinese imports to stimulate demand from the economy tier, and Bahrain halves EV registration fees to accelerate mainstream adoption. Harmonized GCC technical standards aid cross-border interoperability, setting the stage for a more balanced geographic split in the GCC electric vehicle market by 2031.
Regulatory Landscape
GCC market access for electric vehicles is increasingly shaped by region-wide and national technical regulations that define safety, environmental, and performance requirements and set conformity-assessment expectations. The GCC Standardization Organization (GSO) issued a technical regulation covering electric vehicles in M and N categories (above 25 km/h), supporting regulatory convergence across member states and simplifying cross-border circulation for models that pass conformity assessment.
At the country level, Saudi Standards, Metrology and Quality Organization (SASO) aligns EV model approvals to the Product Safety Law through its Technical Regulation for Electric Vehicles and certificate-of-conformity process. Requirements draw on battery safety evidence and factory quality management systems, such as ISO 9001 or automotive QMS equivalents. In the United Arab Emirates, Cabinet Decision No. 50/2024 established UAE.S 2698:2024 as a mandatory standard for electric vehicles and EV chargers, effective from May 31, 2025. Dubai Electricity and Water Authority (DEWA) also issued EV charging technical regulations (May 2025) to govern EVSE installation and grid connection requirements in Dubai.
Value Chain Analysis
The GCC EV value chain is shifting from import-heavy finished-vehicle flows toward sovereign-backed assembly and supplier localization, while batteries and much of the power electronics supply remains predominantly imported. Upstream inputs include battery materials and cells, charging hardware, and thermal-management systems adapted to high-heat duty cycles. Midstream activities cover CKD/SKD assembly, homologation and conformity certification, dealer preparation, and fleet upfitting. Downstream channels include OEM dealers, government and corporate tenders, fleet leasing, and energy-company-led public charging networks.
Saudi Arabia and the UAE are building the industrial and logistics backbone through localization programs and charging regulation. In Saudi Arabia, Ceer signed 16 commercial agreements (February 2026) totaling over SAR 3.7 billion to localize parts supply for its planned model pipeline, reinforcing a supplier base around domestic production. In the UAE, the National Electric Vehicles Policy and Dubai charging rules (including DEWA licensing and connection requirements) strengthen the charger-operator ecosystem and support site development. Cross-border logistics initiatives such as Hafeet Rail (Etihad Rail, Oman Rail, and Mubadala JV) also add a manufacturing-to-port corridor linking UAE and Oman industrial zones, supporting movement of components, finished vehicles, and charging equipment across the region.
Competitive Landscape
Fragmentation defines the current GCC electric vehicle market, with Tesla, Nissan, Hyundai, BMW, and BYD together holding a modest plurality. Tesla leverages a proprietary Supercharger backbone to anchor premium buyers, while BYD scales swiftly in the economy tier by exploiting lithium-iron-phosphate cost advantages. Hyundai and Lucid pursue localized assembly to trim duties and freight costs, aligning product pipelines with evolving fleet tenders. Newcomer Ceer benefits from government procurement preferences and technology-transfer deals that shortcut time-to-market.
White-space opportunities appear most acute in commercial vehicles as bus operators and logistics majors seek turnkey electrification partners. Chinese truck OEMs are evaluating CKD kit assembly in the Gulf to avoid import levies and meet local-content rules. Battery-swap innovators, led by Ample, pitch five-minute refueling for ride-hailing fleets, challenging charger incumbents and enticing platform operators with higher asset utilization. Component suppliers such as Rimac embed thermal management and high-voltage expertise into regional factories, bolstering EV resilience in desert conditions.
Consolidation pressures will intensify after 2028 once assembly plants hit scale and charging networks mature. Brands without local manufacturing or a clear fleet proposition risk marginalization. Conversely, first movers that secure government and corporate volume contracts can lock in multiyear production visibility. As warranty data de-risks extreme-temperature operation, follow-on buyers could gravitate toward proven platforms, gradually raising concentration within the GCC electric vehicle market.
GCC Electric Vehicle Industry Leaders
-
Hyundai Motor Company
-
Tesla, Inc.
-
BMW AG
-
Nissan Motor Co., Ltd.
-
BYD Company Limited
- *Disclaimer: Major Players sorted in no particular order
Market Opportunities and Future Outlook
Public fast-charging hubs and corridor coverage create whitespace for site owners, charge-point operators, grid-integration software providers, and EPC firms, with activity focused on highways and large real-estate developments rather than residential-only charging. ADNOC Distribution launched a superfast EV charging hub at Saih Shuaib on the E11 highway in January 2026 with 60 high-speed charging points, and it published a plan to deploy 20 highway charging hubs by end-2027 (including 15 targeted for 2026). In Saudi Arabia, Eviq (PIF and Saudi Electricity Company JV) signed an agreement in March 2026 with New Murabba Development Company to deploy charging infrastructure across the New Murabba giga-project, creating bundled demand for hardware, operations, payment platforms, and maintenance services tied to a master-planned urban rollout.
Standards convergence and localization investments are also opening opportunities for compliant hardware suppliers, certification and testing services, and regional manufacturing partners that can meet new technical requirements while reducing lead times. Dubai Municipality announced a Dh150 million initiative (April 2026) with Emarat EV Charging Stations Company (UAEV) to install supercharging stations at 600 parking spaces, expanding addressable demand for turnkey charging systems and civil works. On the regulatory side, a GSO-approved rule requiring imported EV charging equipment to support the GB/T 2023 communication protocol (effective July 1, 2026) increases the value of multi-standard chargers, protocol-compliance engineering, and requalification support for importers, distributors, and fleet depots standardizing on interoperable charging across GCC corridors.
Recent Industry Developments
- July 2026: Clean Motion signed an exclusive distribution agreement with Averroes Tech Manufacturing to introduce its solar-assisted Evig vehicle across the GCC, with first shipments planned by the end of Q3 2026. The agreement also referenced a pathway toward local UAE manufacturing licensing in 2027, showing how distribution-led entry can transition into regional assembly as volumes build.
- May 2026: OPAZ and EL B&T signed a USD 250 million investment agreement to establish an EV and battery cell manufacturing project in the Special Economic Zone at Duqm (SEZAD), Oman. The project plan cites annual capacity of 60,000 EVs and 1.6 million battery cells, reinforcing the GCCs upstream-to-midstream supply chain by adding a localized battery component alongside vehicle manufacturing.
- February 2026: Ceer signed 16 commercial agreements totaling more than SAR 3.7 billion to localize vehicle parts supply for its planned production program. This supplier contracting step further deepens the domestic component ecosystem around Saudi assembly and supports shorter procurement cycles for fleets and government tenders that prefer localized content.
Research Methodology Framework and Report Scope
Market Definition and Coverage
For this study, the market measures the value of electric vehicles sold and registered across GCC countries, covering passenger and commercial vehicles that use an electric drivetrain. This includes battery electric, plug-in hybrid, hybrid, and fuel cell electric models.
Scope exclusions: This sizing does not treat charging stations, grid upgrades, or standalone battery supply as part of the electric vehicle market value.
Segmentation Overview
- By Vehicle Type
- Passenger Cars
- Hatchbacks
- Sedans
- SUVs and Crossovers
- Commercial Vehicles
- Light Commercial Vans
- Buses and Coaches
- Medium and Heavy Trucks
- Passenger Cars
- By Propulsion Type
- Battery Electric Vehicles (BEV)
- Plug-in Hybrid Electric Vehicles (PHEV)
- Hybrid Electric Vehicles (HEV)
- Fuel Cell Electric Vehicles (FCEV)
- By Battery Capacity (kWh Range)
- Below 40 kWh
- 40 to 60 kWh
- 61 to 100 kWh
- Above 100 kWh
- By Charging Infrastructure Type
- AC Slow Chargers (Below 22 kW)
- DC Fast Chargers (22 to 150 kW)
- Ultra-Fast Chargers (Above 150 kW)
- Battery Swap Stations
- By Ownership Model
- Private Individual
- Corporate Fleet
- Ride-hailing / Car-sharing
- Government and Municipal
- By Price Segment
- Economy (Below USD 35k)
- Mid-range (USD 35k to 60k)
- Luxury (Above USD 60k)
- By Country
- United Arab Emirates
- Saudi Arabia
- Qatar
- Oman
- Kuwait
- Bahrain
Data Sources, Market Sizing, and Validation
Desk Research
We start with desk research to build the base structure of demand, supply, and policy direction in the GCC. Public sources help us confirm the vehicle parc trend and import reliance across GCC countries, and they also show how incentives and standards are evolving in each market. Examples of sources used include government transport and statistics portals in GCC markets, customs and trade statistics releases, IEA electric mobility indicators, and OPEC or energy ministry publications that explain fuel pricing and electrification targets.
To ground the model in real market behavior, we also review automaker and distributor announcements, investor presentations, and audited filings where available, followed by reputed regional press for launches, pricing changes, and fleet programs. Patent databases are used selectively to sanity check the pace of localization and battery related innovation signals. In addition, paid subscriptions for company financials and news intelligence, plus an import and export shipment level database, were used where they helped verify timelines and volumes. The sources listed above are illustrative and not exhaustive, and other references were also used for data collection, validation, and clarification.
Primary Interviews and Surveys
Primary interviews and surveys were used to pressure test desk assumptions and fill gaps that are common in GCC EV reporting, such as fleet ordering cycles, dealer level discounting, and the practical pace of charging rollouts. We spoke with a mix of OEM side teams, distributors, charging operators, fleet buyers, and ecosystem experts across the GCC so country level differences in policy, availability, and buyer behavior could be reflected in the final sizing.
Distribution of primary research fieldwork respondents
| Company type | Respondent position |
|---|---|
| Top tier: 32% | CXOs: 17% |
| Mid tier: 49% | Functional/Unit leaders: 29% |
| Smaller Players: 19% | Managers: 54% |
Market-Sizing & Forecasting
The core sizing uses a top-down and bottom-up combination, where country level vehicle sales and registration signals are reconstructed first and then converted into value using realistic transaction price bands for the major EV categories. Once this demand pool is built, we corroborate it with selective bottom-up approximations, such as distributor and fleet channel checks, sampled model line ASPs multiplied by estimated units, and import flow checks in markets where local assembly is still limited.
Key inputs that shape the GCC EV model include EV penetration within new vehicle sales, model availability and lead times, average selling price progression by price band (economy, mid-range, luxury), battery capacity mix (kWh bands) that often tracks consumer preference, and fleet adoption triggers such as total cost of ownership and public procurement programs. Country level policy indicators, including incentive structures and charging standards, are added since they affect adoption timing. Where small markets or niche propulsion types create gaps, we use conservative interpolation anchored to neighboring GCC adoption patterns and then validate the direction through follow-up conversations.
For forecasting, scenario analysis is used with a base case that reflects the most repeated expert view on rollout pace, supply timing, and charging coverage. The scenarios mainly flex adoption curves, ASP erosion speed, and fleet share changes, and then the output is checked against what is feasible given country targets and near term launch pipelines.
Data Validation & Update Cycle
Outputs are triangulated through multiple checks so one data series does not drive the full result. We compare country totals against independent signals such as announced fleet procurement, import intensity, charging point additions, and the pace of new model introductions, and then flag outliers for review. When a variance is large, analysts re-check conversion steps, revisit price assumptions, and re-contact sources if the gap looks structural.
A second analyst reviews the model logic and key assumptions before sign-off, followed by a final pass for consistency across time series and currency treatment. Reports are refreshed annually, and interim updates are made when material events occur, such as a major incentive change, a new assembly plan going live, or a step change in charging rollout. Before delivery, an analyst performs a freshness check so clients receive the latest updated view.
Mordor Intelligence's Gcc Electric Vehicle Market Size Compared Against Other Published Estimates
Published market values for GCC electric vehicles often vary because analysts do not always count the same things, even when the report titles look similar. Differences usually come from what is included in the headline value, the year used as the starting point, and how prices are treated when models and incentives change quickly.
The table shows a wide spread that typically comes from adjacent categories being added, like charging hardware or batteries, or from mixing unit based adoption stories with revenue sizing without a clear price build. In Mordor Intelligence's model, the total is built around GCC passenger and commercial electric vehicle sales value only, and it is kept separate from charging infrastructure and other upstream components so the number tracks vehicle demand signals more cleanly.
Benchmark comparison
| Source | Market Size | Gaps in Research Methodology |
|---|---|---|
| Mordor Intelligence | USD 11.64 B (2026) | |
| Regional Consultancy A | USD 9.10 B (2026) | Uses ex-factory pricing and assumes faster price compression, which can understate revenue in a luxury-heavy GCC mix, and it applies a conservative fleet adoption curve. |
| Trade Journal B | USD 13.20 B (2026) | Blends EV sales with charger and installation revenue under one headline and applies a single ASP uplift across countries, which can inflate the vehicle-only market value. |
Taken together, the gap is mostly explained by scope discipline and how pricing is converted from unit signals into USD value. Our approach stays traceable to country level adoption and price bands, and it can be repeated year to year with the same steps, which makes the forecast easier to interpret during planning discussions.
Key Questions Answered in the Report
What is the valuation of the GCC electric vehicle market?
It is valued at USD 11.64 billion in 2026 and projected to reach USD 31.66 billion by 2031.
Which Gulf country is growing fastest in EV adoption?
Saudi Arabia shows the fastest growth trajectory, supported by Vision 2030 production mandates and large-scale charging roll-outs.
How quickly are commercial EV fleets expanding in the GCC?
Commercial vehicles are forecast to grow at an annual 23.22% rate through 2031, outpacing passenger cars.
Which propulsion technology leads in 2025?
Battery-electric vehicles accounted for 67.83% of the GCC electric vehicle market in 2025, though fuel-cell electric vehicles have the highest projected growth rate.
What charging technology is scaling most rapidly?
Ultra-fast chargers above 150 kW are advancing at an 28.51% CAGR as operators focus on intercity corridors.