
Gastrointestinal Devices Market Size and Share
Market Overview
| Study Period | 2022 - 2031 |
|---|---|
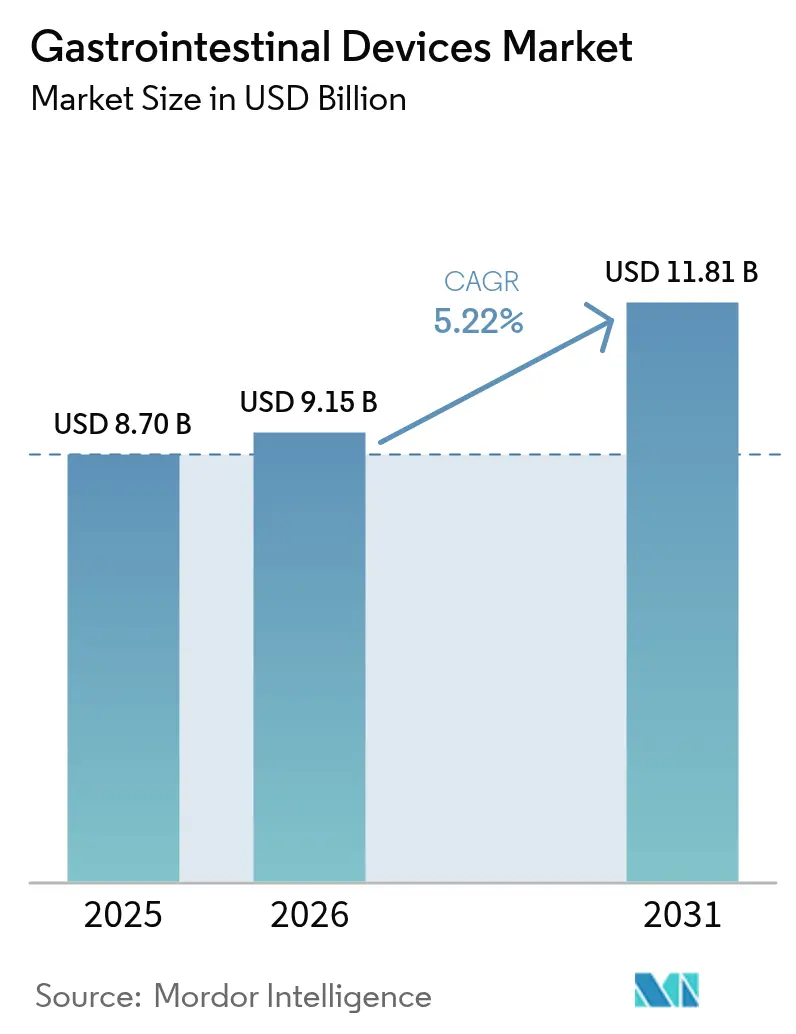
| Market Size (2026) | USD 9.15 Billion |
| Market Size (2031) | USD 11.81 Billion |
| Growth Rate (2026 - 2031) | 5.22 % |
| Fastest Growing Market | Asia-Pacific |
| Largest Market | North America |
| Market Concentration | Medium |
Major Players *Disclaimer: Major Players sorted in no particular order Image © Mordor Intelligence. Reuse requires attribution under CC BY 4.0. | |
Gastrointestinal Devices Market Analysis by Mordor Intelligence
The gastrointestinal devices market size is expected to grow from USD 8.70 billion in 2025 to USD 9.15 billion in 2026 and is forecast to reach USD 11.81 billion by 2031 at 5.22% CAGR over 2026-2031. Growth rests on the dual force of rising gastrointestinal disease prevalence and continuous product innovation, particularly in AI-enabled endoscopy systems that shorten procedure time and raise detection accuracy. Wider reimbursement for outpatient procedures, together with the acceleration of smart wearable and ingestible diagnostics, is expanding the addressable patient pool while shifting volumes from inpatient to ambulatory settings. Competitive intensity remains moderate as the top five suppliers hold a combined 68% share, yet the field stays open to specialized entrants introducing niche solutions such as electrical-mapping wearables and robotic suturing systems. Regionally, North America accounts for 40.02% of revenue on the back of mature screening programs and early AI adoption, while Asia-Pacific records the fastest 7.90% CAGR as infrastructure upgrades meet a steep rise in cancer incidence.
Key Report Takeaways
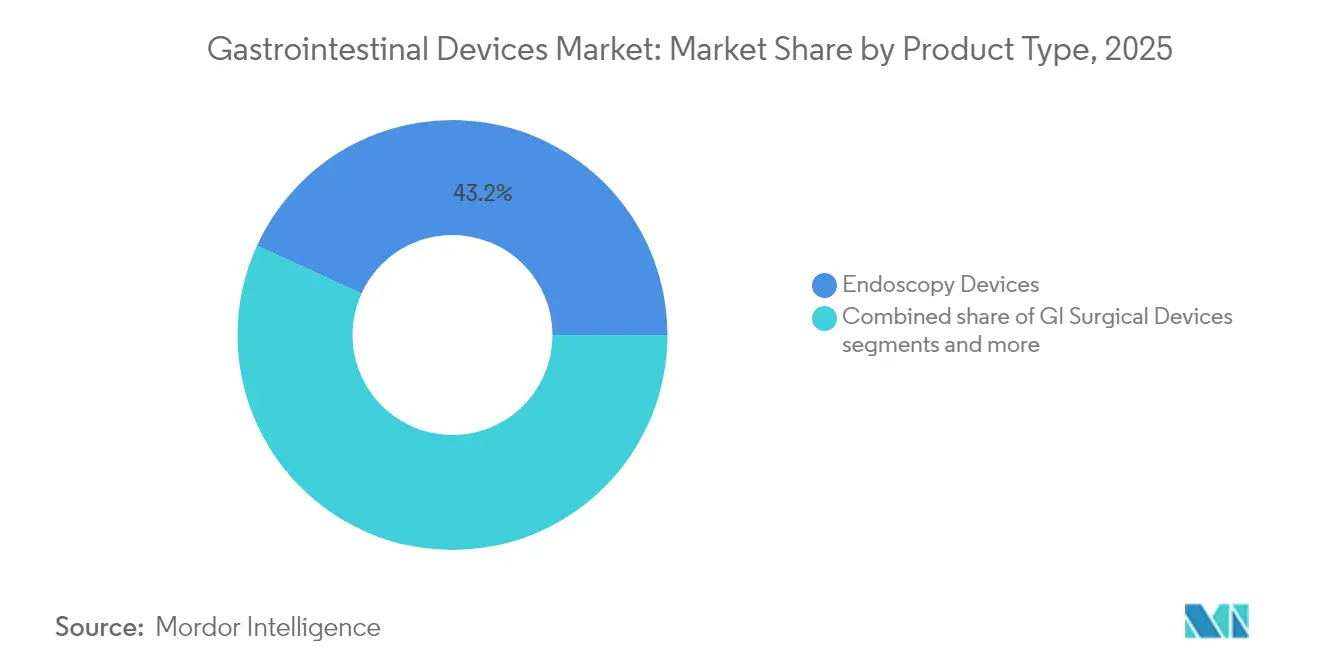
- By product type, endoscopy devices led with 43.18% revenue share in 2025; bariatric surgery devices are forecast to expand at a 6.03% CAGR through 2031.
- By end user, hospitals held 53.25% of the gastrointestinal devices market share in 2025, while specialty clinics and GI labs are projected to grow at 7.15% CAGR to 2031.
- By disease/disorder, colorectal cancer applications accounted for a 38.08% share of the gastrointestinal devices market size in 2025 and inflammatory bowel disease treatments are advancing at a 6.56% CAGR through 2031.
- By geography, North America commanded 39.62% of revenue in 2025; Asia-Pacific exhibits the highest 7.78% CAGR through 2031.
Note: Market size and forecast figures in this report are generated using Mordor Intelligence’s proprietary estimation framework, updated with the latest available data and insights as of 2026.
Market Trends and Insights
Drivers Impact Analysis of Gastrointestinal Devices Market*
| Driver | (~) % Impact on CAGR Forecast | Geographic Relevance | Impact Timeline |
|---|---|---|---|
| Rising prevalence of GI disorders | +1.8% | Global, highest in North America & Europe | Long term (≥ 4 years) |
| Growing adoption of minimally-invasive endoscopy | +1.2% | Global, led by developed markets | Medium term (2-4 years) |
| Ageing population & higher screening compliance | +0.9% | North America, Europe, Japan | Long term (≥ 4 years) |
| Expansion of reimbursement for outpatient GI procedures | +0.7% | North America, select European markets | Medium term (2-4 years) |
| AI-assisted endoscopy improving detection | +0.5% | Global, early adoption in developed markets | Short term (≤ 2 years) |
| Smart ingestible sensing capsules enabling remote care | +0.3% | Global, pilot programs in developed markets | Medium term (2-4 years) |
| Source: Mordor Intelligence | |||
Rising Prevalence of GI Disorders
Colorectal cancer shows the highest age-standardized incidence in Asia at 23.88 per 100,000 and stomach cancer continues as the top GI cancer killer, pushing demand for earlier detection tools. Non-oncologic burdens, notably inflammatory bowel disease, escalate procedure volumes that rely on advanced imaging, biopsy, and hemostasis devices. Dietary westernization, urban pollution, and sedentary lifestyles magnify disease risk across emerging economies, while the global shift toward older populations further elevates screening frequency. Collectively, these trends create durable pull for both diagnostic and therapeutic solutions within the gastrointestinal devices market.
Growing Adoption of Minimally-Invasive Endoscopy
Endoscopic balloon dilation now defers surgery in inflammatory bowel disease strictures, improving quality of life and trimming inpatient costs. Robotic endoluminal systems enter routine use to navigate tortuous anatomy with millimeter precision, which lowers complication rates and shortens recovery times. Imaging advances such as narrow-band and confocal modalities allow histology-level visualization during a single session, enabling immediate therapy. These combined benefits underpin the expanding share of minimally-invasive interventions inside the gastrointestinal devices market.
Ageing Population & Higher Screening Compliance
Guardant’s Shield blood test detects 83% of colorectal cancers, offering a convenient non-invasive route that boosts adherence among older, risk-averse adults. Medicare’s 2025 ASC payment update lifts reimbursement by 2.6% and broadens covered endoscopic procedures, reinforcing outpatient uptake. As longevity climbs, healthcare systems adopt age-specific surveillance protocols demanding high-definition endoscopes and AI triage software to manage screening loads with limited staff.
Expansion of Reimbursement for Outpatient GI Procedures
CMS proposes adding 547 GI-related codes to the ASC list for 2026, aligning payments with hospital outpatient rates. Separate payment for non-opioid adjuncts encourages facilities to embrace innovative pain-sparing devices. Countries in Europe mirror this shift, recognizing the economic efficiency of advanced endoscopy to shorten stays and prevent costly complications, thereby strengthening commercial prospects for vendors that document measurable outcome gains.
Restraints Impact Analysis of Gastrointestinal Devices Market*
| Restraint | (~) % Impact on CAGR Forecast | Geographic Relevance | Impact Timeline |
|---|---|---|---|
| High procedure & device costs | -0.8% | Global, most pronounced in emerging markets | Long term (≥ 4 years) |
| Stringent FDA & CE regulatory clearance timelines | -0.6% | Global, primary impact in North America & Europe | Medium term (2-4 years) |
| Shortage of skilled gastroenterologists | -0.4% | Global, acute in rural and emerging markets | Long term (≥ 4 years) |
| Device-related adverse-event publicity | -0.3% | Global, amplified by social media | Short term (≤ 2 years) |
| Source: Mordor Intelligence | |||
High Procedure & Device Costs
Premium systems such as robotic platforms and AI processors command high capital outlays and recurring disposables, creating affordability hurdles for lower-income providers. FDA import holds on Olympus inventories illustrate how supply disruptions can tighten availability and sustain pricing power in the United States. Hospitals respond by demanding value-based evidence that links technology cost to quantifiable outcome improvement, lengthening procurement cycles.
Stringent FDA & CE Regulatory Clearance Timelines
EU Medical Device Regulation requires expanded clinical dossiers and ongoing surveillance, pushing recertification deadlines into 2027–2028 and consuming manufacturer resources. Parallel FDA recalls, including Boston Scientific’s embolic agent for lower GI bleeding, reinforce a cautious climate that can delay releases and elevate R&D budgets.
*Our forecasts treat driver/restraint impacts as directional, not additive. The impact forecasts reflect baseline growth, mix effects, and variable interactions.
Gastrointestinal Devices Market Segment Analysis
By Product Type:
Endoscopy Dominance and Bariatric MomentumEndoscopy devices contribute 43.18% of 2025 revenue, making them the anchor of the gastrointestinal devices market. The gastrointestinal devices market size for endoscopy is USD 3.76 billion in 2025 and is projected to grow at a 4.85% CAGR through 2031. Continuous breakthroughs such as Olympus EZ1500 extended-depth-of-field scopes improve visualization and raise adenoma detection. AI overlays like Fujifilm CAD EYE deliver a 17% boost in adenoma detection without prolonging procedure time. The segment also benefits from disposable endoscopes that curb infection risk, aligning with stricter reprocessing regulations.
Parallel growth emerges in bariatric surgery devices, the fastest-expanding category at a 6.03% CAGR. MIT’s controllable gastric balloon hints at next-generation implants that can be adjusted post-placement, reducing revision rates. The incisionless ForePass device combines sleeve and balloon principles to cut weight gain by 79% while enhancing insulin sensitivity. Vendors now bundle endoscopic suturing, stapling, and hemostasis consumables to present holistic obesity interventions, expanding the addressable base beyond surgical suites into advanced endoscopy centers.


By Disease/Disorder:
Cancer Screening Prevails; IBD Therapy Gains SpeedColorectal cancer retains 38.08% revenue share in 2025, supported by mandated screening starting at age 45 and the rollout of AI-enhanced colonoscopy that reduces adenoma miss rates by 50%. Endoscopic submucosal dissection and full-thickness resection devices expand curative options without open surgery, preserving bowel function and speeding recovery.
Inflammatory bowel disease shows the fastest 6.56% CAGR as biologic and small-molecule therapies drive endoscopic monitoring frequency. Dual biologic strategies improve remission to 58.6% versus 39.5% with monotherapy, necessitating precise mucosal assessment through high-resolution scopes. Capsule-based motility and bleed detection solutions gain traction in remote disease management, complementing hospital-based therapeutic endoscopy. Obesity and GERD segments expand on the back of incisionless suturing, gastric electrical stimulation, and reflux barrier implants that deliver durable symptom relief without permanent anatomical alterations.
By End User:
Hospitals Remain Anchor While Specialty Clinics AccelerateHospitals command 53.25% of 2025 sales due to their capacity to manage complex multi-disciplinary cases and emergencies. The gastrointestinal devices market share advantage is reinforced by integrated imaging suites, interventional radiology support, and intensive care backup that smaller facilities cannot match. The segment retains steady growth as tertiary centers adopt robotic platforms, AI video analytics, and hybrid OR suites for advanced resections.
Specialty clinics and GI labs record the highest 7.15% CAGR as payers favor sites offering lower cost per case. Ambulatory surgical centers are projected to perform 44 million procedures by 2034, a 21% volume jump driven largely by endoscopy. Private equity investment accelerates this shift, financing purpose-built facilities equipped with single-use scopes and cloud AI platforms that ensure rapid turnover. Home-based capsule endoscopy assisted by 5G connectivity achieves 88% patient satisfaction and slashes travel-related emissions, pointing to a nascent but important extension of care pathways.
Geography Analysis
North America Gastrointestinal Devices Market
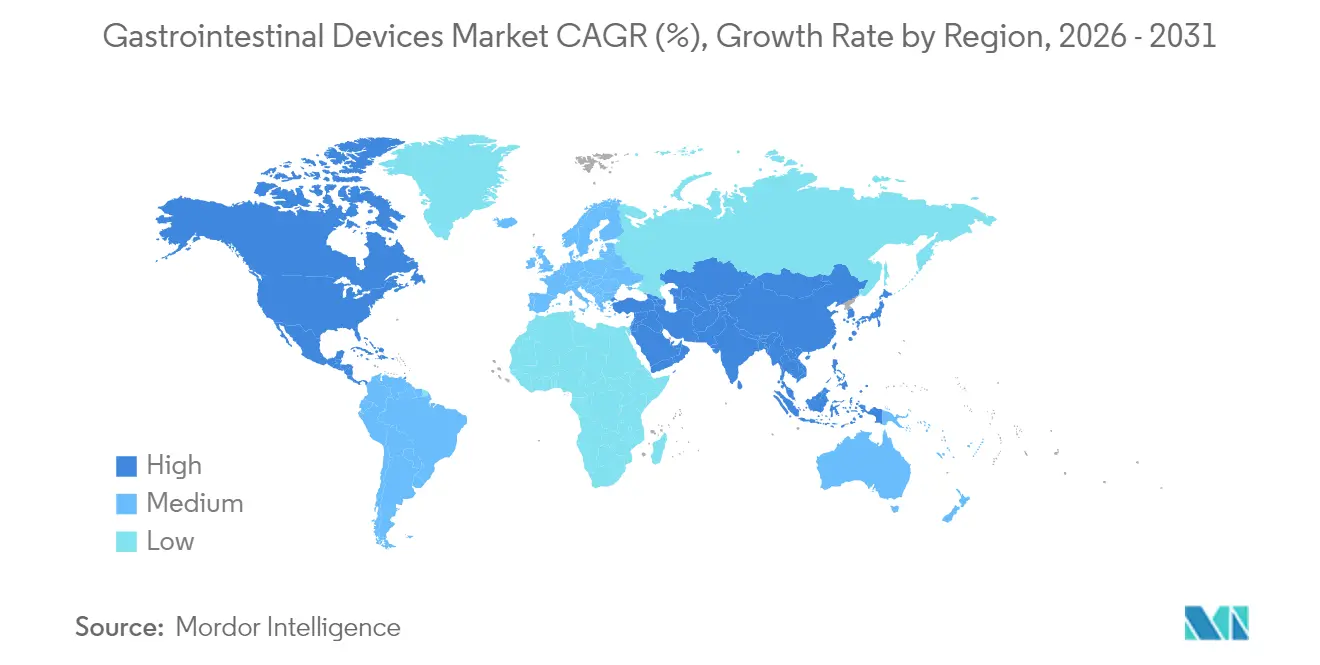
North America holds 39.62% revenue in 2025 owing to robust reimbursement and swift technology adoption. Early commercial deployment of AI cloud platforms and the FDA clearance of robotic systems such as Johnson & Johnson’s OTTAVA underscore the region’s innovation leadership. Supply-chain setbacks, including import holds on key endoscope models, can create intermittent device shortages yet also trigger rapid supplier diversification.
APAC Gastrointestinal Devices Market
Asia-Pacific posts a 7.78% CAGR, the fastest worldwide, thanks to higher cancer incidence, economic growth, and government spending on advanced imaging suites. The launch of India’s Gastro AI Academy illustrates dedicated efforts to upskill clinicians in AI-augmented workflows. China and South Korea channel state funding into domestic manufacturing of endoscopes and capsules to reduce import reliance, while Australia pilots nationwide tele-endoscopy programs in rural communities.
Europe Gastrointestinal Devices Market
Europe shows steady mid-single-digit growth tempered by Medical Device Regulation complexity. Extended recertification deadlines strain SME suppliers but enhance patient safety confidence in the long term. Major economies prioritize colorectal cancer screening adherence, underpinning sustained system purchases of advanced colonoscopy stacks.
LATAM and MEA Gastrointestinal Devices Market
Latin America and the Middle East & Africa together contribute a smaller but rising share. Brazil’s regulator ANVISA modernizes review pathways, attracting multinational suppliers, whereas Chile’s clinical-trial uptick signals growing regional R&D importance. Gulf Cooperation Council members invest in AI and robotics ranging from tele-endoscopy to print-on-demand stents, positioning the region for above-average future expansion.

Regulatory Landscape
In the United States, gastrointestinal devices sit within the FDA medical device framework, using risk-based classification and pathways such as 510(k) clearance. A key 2026 anchor for next-generation GI technologies is the FDA Quality Management System Regulation (QMSR), effective February 2, 2026, which aligns 21 CFR Part 820 with ISO 13485:2016 and raises the focus on end-to-end design controls and post-market quality systems. This applies to manufacturers supplying endoscopy platforms, GI hemostasis tools, and single-use or disposable components.
In Europe, EU Medical Device Regulation (MDR) compliance continues to influence evidence requirements, vigilance, and recertification planning, with the transition timeline extending into 2027-2028 for many device types. The EU also introduced a Well-Established Technologies approach in 2026 to ease clinical evidence bottlenecks for certain validated device categories, while the European Medicines Agency (EMA) signaled a more structured interface for innovative devices via its breakthrough devices pilot information session in April 2026. Together, these changes keep regulatory documentation and surveillance readiness central to commercialization, particularly for AI-enabled endoscopy software modules and novel ingestible or anatomy-altering endoscopic devices that increasingly fall under class II with special controls in the US.
Value Chain Analysis
The gastrointestinal devices value chain includes upstream precision components (optics, custom image sensors, high-bandwidth video processors, polymers, ASICs, and sterile packaging), OEM manufacturing and final assembly (endoscopes, processors, accessories, and therapeutic disposables), sterilization and reprocessing touchpoints, and downstream distribution through direct sales, specialized distributors, and service organizations that support installation, training, and maintenance. A key 2024-2025 operating constraint has been longer lead times (about 20-30 weeks) for custom image sensors and advanced processors used in high-definition and AI-enabled endoscopy stacks, reinforcing dual-sourcing and design-for-availability decisions.
Manufacturing footprint concentration and supply chain resiliency programs shape availability and margins, with production for flexible endoscopy historically concentrated in Japan, therapeutic GI devices in Germany, and electronics-heavy modalities such as capsule systems supported by US-based capability. Medtronic has highlighted a practical blueprint for scale suppliers by consolidating manufacturing and supply chain organizations and deploying integrated planning platforms (Snowflake and Blue Yonder) to improve forecast accuracy. Regulators such as FDA CDRH have also pointed to sterilization capacity vulnerabilities (including ethylene oxide constraints), which can ripple into device and accessory availability. Regional distribution hubs (including Singapore, Dubai, and the Netherlands) support inventory positioning, field service, and technical training to extend advanced GI platforms into emerging markets.
Competitive Landscape
The five largest companies command’s more than half of global sales, signifying moderate consolidation yet leaving meaningful room for specialist challengers. Olympus maintains its edge through continual optical upgrades and the first cloud-based AI detection service cleared by FDA. Boston Scientific’s share benefitted from the 2023 Apollo Endosurgery buyout that expanded bariatric solutions, while Medtronic strength of its GI Genius analytics engine.
Digital platform strategies dominate competitive positioning. Johnson & Johnson’s Polyphonic ecosystem couples video editing, case management, and AI modelling, supported by an NVIDIA alliance to scale real-time analytics in the OR. Canon Medical and Olympus cooperate on endoscopic ultrasound, illustrating a trend toward selective partnership rather than head-to-head competition[1]Source: Med-Tech Innovation, “Canon Medical and Olympus Team up,” med-technews.com .
Disruptors concentrate on novel sensing and access devices. Alimetry’s electrical-mapping wearable targets functional gut disorders outside conventional endoscopy, and AnX Robotica’s NaviCam system advances AI-guided capsule navigation. Strategic acquisitions such as Stryker’s USD 4.9 billion purchase of Inari Medical widen vascular access to GI bleeding applications[2]Source: Stryker Corporation, “Completes Acquisition of Inari Medical,” investors.stryker.com .
Gastrointestinal Devices Industry Leaders
Medtronic
Boston Scientific Corporation
CONMED Corporation
Olympus Corporation
Stryker
- *Disclaimer: Major Players sorted in no particular order

Gastrointestinal Devices Market Companies Covered in this Report
- Olympus
- Boston Scientific
- Medtronic
- Stryker
- Johnson & Johnson (Ethicon Endo-Surgery)
- FUJIFILM
- HOYA Corporation (PENTAX Medical)
- Conmed
- Cook Group
- Ambu
- Steris plc
- Karl Storz
- Coloplast
- B. Braun
- Smiths Group
- Intuitive Surgical
- Laborie Medical Technologies
- QIAGEN

Market Opportunities and Future Outlook
Opportunities are expanding where regulation and reimbursement are reducing friction for minimally invasive GI interventions and supporting broader outpatient throughput. In the United States, the FDA has continued to classify emerging GI modalities into class II with special controls, including a final order in May 2026 classifying endoscopic suturing devices used to alter gastric anatomy for weight loss as class II (510(k) with special controls) and a June 2026 class II classification for an orally ingested transient device for constipation. These actions create clearer development and labeling targets for manufacturers building endoscopic bariatric toolkits and ingestible diagnostics that fit ambulatory workflows.
Manufacturing and supply assurance is another active whitespace as providers increase use of advanced endoscopy disposables and accessories while managing intermittent constraints in sensors, processors, and sterilization capacity. Freudenberg Medical opened a second production facility in Coyol, Costa Rica in September 2025 with a USD 25 million investment to expand high-volume minimally invasive catheter capacity, supporting OEM supply for GI access and delivery components. On the portfolio side, GI-focused device M&A and partnerships are also visible: Galmed Pharmaceuticals signed a definitive agreement (announced June 2026) to acquire Colospan Ltd., adding the CG-100 intraluminal bypass device, reflecting continued interest in organ-preserving, incisionless therapies that complement established endoscopy and bariatric offerings.
Recent Industry Developments in Gastrointestinal Devices Market
- May 2026: Olympus signed an exclusive global distribution agreement with EndoRobotics Co., Ltd. to add robot-assisted technologies to its EndoTherapy portfolio for GI patient care. The agreement extends Olympus reach beyond core visualization into assisted endoluminal intervention, supporting bundled therapy strategies for advanced endoscopy centers.
- May 2025: Olympus announced FDA clearance of its EZ1500 endoscopes with extended depth-of-field capability. The clearance strengthens differentiation in visualization performance for screening and diagnostic workflows where higher detection and faster exams directly influence throughput in hospitals and ambulatory sites.
- February 2025: Stryker closed its USD 4.9 billion acquisition of Inari Medical. While primarily vascular, the deal expands Stryker capabilities in thrombectomy and related interventional toolsets that intersect with GI bleeding and access-driven procedures, supporting cross-specialty portfolio leverage.


Gastrointestinal Devices Market Report Scope and Research Methodology
Market Definition and Coverage
For this methodology, the gastrointestinal devices market covers medical devices used to diagnose, monitor, or treat conditions within the gastrointestinal tract, captured as revenues generated from device sales to clinical end users across major regions.
Scope exclusions: We exclude pharmaceuticals, standalone GI imaging modalities not sold as GI devices, and general hospital consumables that are not directly tied to GI procedures.
Segments Covered in This Report
- By Product Type
- Endoscopy Devices
- Endoscopes
- Visualization & Insufflation Systems
- GI Surgical Devices
- Bariatric Surgery Devices
- GI Hemostasis Devices
- GI Stent Devices
- Others
- Endoscopy Devices
- By End User
- Hospitals
- Ambulatory Surgical Centers
- Specialty Clinics & GI Labs
- Home-Care Settings
- By Disease/ Disorder
- Colorectal Cancer
- Inflammatory Bowel Disease (IBD)
- Obesity
- Gastro-Esophageal Reflux Disease (GERD)
- Others
- By Geography
- North America
- United States
- Canada
- Mexico
- Europe
- Germany
- United Kingdom
- France
- Italy
- Spain
- Rest of Europe
- Asia-Pacific
- China
- India
- Japan
- South Korea
- Australia
- Rest of Asia-Pacific
- South America
- Brazil
- Argentina
- Rest of South America
- Middle East and Africa
- GCC
- South Africa
- Rest of Middle East and Africa
- North America
Data Sources, Market Sizing, and Validation
Desk Research
Desk work starts by grounding the demand pool for GI procedures and device usage, and then it is mapped to what is actually bought and replaced in hospitals and clinics. We lean on public sources that help quantify patient flow and procedure intensity, such as CDC health statistics, the NIH and NLM for clinical literature signals, and OECD health data for system-level utilization and spend context.
To make the model practical, we also review device clearances and safety notes to understand what is commercially active and how quickly technology refreshes, using sources such as the US FDA device databases and similar regulator publications in key countries. Company annual reports, investor decks, and reputable press coverage are used to confirm product focus and geographic revenue patterns, and paid subscriptions for company financials and patent databases are used selectively to fill gaps in private-company visibility and innovation tracking. These examples are not exhaustive, and many other public and paid sources were used for collection, cross-checking, and clarifying assumptions.
Primary Interviews and Surveys
Primary work is used to pressure-test procedure growth, replacement cycles, and pricing behavior, because these are the levers that shift totals year to year. We speak with a mix of device-side experts, distributors, and clinical users (including procurement and department managers), and then we re-contact respondents when desk signals and interview inputs disagree on adoption timing or utilization patterns across regions.
Distribution of primary research fieldwork respondents
| Company type | Respondent position | Region |
|---|---|---|
| Top tier: 25% | CXOs: 15% | APAC: 41% |
| Mid tier: 57% | Functional/Unit leaders: 25% | EMEA: 36% |
| Smaller Players: 18% | Managers: 60% | Americas: 23% |
Market-Sizing & Forecasting
Sizing starts with a top-down build where procedure-driven demand is reconstructed using regional procedure intensity, diagnosed patient pools, and the typical device mix per intervention, which is then translated into revenues through observed price bands. To avoid over-relying on any single data series, results are corroborated with selective bottom-up checks, such as sampled ASP times shipment proxies, channel feedback on tender volumes, and supplier roll-ups for high-visibility categories.
A few inputs that matter in this market include GI screening and diagnostic volumes, the split between diagnostic and therapeutic procedures, replacement and reprocessing related refresh cycles for reusable equipment, single-use adoption trends, and reimbursement and guideline changes that shift site-of-care and throughput. For forecasting, scenario analysis is used around procedure growth and mix shifts, and the final trajectory is tuned using primary expert consensus on adoption pacing and price progression. When a product line is hard to observe directly in smaller countries, we apply transparent ratio methods tied to procedure volumes and hospital capacity, and then we adjust only after validation calls.
Data Validation & Update Cycle
Outputs are checked in more than one way so that totals remain tied to real-world signals, not just spreadsheet momentum. We compare implied device demand against independent metrics like procedure volumes, hospital throughput indicators, and known replacement timing, and then outliers are reviewed with a second analyst before sign-off.
The report is refreshed annually, and interim updates are triggered when major regulatory changes, reimbursement shifts, or step-change technology launches materially alter adoption. Before delivery, an analyst runs a fresh pass on key assumptions and recent public signals so clients receive the latest updated view.
Mordor Intelligence's Gastrointestinal Devices Market Sizing Compared With Other Published Estimates
Published market values for gastrointestinal devices can look far apart because each publisher chooses a different scope, timing, and set of pricing and utilization assumptions. Differences also come from whether the model is anchored on procedure demand, on device shipments, or on healthcare spend proxies, and then carried forward using varied growth expectations.
Some external estimates widen the market by folding in broader endoscopy platforms, service contracts, and adjacent consumables, and that naturally lifts the total. In contrast, Mordor Intelligence limits the count to GI-focused device revenues aligned to the defined product set and forecast window, and this reduces double counting when accessories and non-GI uses sit next to core GI procedures.
Benchmark comparison
| Source | Market Size | Gaps in Research Methodology |
|---|---|---|
| Mordor Intelligence | USD 9.15 B (2026) | |
| Trade Journal A | USD 11.27 B (2024) | Uses a GI endoscopic devices lens and often groups in a wider accessory set, and the earlier base year can also inflate the comparison if inflation and currency timing are not normalized. |
| Industry Research Brief B | USD 11.91 B (2025) | Centers on GI endoscopic devices and mixes multiple therapeutic and accessory categories, and the growth path is usually applied with fewer checks against procedure volumes and replacement cycles. |
The spread across sources mostly comes from what gets counted around endoscopy and related accessories, plus the chosen base year and how prices are moved forward. By keeping the scope tight to GI device revenues and then validating against procedure-linked signals and replacement behavior, the estimate stays traceable to clear inputs that can be repeated and reviewed.


Key Questions Answered in the Report
What is the current value of the gastrointestinal devices market?
It stands at USD 9.15 billion in 2026 and is forecast to reach USD 11.81 billion by 2031.
Which product segment contributes the largest revenue?
Endoscopy devices generate 43.18% of 2025 sales due to their central role in diagnostics and therapy.
Which region is expanding the fastest?
Asia-Pacific shows a 7.78% CAGR through 2031 as infrastructure investment meets rising disease incidence.
How are AI tools affecting colonoscopy outcomes?
AI systems such as GI Genius deliver 99.7% sensitivity and cut adenoma miss rates by half, raising screening effectiveness.
Why are specialty clinics gaining share from hospitals?
Payers favor their lower cost per procedure and rapid turnover, and ASCs are projected to perform 44 million procedures by 2034.
What regulatory change most influences device availability in Europe?
The EU Medical Device Re
Page last updated on:


 Your data is secure and never sold or shared.


