
Gasoline As A Fuel Market Size and Share
Market Overview
| Study Period | 2020 - 2031 |
|---|---|
| Market Size (2026) | USD 1.89 Trillion |
| Market Size (2031) | USD 1.98 Trillion |
| Growth Rate (2026 - 2031) | 0.98 % |
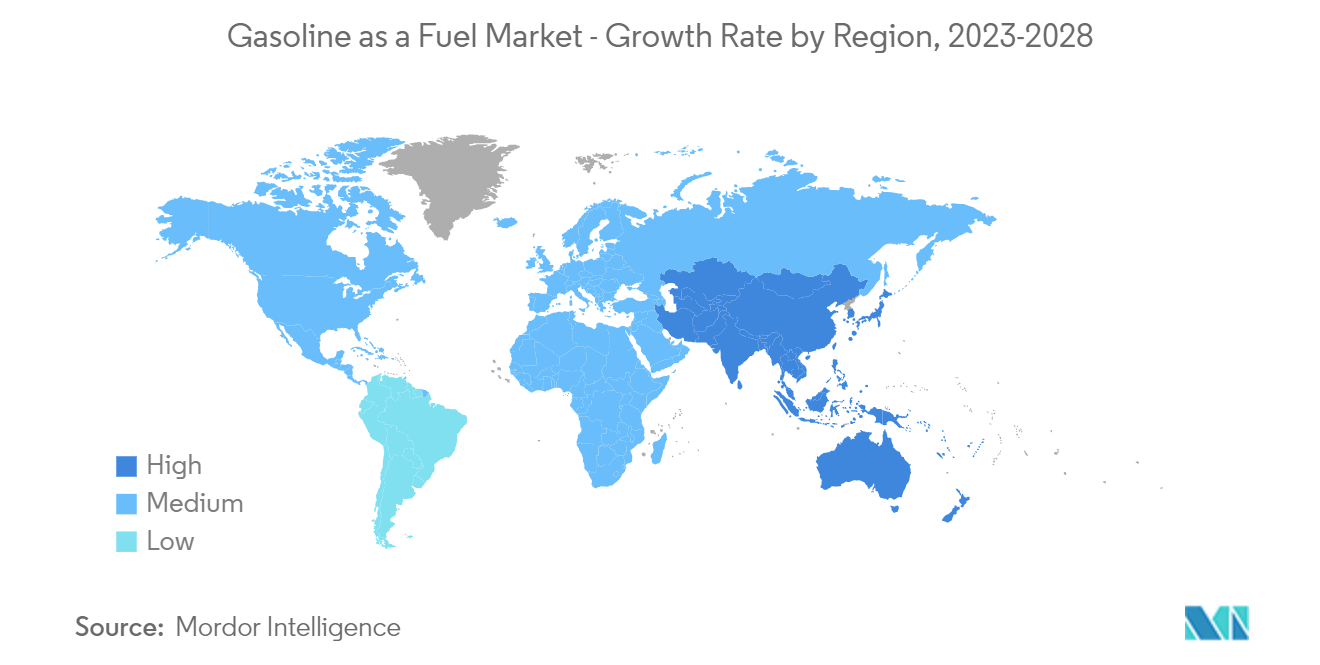
| Fastest Growing Market | Asia Pacific |
| Largest Market | North America |
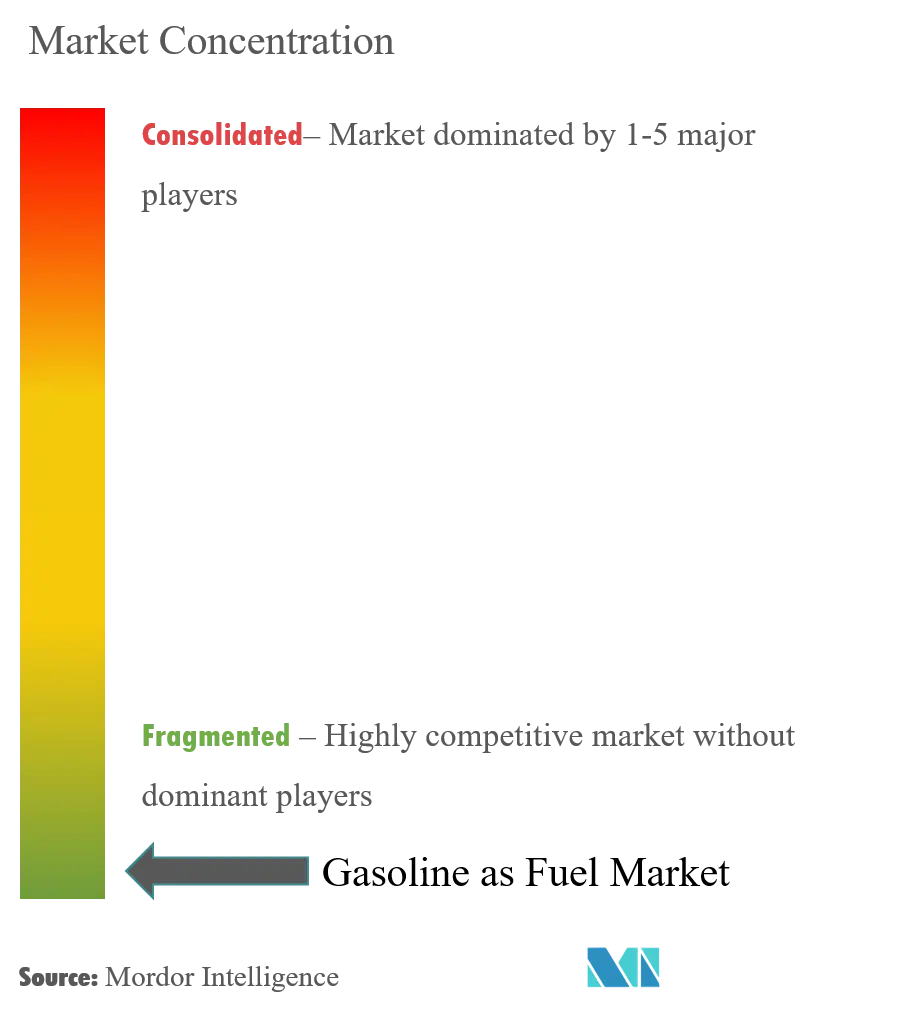
| Market Concentration | Low |
Major Players *Disclaimer: Major Players sorted in no particular order Image © Mordor Intelligence. Reuse requires attribution under CC BY 4.0. | |
Gasoline As A Fuel Market Analysis by Mordor Intelligence
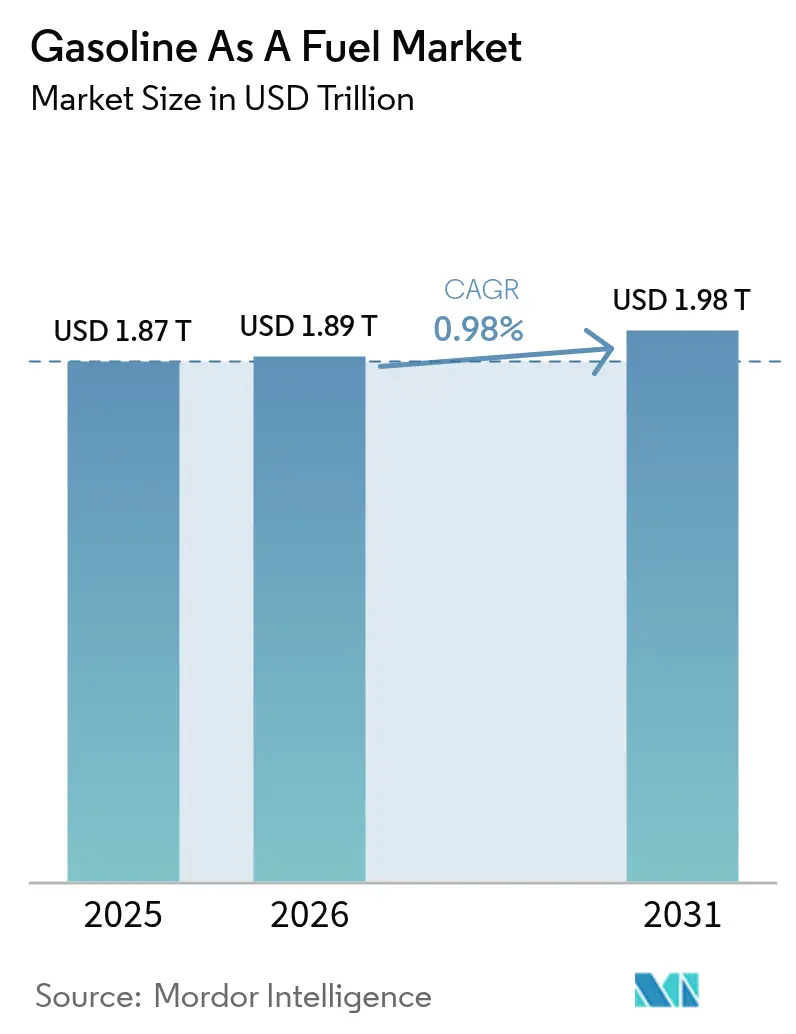
The Gasoline As A Fuel Market size is expected to grow from USD 1.87 trillion in 2025 to USD 1.89 trillion in 2026 and is forecast to reach USD 1.98 trillion by 2031 at 0.98% CAGR over 2026-2031.
- Over the medium term, factors such as the rising adoption of automobiles such as passenger cars and motorcycles across the world and the easy availability of gasoline are driving the growth of gasoline as a fuel market during the forecast period.
- On the other hand, the use of alternative clean sources of energy to reduce carbon emissions and the increasing penetration of electric vehicles across the globe is likely to restrain the growth of the market.
- Nevertheless, the emerging use of portable gasoline generators in home and event applications is anticipated to create ample opportunities for gasoline as a fuel market in the near future.
Note: Market size and forecast figures in this report are generated using Mordor Intelligence’s proprietary estimation framework, updated with the latest available data and insights as of 2026.
Global Gasoline As A Fuel Market Trends and Insights
Transportation Segment is Expected to Dominate in the Market
- In order to operate smoothly and efficiently, the transportation sector requires a considerable amount of energy. Most vehicles require secondary fuels such as gasoline, diesel, or jet fuel. Primary fuels such as crude oil or natural gas are converted into usable fuels through the use of technology.
- As one of the most used fuels in automobiles, gasoline is a petroleum-based fuel designed for engines with four to six cylinders, which are found in many cars. Gasoline offers numerous advantages to automobile drivers. Due to its high combustibility, gasoline-powered vehicles tend to start up faster than those powered by other fuels. Compared to other fuels, gasoline accelerates much more quickly.
- Further, two-wheelers are widely available worldwide, with varying demand levels and popularity across various regions. Further, two-wheelers are widely used for personal transportation in countries such as China, India, Indonesia, Vietnam, Thailand, and several other Asian countries.
- According to the Society of Indian Automobile Manufacturers (SIAM), a total of 19.45 million two-wheelers were produced in India during the fiscal year 2023, with a growth rate of 9.1% from the previous year, and further, the two-wheeler production represented around 75% of all automobiles produced in the FY 2023.
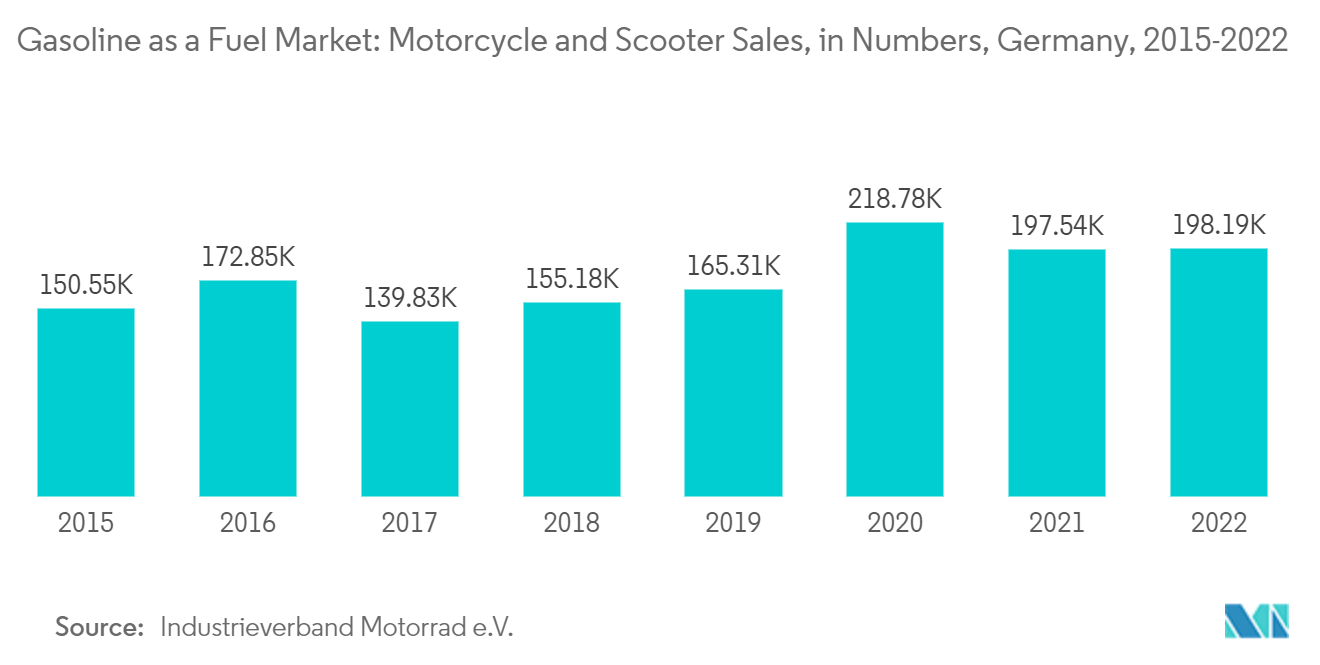
- Further, Europe also witnessed significant growth in automobile sales. According to Industrieverband Motorrad e.V., there was a total of 198,193 new registrations for motorcycles and scooters in Germany in 2022, with a growth rate of 0.33% from the previous year.
- Hence, demand for gasoline as a fuel is expected to increase in the transportation segment across the globe over the forecast period.
North America to Dominate the Market
- North America is one of the largest markets in terms of capital expenditure in the oil and gas industry, with the United States being the leader, followed by Canada and Mexico. The United States is a major crude oil and natural gas producer in the world, and the country is expected to cover around 60% of the world's oil demand in the coming years.
- The United States is one of the leading countries in the North American region, where automobile sales were around 1,42,30,324 in 2022. Among these, cruise and sports bikes are the prominent ones, as in the United States, motorcycles are mostly used for long tours and sports purposes rather than just for commute purposes.
- Over the years, the country witnessed growth in the number of bike sales, especially in the private and commercial sectors. As per the US Department of Transportation, as of 2021, the private and commercial motorcycle sales were around 9.8 million, an increase of around 18% compared to the previous year. The growth in sales of motorcycles is likely to continue in the private sector during the upcoming years, which would create demand for gasoline fuel.
- Most single-cylinder engines used in motor vehicles are fueled by gasoline. Single-cylinder engines in the United States are primarily used in water pumps and soil ramming machines. Both these pieces of equipment are majorly used in construction sites. Hence, an increase in commercial, industrial, and road infrastructure construction would create ample demand for single-cylinder engines in the United States, thus driving the growth of the gasoline as a fuel market
- Construction sector in the United States contributed around 3.9% of the total GDP in 2022. The industry grew over the years due to the expansion in the commercial and household areas. The residential sector witnessed the highest growth in recent years, followed by the non-residential. As per the Construction Association, in 2022, the United States residential sector witnessed the highest investment of around USD 910 billion, while non-residential sectors (including private and public) witnessed an investment of around USD 888 billion (USD 534 billion private, and USD 355 billion public).
- Gasoline is the dominant transportation fuel in the North America. With growing transport and construction segment in the region drives the market growth.
Regulatory Landscape
Regulation affecting gasoline demand and formulation is increasingly defined by fuel-quality specifications and renewable blending mandates. In the United States, the Environmental Protection Agency (EPA) finalized updates to gasoline and other fuel quality regulations under 40 CFR part 1090, which took effect on July 1, 2025 and reinforced compliance obligations around fuel parameters and downstream handling.
In March 2026, EPA finalized Renewable Fuel Standard (RFS) volumes for 2026 and 2027, setting nationwide renewable fuel obligations that influence gasoline blend economics and RIN management for refiners and importers. The United States also used emergency flexibility tools in 2026, with EPA issuing national temporary waivers beginning March 25, 2026 (and later extended in June and July 2026) to allow E15 sales using a common 10 psi Reid Vapor Pressure standard and to relax boutique fuel enforcement. This created short-term harmonization of specifications during fuel-supply stress. In Europe, fuel specifications continue to be anchored by the Fuel Quality Directive (Directive 98/70/EC), with amendments under Directive (EU) 2023/2413 transposed into national law, including Ireland via S.I. No. 136 of 2025 (effective May 21, 2025).
Value Chain Analysis
The gasoline value chain runs from upstream crude supply through midstream transportation and storage, refining and blending (including ethanol and additives), wholesale distribution, and retail marketing to transportation end users, with smaller demand from power generation and other applications. Key operational dependencies include refinery throughput, access to compliant blendstocks, and distribution via pipelines, marine shipping, terminals, and trucking. When disruptions occur, they can translate quickly into localized price spikes and shortages.
A recurring risk theme is exposure to global chokepoints and the resulting push for redundancy in hydrocarbon flows feeding refinery systems that produce gasoline. In July 2026, Iraq and Syria signed a cooperation agreement to reconstruct the Kirkuk-Baniyas oil pipeline, and in the same month Basra Oil awarded Houston-based KBR an advisory services contract tied to a Basra-to-Haditha pipeline concept. Both steps are aimed at reducing reliance on the Strait of Hormuz. By changing crude availability and freight patterns, bypass initiatives like these can shift refinery feedstock costs and regional gasoline supply balances downstream.
Competitive Landscape
The gasoline as a fuel market is fragmented. Some of the major key players in the market (in no particular order) include Chevron Corporation, Exxon Mobil Corporation, PetroChina Company Limited, Qatar Petroleum, and Reliance Industries Ltd., among others.
Gasoline As A Fuel Industry Leaders
-
Chevron Corporation
-
Exxon Mobil Corporation
-
PetroChina Company Limited
-
Qatar Petroleum
-
Reliance Industries Ltd
- *Disclaimer: Major Players sorted in no particular order
Market Opportunities and Future Outlook
Near-term opportunity areas center on supply rebalancing and product differentiation as refining systems and regulations evolve. New and expanded refining capacity in key importing regions can reshape gasoline trade flows and procurement strategies. In June 2026, Dangote Petroleum Refinery ramped crude processing to 700,000 bpd during a performance test, which can displace seaborne gasoline imports in West Africa and alter Atlantic Basin cargo economics. In India, Indian Oil Corporation disclosed refinery expansion projects at Panipat, Vadodara, and Barauni slated for commissioning by November to December 2026, supporting incremental domestic output and increasing the importance of distribution infrastructure and product-grade management to meet localized demand.
At the same time, mature-market refiners are adjusting yield slates, creating room for higher-value non-gasoline streams and for compliant gasoline blending strategies rather than relying on volume growth alone. Exxon Mobil started construction in January 2026 on its Baytown complex reconfiguration project to shift output away from gasoline toward diesel and lubricant base stocks, reflecting a broader emphasis on margin optimization and portfolio flexibility. Regulatory actions also create episodic demand and blending opportunities. EPA's nationwide E15 waivers beginning March 2026 (and extended into mid-2026) show how specification flexibility can quickly affect blending and retail supply decisions, benefiting players with ethanol logistics, compliant terminals, and retail execution capabilities.
Recent Industry Developments
- June 2026: Dangote Petroleum Refinery ramped crude processing to 700,000 bpd during a performance test, signaling a tangible shift in West Africa refinery capacity and affecting Atlantic Basin cargo economics. The milestone points to greater local processing and potential changes in gasoline import strategies for nearby markets.
- January 2026: Exxon Mobil began a major reconfiguration project at its Baytown, Texas complex to increase diesel and higher-value base stock output while reducing gasoline production intensity. The initiative underscores a strategy to rebalance yields toward higher-margin products in a mature refining system.
- May 2025: Ireland implemented S.I. No. 136 of 2025 transposing amendments to the EU Fuel Quality Directive, effective May 21, 2025, which tightens gasoline specification obligations in national law. The change broadens the regulatory baseline for gasoline producers and distributors operating in Ireland, influencing blend and compliance strategies.
Research Methodology Framework and Report Scope
Market Definition and Coverage
This market covers the sales value of finished gasoline used as a fuel, across end users such as road transportation, power generation, and other fuel consuming uses, measured at the point where gasoline is sold into the market.
Scope exclusions: We exclude crude oil extraction, refinery capex, and non-gasoline fuels (such as diesel, jet fuel, and LPG), even if they are sold through similar channels.
Segmentation Overview
- End-User
- Transportation
- Power Generation
- Others
- Geography
- North America
- United States
- Canada
- Rest of North America
- Europe
- Germany
- France
- United Kingdom
- Rest of Europe
- Asia-Pacific
- China
- India
- Japan
- South Korea
- Rest of Asia-Pacific
- South America
- Brazil
- Argentina
- Rest of South America
- Middle-East and Africa
- Saudi Arabia
- United Arab Emirates
- South Africa
- Rest of Middle-East and Africa
- North America
Data Sources, Market Sizing, and Validation
Desk Research
Desk work started by building a consistent demand map for gasoline fuel use by geography, and then aligning it to public time series that can be checked year after year. We leaned on official energy and fuel consumption statistics, such as the IEA, the US EIA, and country energy ministries, since they give the most repeatable view of motor gasoline demand.
We also used price and tax references and downstream context from public sources such as OECD datasets, Eurostat, and OPEC publications where relevant, and then cross-checked assumptions using company annual reports, investor presentations, and reputable press coverage on refining and retail fuel trends. In a few places, paid subscriptions for company financials and news helped speed up validation on reported downstream performance and major event timing. These desk sources are not exhaustive, and many other public and paid references were used for data collection, validation, and clarification during the work.
Primary Interviews and Surveys
Primary work was used to pressure test the desk model where public numbers can lag or differ by definition, especially around pricing behavior, blending impacts, and retail versus wholesale value capture. We spoke with downstream fuel supply and trading participants, retail fuel channel experts, and large fuel buyers, and then used their inputs to confirm regional demand direction and the reasonableness of implied price paths across the forecast window.
Distribution of primary research fieldwork respondents
| Company type | Respondent position | Region |
|---|---|---|
| Top tier: 37% | CXOs: 16% | APAC: 40% |
| Mid tier: 47% | Functional/Unit leaders: 29% | EMEA: 33% |
| Smaller Players: 16% | Managers: 55% | Americas: 27% |
Market-Sizing & Forecasting
The model is built by reconstructing gasoline fuel demand using consumption and product supplied indicators, which are then valued using average price series that reflect how gasoline is actually sold in each region. Once the demand pool is formed, it is rolled up to the global total, and only then are the results checked against selective bottom-up approximations like sampled retail and wholesale price points times implied volumes and channel checks.
To keep the math tied to real market behavior, we used a short list of practical inputs, such as motor gasoline consumption trends, vehicle parc and vehicle miles traveled directionality, refinery utilization and gasoline yield shifts, ethanol and oxygenate blending impacts on finished gasoline volumes, and crude and product crack spread direction as a guardrail for price movement. Forecasting was run using scenario analysis supported by simple time-series smoothing, because the market is heavily shaped by macro demand cycles and policy signals, and primary inputs helped us decide which scenarios were most realistic. Where bottom-up signals were thin for a country, gaps were handled through regional proxies that were later rechecked with interview feedback before being kept in the final total.
Data Validation & Update Cycle
Outputs were checked in layers so that big jumps are questioned before they reach the final dataset. We compared modeled totals against independent signals such as public gasoline demand series, regional pricing references, and the implied per vehicle consumption pattern, and then investigated variances that did not match known events like policy shifts or supply disruptions.
Before sign-off, another analyst reviews the build, the assumptions, and the arithmetic so the model can be repeated with the same inputs. The report is refreshed annually, and interim updates are made when a material event changes demand, supply, or pricing direction. Just before delivery, a final pass is done to reflect the most recent public statistics and the latest validated assumptions.
Mordor Intelligence's Gasoline As A Fuel Market Size Measured Against Other Published Estimates
Published market values for gasoline fuel can look far apart because teams choose different value points in the chain, mix different fuel products under one label, or use different price series and currency timing. Differences also come from whether the number is built from consumption first or from revenue reporting first, which changes what gets counted when channels overlap.
The benchmark table shows a tighter spread when the value is anchored to finished gasoline sold for fuel use by end users, and then cross-checked against consumption signals and realistic regional price paths, and in Mordor Intelligence's model this means adjacent downstream categories like broader refined products, refinery services, and non-gasoline transport fuels are kept out of the total even if they are discussed in the same industry context.
Benchmark comparison
| Source | Market Size | Gaps in Research Methodology |
|---|---|---|
| Mordor Intelligence | USD 1.89 T (2026) | |
| Trade Journal A | USD 1.46 T (2024) | This figure appears to be reported on a different base year and can reflect conservative value capture tied closer to wholesale or ex-tax pricing, which lowers the total even if volumes are similar. |
| Industry Report B | USD 2.07 T (2025) | This estimate uses a higher starting value and can reflect broader scope choices such as bundling gasoline with wider fuel definitions or using a price path that lifts average realized values across regions. |
Taken together, the spread is mainly explained by year selection, where the value is captured (wholesale versus retail), and whether the scope stays strictly on finished gasoline used as fuel. Our approach keeps the model traceable to demand indicators and simple price logic, so the total can be rebuilt and checked as new public data arrives.
Key Questions Answered in the Report
How big is the Gasoline As A Fuel Market?
The Gasoline As A Fuel Market size is expected to reach USD 1.89 trillion in 2026 and grow at a CAGR of 0.98% to reach USD 1.98 trillion by 2031.
What is the current Gasoline As A Fuel Market size?
In 2026, the Gasoline As A Fuel Market size is expected to reach USD 1.89 trillion.
Who are the key players in Gasoline As A Fuel Market?
Chevron Corporation, Exxon Mobil Corporation, PetroChina Company Limited, Qatar Petroleum and Reliance Industries Ltd are the major companies operating in the Gasoline As A Fuel Market.
Which is the fastest growing region in Gasoline As A Fuel Market?
Asia Pacific is estimated to grow at the highest CAGR over the forecast period (2026-2031).
Which region has the biggest share in Gasoline As A Fuel Market?
In 2025, the North America accounts for the largest market share in Gasoline As A Fuel Market.
What years does this Gasoline As A Fuel Market cover, and what was the market size in 2025?
In 2025, the Gasoline As A Fuel Market size was estimated at USD 1.89 trillion. The report covers the Gasoline As A Fuel Market historical market size for years: 2019, 2020, 2021, 2022, 2023 and 2024. The report also forecasts the Gasoline As A Fuel Market size for years: 2026, 2027, 2028, 2029, 2030 and 2031.