Gaskets And Seals Market Size and Share
Market Overview
| Study Period | 2021 - 2031 |
|---|---|
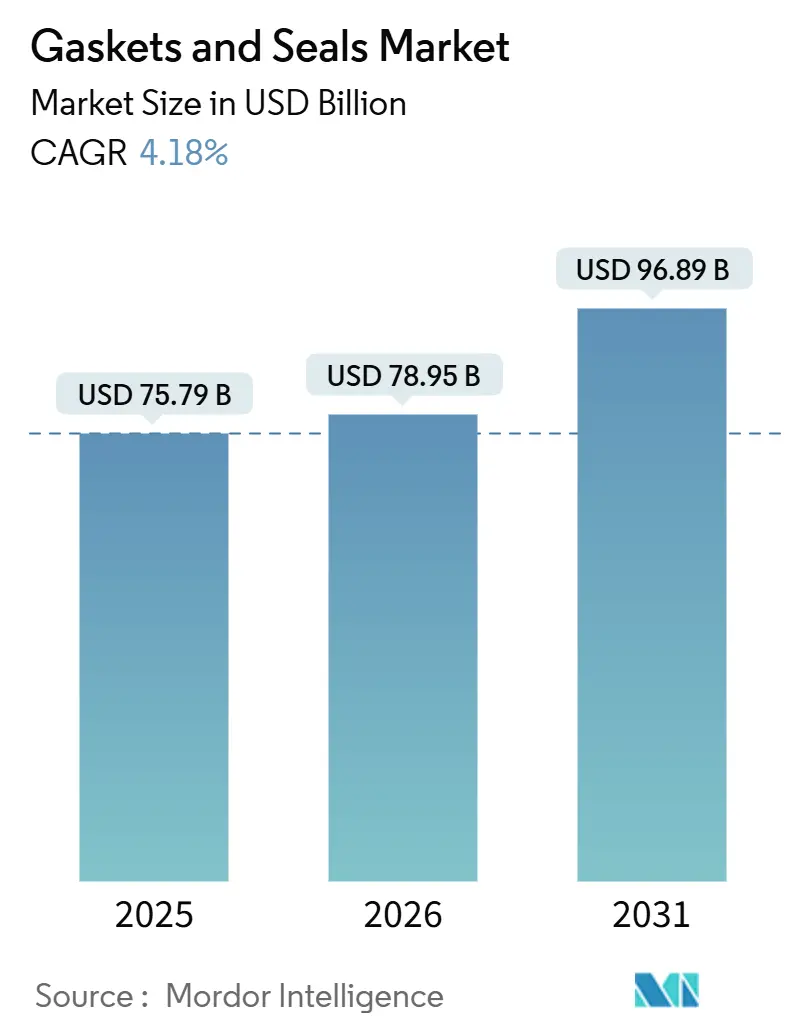
| Market Size (2026) | USD 78.95 Billion |
| Market Size (2031) | USD 96.89 Billion |
| Growth Rate (2026 - 2031) | 4.18% CAGR |
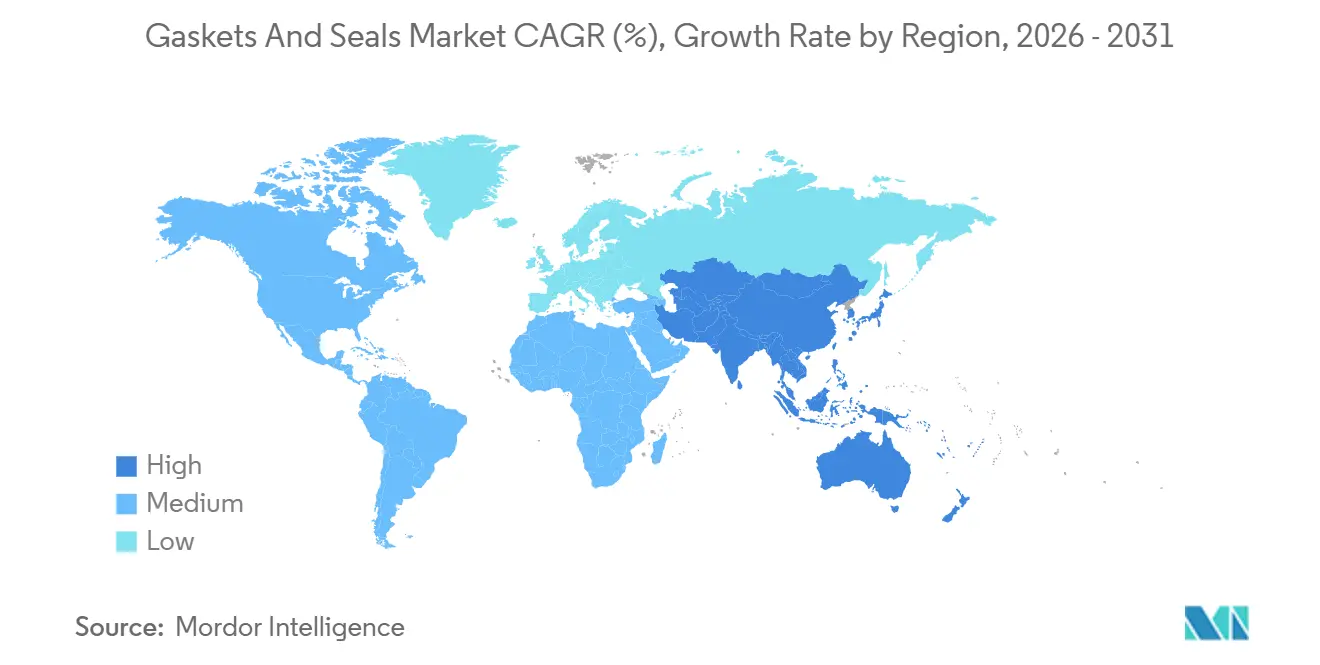
| Fastest Growing Market | Asia Pacific |
| Largest Market | Asia Pacific |
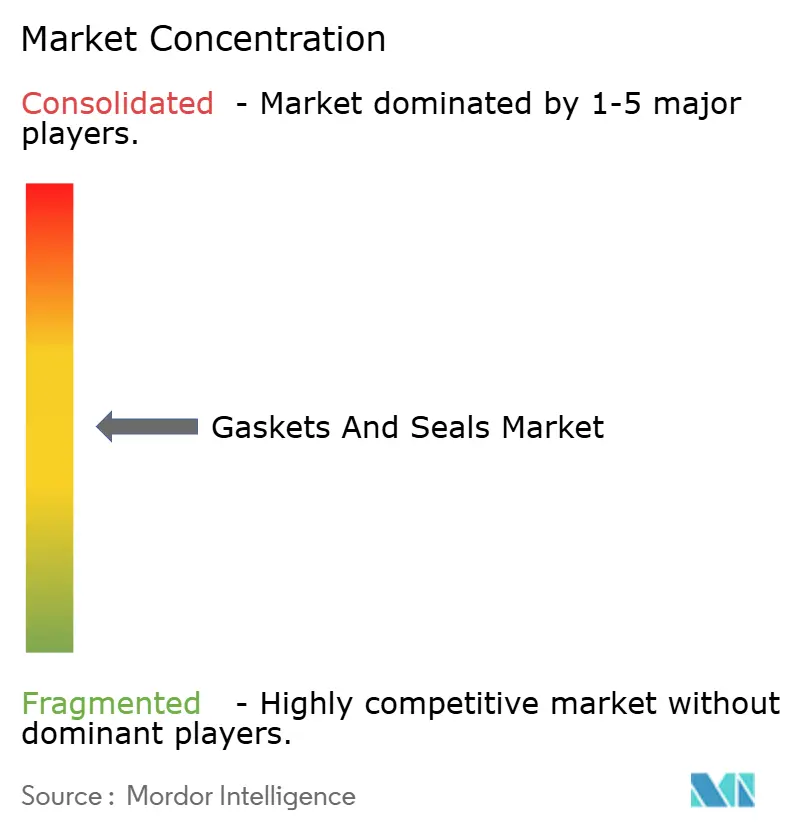
| Market Concentration | Medium |
Major Players *Disclaimer: Major Players sorted in no particular order Image © Mordor Intelligence. Reuse requires attribution under CC BY 4.0. | |
Gaskets And Seals Market Analysis by Mordor Intelligence
The Gaskets And Seals Market size is projected to be USD 75.79 billion in 2025, USD 78.95 billion in 2026, and reach USD 96.89 billion by 2031, growing at a CAGR of 4.18% from 2026 to 2031. Heightened maintenance activity across liquefied-natural-gas (LNG) facilities, accelerating electric-vehicle (EV) production, and emerging hydrogen-pipeline retrofits are reshaping material preferences and design requirements. Asia-Pacific, anchored by China’s new-energy-vehicle build-out, leads revenue generation, while North America benefits from wind-turbine repowering programs and hydrogen pilot lines. Metallic spiral-wound gaskets remain essential in LNG and petrochemical turnarounds, yet rubber and PTFE compounds gain ground as automakers specify high-temperature, low-permeation seals for battery enclosures. Vertical integration into fluoro-rubber compounding and the roll-out of sensor-enabled “smart” gaskets illustrate how suppliers defend margins and differentiate offerings. Compliance with ISO 23936 for hydrogen service and SAE J3277 for battery safety is turning regulatory mandates into predictable replacement cycles.
Key Report Takeaways
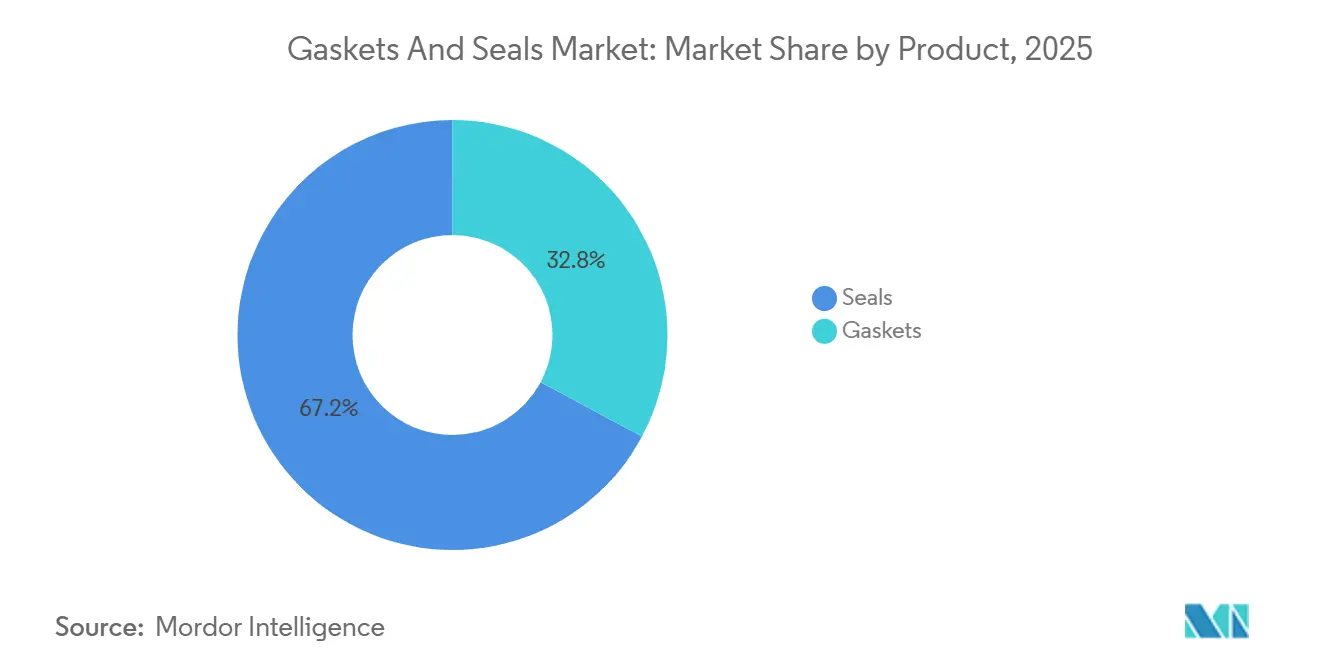
- By product, seals led with 67.18% revenue in 2025 and are advancing at a 5.54% CAGR through 2031 while gaskets record slower growth at 3.1%.
- By material, metals commanded 35.45% of the gasket and seals market share in 2025, whereas rubber is forecast to expand at 6.12% CAGR owing to new fluoro-silicone and perfluoroelastomer grades.
- By sales channel, OEM shipments represented 65.12% of 2025 turnover, but aftermarket purchases will rise at a 4.91% pace as petrochemical operators extend asset life cycles.
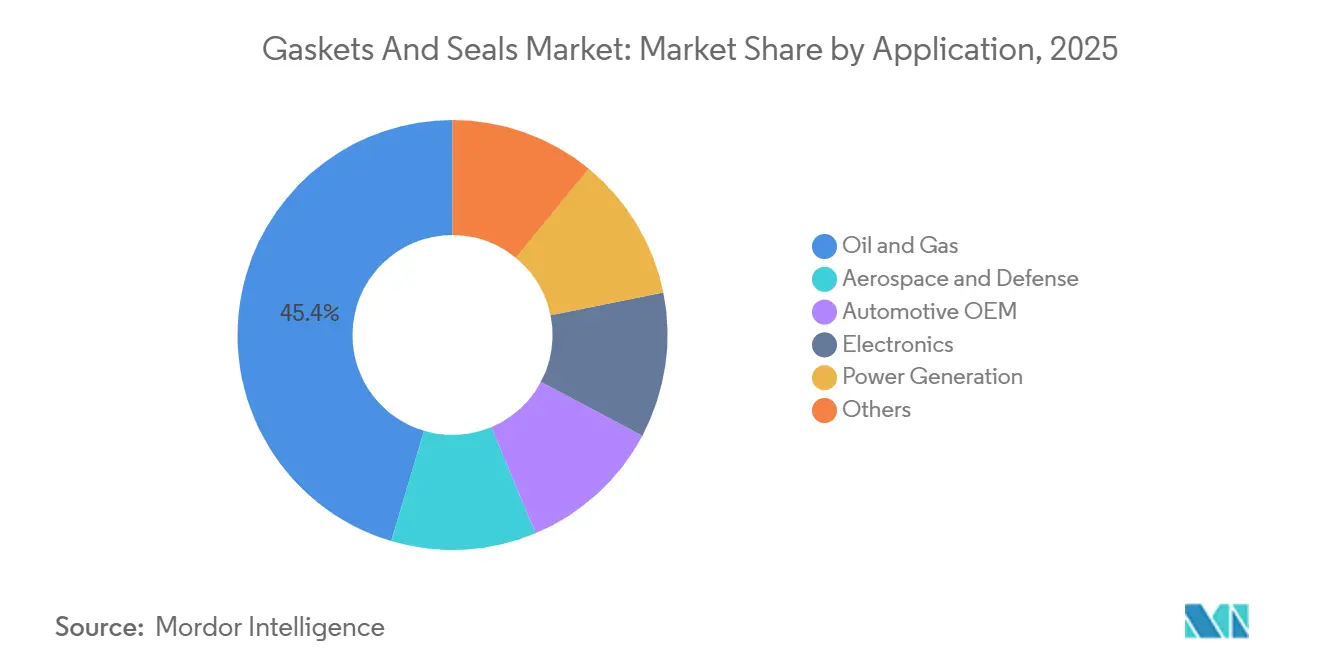
- By application, oil and gas held 45.39% of 2025 value; electrification pushes automotive OEM demand to the fastest 6.8% CAGR to 2031.
- By geography, Asia-Pacific generated 47.76% of 2025 revenue and is set to climb at 6.31% CAGR, the quickest among all regions.
Note: Market size and forecast figures in this report are generated using Mordor Intelligence’s proprietary estimation framework, updated with the latest available data and insights as of January 2026.
Global Gaskets And Seals Market Trends and Insights
Driver Impact Analysis
| Drivers | (~) % Impact on CAGR Forecast | Geographic Relevance | Impact Timeline |
|---|---|---|---|
| Expansion of LNG mid-stream and downstream maintenance cycles | +0.8% | Middle East, Asia-Pacific, North America | Medium term (2-4 years) |
| Surging chemical and petrochemical plant refurbishments | +0.7% | Asia-Pacific, Middle East and Africa | Medium term (2-4 years) |
| Automotive electrification boosting e-power-train sealing | +1.2% | China, Europe, North America | Short term (≤ 2 years) |
| Sensor-enabled “smart” gaskets enabling predictive maintenance | +0.5% | North America, Europe | Long term (≥ 4 years) |
| Hydrogen-ready pipeline retrofits demanding novel metallic gaskets | +0.6% | North America, Europe, Japan, South Korea | Long term (≥ 4 years) |
| Source: Mordor Intelligence | |||
Expansion of LNG Mid-Stream and Downstream Maintenance Cycles
Turnarounds now scheduled for LNG complexes commissioned between 2015 and 2020 are triggering large-scale gasket replacement programs. For example, Shell’s Pearl gas-to-liquids plant removed and reinstalled about 14,000 flange gaskets during its 2024 outage. U.S. regulations under 49 CFR Part 193 require gasket inspection every 36–60 months, locking in a recurring market for ASME B16.20 Class 2500 spiral-wound units. Cryogenic liquefaction trains favor graphite-filled metallic gaskets to survive –162 °C cycles, whereas ambient regasification terminals select shore-A 70–90 rubber variants to handle thermal expansion. With 40 million tpa of new LNG export nameplate added in 2024, demand correlates more with plant count than throughput, cushioning revenues from commodity-price swings.
Surging Chemical and Petrochemical Plant Refurbishments
Deferred maintenance during 2020–2022 has created a backlog now being cleared, notably in Saudi Aramco’s Jazan complex, where ethylene crackers underwent complete re-gasketing in 2024. Asia-Pacific capacity additions funded by India’s USD 6 billion Production-Linked Incentive scheme each consume 5,000–8,000 gaskets at start-up, with 10–15% yearly replacements thereafter. European steam-cracker retrofits, driven by stricter emissions limits, switch compressed-fiber gaskets to PTFE and flexible graphite to achieve sub-500 ppm leak thresholds. This refurbishment wave supports steady aftermarket volumes across high-pressure and high-temperature services.
Automotive Electrification Boosting E-Power-Train Sealing
Battery-electric vehicles require immersion-tested seals that survive IP67 and IP69K spray conditions mandated by SAE J3277 and GB 38031-2025. BYD’s 3 million NEVs built in 2024 each integrate 12–18 m of extruded EPDM or silicone profiles around battery trays and inverter housings. E-axle shaft temperatures of 150 °C necessitate low-friction fluoro-elastomer lip seals, while premium models embed encoders for condition monitoring. Adhesive bonding, such as Ford’s urethane technology, removes the perimeter gasket but still leaves multiple dynamic sealing points across coolant loops and drive units. As EV output crosses 10 million units a year, specification creep toward higher thermal and chemical resistance increases unit value per vehicle.
Hydrogen-Ready Pipeline Retrofits Demanding Novel Metallic Gaskets
Converting natural-gas lines requires metallic gaskets with hydrogen permeation below 1 × 10⁻⁸ cm³/(s·cm²·Pa) per ASME B31.12. The European Hydrogen Backbone project will upgrade 11,600 km of pipe by 2030, calling for 50,000–70,000 compatible flanges. The U.S. Hydrogen Shot aligns with the same goal, with pilot sites in the Gulf Coast and California testing Inconel 625 lens-ring designs[1]U.S. Department of Energy, “Hydrogen Shot Fact Sheet 2025,” Energy.gov. Japan’s USD 3.4 billion budget backs spiral-wound prototypes treated with corrosion inhibitors to mitigate hydrogen-induced cracking. Retrofits concentrate in North America and Europe, regions accounting for 75% of announced conversions.
Restraint Impact Analysis
| Restraints | (~) % Impact on CAGR Forecast | Geographic Relevance | Impact Timeline |
|---|---|---|---|
| Raw-material price volatility in elastomers and fluoro-rubbers | -0.6% | Global, acute in Asia-Pacific and Europe | Short term (≤ 2 years) |
| Adhesive bonding replacing gaskets in EV battery packs | -0.4% | China, North America, Europe | Medium term (2-4 years) |
| Prolonged vendor-qualification cycles | -0.3% | North America, Europe | Long term (≥ 4 years) |
| Source: Mordor Intelligence | |||
Raw-Material Price Volatility in Elastomers and Fluoro-Rubbers
Natural rubber prices jumped 15–20% in 2024 after supply disruptions in Thailand and Indonesia. Fluoro-elastomer costs climbed further as China curtailed fluorspar exports, squeezing hydrofluoric-acid feedstock. Lead times for EPDM and nitrile compounds extended to 10–14 weeks by mid-2025, straining cash flow for small gasket fabricators. Some end-users switched to PTFE-envelope gaskets to sidestep elastomer spikes, despite higher upfront prices. Vertical integration moves, such as Freudenberg’s 2025 acquisition of a German FKM compounder, seek to blunt this volatility.
Adhesive Bonding Replacing Gaskets in EV Battery Packs
Structural adhesives now seal 20–25% of global passenger-EV battery covers, a share forecast to exceed 40% by 2030. Ford’s UV-curable urethane cuts assembly time by 30 seconds per pack and removes a compression gasket from the bill of materials. Tesla’s 4680 structural pack uses adhesive joints that also contribute to crash-energy absorption, making conventional perimeter gaskets redundant. Commercial-vehicle platforms still prefer bolted covers for serviceability, retaining gasket demand in that sub-segment. As lightweighting and throughput remain paramount, adhesive encroachment will trim a gasket application that represented about 8–10% of automotive sealing revenue in 2023.
Segment Analysis
By Product: Seals Dominate Across Dynamic Applications
Seals generated 67.18% of 2025 revenue, and are projected to grow at 5.54% through 2031. Shaft seals thrive on the expanding installed base of wind turbines, each turbine containing 15–25 units that need replacement every 5–7 years[2]Global Wind Energy Council, “Global Wind Report 2025,” Gwec.net. Molded seals enjoy uptake in battery-electric vehicles, where stringent ingress-protection drives higher-grade EPDM and silicone profiles. Traditional gaskets grow more slowly because static joints are tied to turnarounds rather than new-equipment shipments.
Metallic spiral-wound designs still dominate high-pressure LNG and refinery joints, but cork and non-asbestos variants linger in legacy HVAC and low-pressure oil-pan assemblies. Sensor-enabled smart gaskets, although under 2% of installed units, signal a shift toward value-added static sealing products. The product mix, therefore, skews progressively toward dynamic seals as electrification and wind-power capacity accelerate, raising replacement frequency and average selling price within the gasket and seals market.
By Material: Rubber Gains on Electrification and Hydrogen Uptake
Metallic materials accounted for 35.45% of 2025 revenue, yet rubber compounds will post the fastest 6.12% CAGR, lifting their contribution to the gasket and seals market share. Fluoro-silicone blends tolerate 200 °C exhaust gas and resist coolants in hybrid drivetrains, widening their automotive footprint. Perfluoroelastomers, despite prices of USD 500–1,000 per kg, dominate semiconductor wet benches where a single hour of downtime exceeds USD 10,000 in lost wafers.
PTFE and expanded-PTFE secure mid-teen percentages of the gasket and seals market size by providing near-universal chemical resistance up to 260 °C. Flexible-graphite sheets remain indispensable in steam turbines that run at 650 °C, especially as utilities repower combined-cycle plants. The research spotlight now falls on hydrogen-compatible rubbers engineered to resist rapid-gas-decompression damage, a potential USD 500–700 million incremental opportunity before 2030.
By Sales Channel: Aftermarket Momentum Rises with Asset Life Extensions
OEM shipments accounted for 65.12% of 2025 revenue, yet aftermarket and maintenance-repair-operation orders will expand at a 4.91% CAGR, slightly eclipsing overall gasket and seals market growth. Petrochemical complexes built in the late 1990s are reaching 30 years of service, prompting major gasket replacement every four to five years. Fugitive-emission rules in the European Union and California are driving compliance-driven swap-outs of graphite and PTFE gaskets, independent of plant age.
Distributors such as Applied Industrial Technologies stock more than 10,000 SKUs for rapid fulfillment, commanding 20–40% price premiums over factory-direct OEM sales. E-commerce challenges these margins for commodity O-rings but cannot yet replicate technical support for complex geometries. As equipment run-times intensify, the aftermarket channel’s share of the gasket and seals market size will converge toward parity with OEM demand.
By Application: Oil and Gas Remains the Anchor Amid Transition
Oil and gas applications held 45.39% of 2025 revenue and will post a 5.67% CAGR, underpinned by subsea developments requiring metal-to-metal seals rated to API 6A pressures above 15,000 psi. Each FPSO carries 8,000–12,000 gaskets, refreshed during periodic shutdowns. Hydrogen-sulfide-laden sour-gas lines specify NACE MR0175-compliant gaskets, pushing demand for high-nickel alloys.
Automotive OEM applications, though now smaller in dollars, will grow fastest at 6.8% as EV output scales. Power generation contributes a mid-teens share through combined-cycle turbine builds and offshore wind fleets, while aerospace maintains stringent qualification barriers that lock in incumbent suppliers. Semiconductor tools, tiny in volume yet rich in value, rely on FFKM O-rings priced 10–20 times above nitrile counterparts, safeguarding profitability within the gasket and seals market.
Note: Segment shares of all individual segments available upon report purchase
Geography Analysis
Asia-Pacific contributed 47.76% of 2025 revenue and will post a brisk 6.31% CAGR through 2031. China’s 9.5 million NEVs built in 2024 underpin large-volume seal demand, and BYD’s local sourcing compresses costs and lead times. India’s USD 6 billion incentive plan for electronics and automotive plants multiplies gasket use in cleanroom HVAC ducts and cooling loops. Japan and South Korea continue to export high-precision PTFE and non-asbestos sheets, while ASEAN nations lure diversified production that needs localized sealing solutions.
North America accounted for a significant market share in 2025. The United States added 15 GW of wind capacity in 2024, and each turbine’s gearbox seals face five-year change-out schedules. Hydrogen pilot pipelines along the Gulf Coast require ASME B31.12-compliant Inconel ring-joints, lifting specialty-metallic demand. Canada’s 3 million bpd oil-sands throughput calls for high-temperature SAGD well seals, and Mexico’s export-oriented vehicle builds anchor OEM shipments, albeit with fewer parts per EV.
Europe captured a high-teens slice, with growth constrained by mature auto output. Yet the 11,600 km hydrogen backbone conversion program will install up to 70,000 hydrogen-ready gaskets. Offshore wind in the United Kingdom surpasses 14 GW, catalyzing MRO seal replacements at mid-life. Nordic district-heating grids pilot sensor-enabled gaskets, although penetration remains under 5%.
South America and the Middle East and Africa combined for a low-teens portion in 2025. Saudi Aramco’s Jazan complex and Nigeria’s Dangote refinery both initiated gasket-intensive turnarounds after commissioning. Brazilian pre-salt fields, alongside UAE petrochemical upgrades, supply recurring aftermarket demand, stabilizing regional revenues despite commodity price swings.
Competitive Landscape
The gaskets and seals market is moderately consolidated. Investments target engineered solutions: Henkel’s LOCTITE Pulse wireless system outfits spiral-wound gaskets with bolt-load sensors, while Parker Hannifin expanded Indian capacity to serve EV and renewable-energy customers. Patent filings reveal a technology arms race. Ford’s structural adhesive eliminates cover gaskets in EV packs, hinting at application displacement, whereas Additive-manufacturing startups print custom gasket geometries within 48 hours, trimming tooling costs for short runs. Certification like ISO 9001, IATF 16949, and AS9100 remains a price premium lever, especially for aerospace and automotive buyers. Consolidation is expected as electrification, hydrogen adoption, and predictive-maintenance functions raise research and development thresholds that favor scale operators.
Gaskets And Seals Industry Leaders
Freudenberg Sealing Technologies
Trelleborg AB
SKF
Dana Limited
Flowserve Corporation
- *Disclaimer: Major Players sorted in no particular order
Recent Industry Developments
- January 2026: Flowserve won a USD 60 million contract to supply API 682 mechanical seals for a new LNG liquefaction project in Texas, with deliveries slated for Q4 2026 .
- October 2025: Parker Hannifin committed USD 120 million to expand its Pune, India, sealing plant, adding automated elastomer-molding lines and an application-engineering center.
- September 2025: Freudenberg Sealing Technologies bought a German FKM compounder, integrating 2,000 tons per annum of high-performance fluoro-elastomer capacity.
Research Methodology Framework and Report Scope
Market Definitions and Key Coverage
Our study, according to Mordor Intelligence, treats the global gaskets and seals market as the annual value of newly manufactured static gaskets and dynamic seals, metallic, semi-metallic, non-metallic and elastomeric, that prevent fluid or gas leakage in industrial machinery, vehicles, energy equipment and process piping. We include sales through both OEM and aftermarket channels, priced at factory gate levels, and track values in USD before freight or tax additions.
(Scope exclusion: rebuilt, reused or re-conditioned sealing products and adhesive-only sealants are not counted.)
Segmentation Overview
- By Product
- Gaskets
- Metallic Gasket
- Rubber Gasket
- Cork Gasket
- Non-asbestos Gasket
- Spiral Wound Gasket
- Other Gaskets (Semi-Metallic Gasket)
- Seals
- Shaft Seals
- Molded Seals
- Motor Vehicle Body Seals
- Other Seals (Fork Seal and Piston Seal)
- Gaskets
- By Material
- Fiber
- Graphite and Flexible Graphite
- PTFE
- Rubbers
- Others
- By Sales Channel
- OEM
- After-market / MRO
- By Application
- Aerospace and Defense
- Automotive OEM
- Electronics
- Oil and Gas
- Power Generation
- Others
- Geography
- Asia-Pacific
- China
- India
- Japan
- South Korea
- ASEAN
- Rest of Asia-Pacific
- North America
- United States
- Canada
- Mexico
- Europe
- Germany
- United Kingdom
- France
- Italy
- Nordics
- Rest of Europe
- South America
- Brazil
- Argentina
- Chile
- Rest of South America
- Middle-East and Africa
- Saudi Arabia
- South Africa
- Nigeria
- Egypt
- Rest of Middle-East and Africa
- Asia-Pacific
Detailed Research Methodology and Data Validation
Primary Research
Mordor analysts interviewed plant maintenance managers, gasket-metal stockists, automotive Tier-1 sourcing heads and regional distributors across Asia-Pacific, North America and Europe. The dialogues clarified failure rates, OEM-aftermarket price spreads and emerging material preferences, which we then used to challenge desk findings and refine elasticities.
Desk Research
We first map the demand universe using freely available tier-1 references such as UN Comtrade shipment codes, the U.S. Energy Information Administration's refinery turnaround logs, the International Organization of Motor Vehicle Manufacturers production tables and trade-association bulletins from the Fluid Sealing Association. Company 10-Ks, public tender archives and patent families (via Questel) help us size technology shifts and average selling prices. In parallel, Dow Jones Factiva feeds us with deal flow and expansion news that flag capacity additions.
Those sources anchor historical totals; however, they are rarely granular enough for end-use splits, so we treat them as guardrails rather than hard inputs. The list above is illustrative, and many other open texts, customs dockets and statistical yearbooks were consulted for cross-checks.
Market-Sizing & Forecasting
We open with a top-down reconstruction. Global pump, compressor and engine shipments, crude-steel flange output and vehicle builds establish the maximum demand pool, which is then filtered through installation factors and replacement cycles to derive gasket/seal unit volumes. Select bottom-up roll-ups of leading supplier revenues and sampled ASP × volume checks calibrate the totals. Key variables like refinery utilization, light-vehicle production, offshore rig count, synthetic rubber output and average stainless-steel prices drive our multivariate regression forecast. Scenario analysis around EV adoption and green-hydrogen project slippage frames upside and downside bands. Gap pockets in supplier disclosures are bridged with normalized margins from D&B Hoovers.
Data Validation & Update Cycle
Models undergo variance scans against independent indicators every quarter; anomalies trigger a re-interview loop before sign-off. Reports refresh annually, with interim patches for material events, ensuring users receive the latest vetted view.
Why Mordor's Gaskets And Seals Baseline Commands Confidence
Published figures often diverge because firms pick different scope lines, conversion rates and refresh cadences. We acknowledge those realities up front and then show, line by line, how carefully selected variables and yearly model tuning keep our baseline steady yet responsive.
Key divergences arise when others exclude aftermarket revenue, apply aggressive OEM price erosion or freeze currency at survey-year averages, while Mordor updates exchange rates, captures both channels and folds verified ASP progression into every cycle.
Benchmark comparison
| Market Size | Anonymized source | Primary gap driver |
|---|---|---|
| USD 75.83 B (2025) | Mordor Intelligence | - |
| USD 65.60 B (2025) | Global Consultancy A | Omits retrofit demand; static ASP assumption |
| USD 69.88 B (2024) | Trade Journal B | Uses 2022 exchange rates; excludes spiral-wound sub-segment |
| USD 66.93 B (2025) | Industry Analytics C | Counts only OEM sales; limited country coverage |
The comparison shows that once aftermarket volumes, latest currency adjustments and full material mixes are applied, Mordor's estimate provides a balanced, transparent baseline that decision-makers can replicate and stress-test with confidence.
Key Questions Answered in the Report
How large is the gasket and seals market in 2026 and how fast will it grow?
The gasket and seals market size is estimated at USD 78.95 billion in 2026 and is projected to reach USD 96.89 billion by 2031 at a 4.18% CAGR.
Which region contributes the most revenue?
Asia-Pacific generates 47.76% of global revenue and is expanding at a 6.31% CAGR thanks to strong automotive, electronics, and infrastructure demand.
Which product category leads the market?
Seals command 67.18% of revenue in 2025 and grow faster than gaskets because dynamic equipment such as EV drivetrains and wind-turbine gearboxes require frequent replacements.
Why are hydrogen-pipeline retrofits important for suppliers?
Hydrogen conversions need metallic gaskets that resist permeation and embrittlement, creating a specialty niche projected to add up to USD 700 million in new demand before 2030.
How are suppliers managing raw-material price swings?
Leading vendors are integrating backward into fluoro-rubber compounding, locking long-term supply contracts, and passing surcharges to OEM and aftermarket buyers to maintain margins.
What impact will adhesive bonding have on gasket demand in EVs?
Structural adhesives already seal about one-quarter of passenger-EV battery covers and could exceed 40% penetration by 2030, reducing perimeter-gasket revenue but not affecting dynamic shaft, coolant, and thermal-interface seals.


