
Gas Insulated Substation Market Size and Share
Market Overview
| Study Period | 2021 - 2031 |
|---|---|
| Market Size (2026) | USD 37.51 Billion |
| Market Size (2031) | USD 55.55 Billion |
| Growth Rate (2026 - 2031) | 8.17 % |
| Fastest Growing Market | Asia Pacific |
| Largest Market | Asia Pacific |
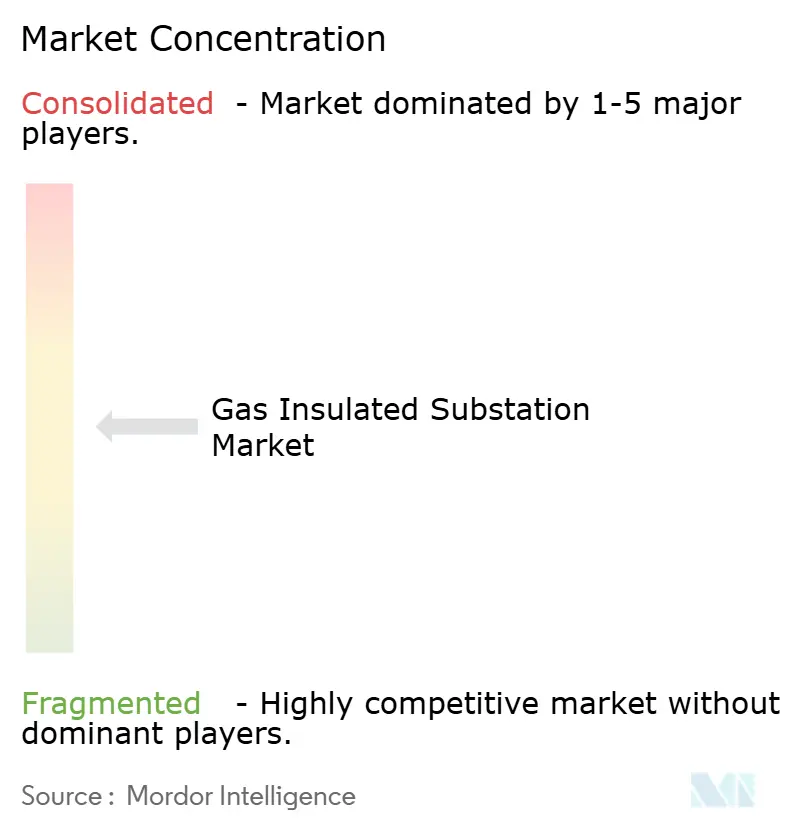
| Market Concentration | Medium |
Major Players *Disclaimer: Major Players sorted in no particular order Image © Mordor Intelligence. Reuse requires attribution under CC BY 4.0. | |
Gas Insulated Substation Market Analysis by Mordor Intelligence
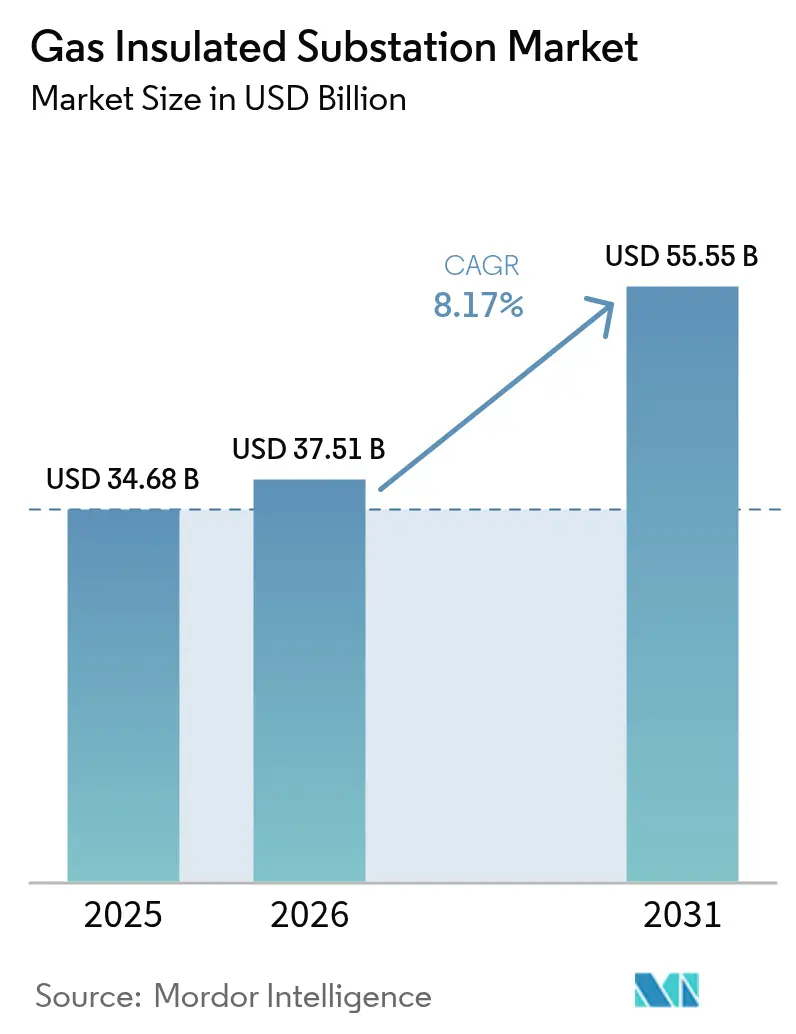
The Gas Insulated Substation Market size was valued at USD 34.68 billion in 2025 and estimated to grow from USD 37.51 billion in 2026 to reach USD 55.55 billion by 2031, at a CAGR of 8.17% during the forecast period (2026-2031).
Accelerating urbanization, large-scale renewable integration, and widespread replacement of aging air-insulated assets keep demand on an upward curve, while utilities elevate GIS adoption to balance compact footprints with heightened reliability requirements. Regulatory deadlines that phase out SF₆ in California by 2033 and across the European Union in 2030-2032 are reshaping technology choices, creating both disruption and new commercial openings. The Asia-Pacific region retains its position as the largest demand center, supported by a record USD 89 billion in grid spending by China’s State Grid Corporation in 2024. High Voltage (72.5–245 kV) systems account for just over half of global installations, yet the Extra-High-Voltage class above 300 kV is expanding faster as transmission operators build long-distance corridors for variable renewable power. At the same time, the share of mobile and skid-mounted units is rising because utilities need equipment that can be assembled off-site and energized within days for disaster recovery and planned maintenance scenarios
Key Report Takeaways
- By voltage, High-Voltage systems led with 51.90% share of the Gas Insulated Substation market size in 2025; Extra-High-Voltage applications are projected to expand at a 10.15% CAGR through 2031.
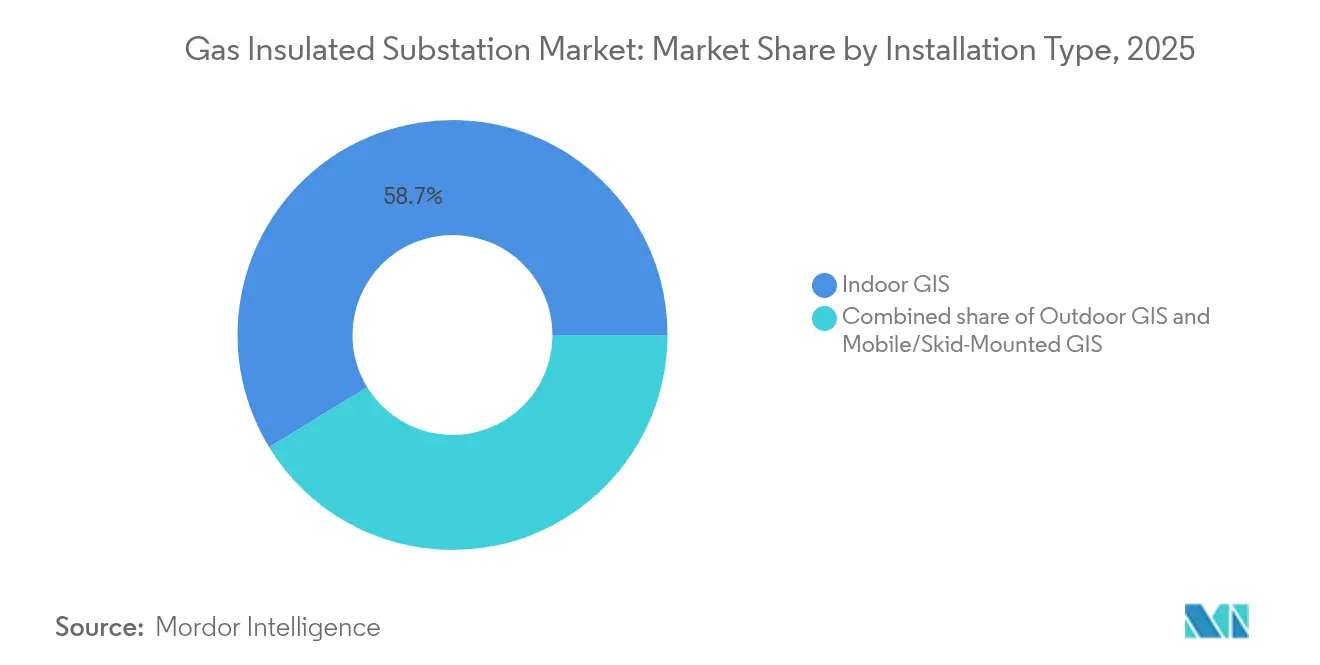
- By installation type, Indoor GIS dominated with a 58.74% share in 2025; Mobile and skid-mounted systems are forecast to grow at an 11.02% CAGR through 2031.
- By technology, SF₆-based switchgear retained 85.10% share in 2025; SF₆-free alternatives are advancing at a 18.65% CAGR to 2031.
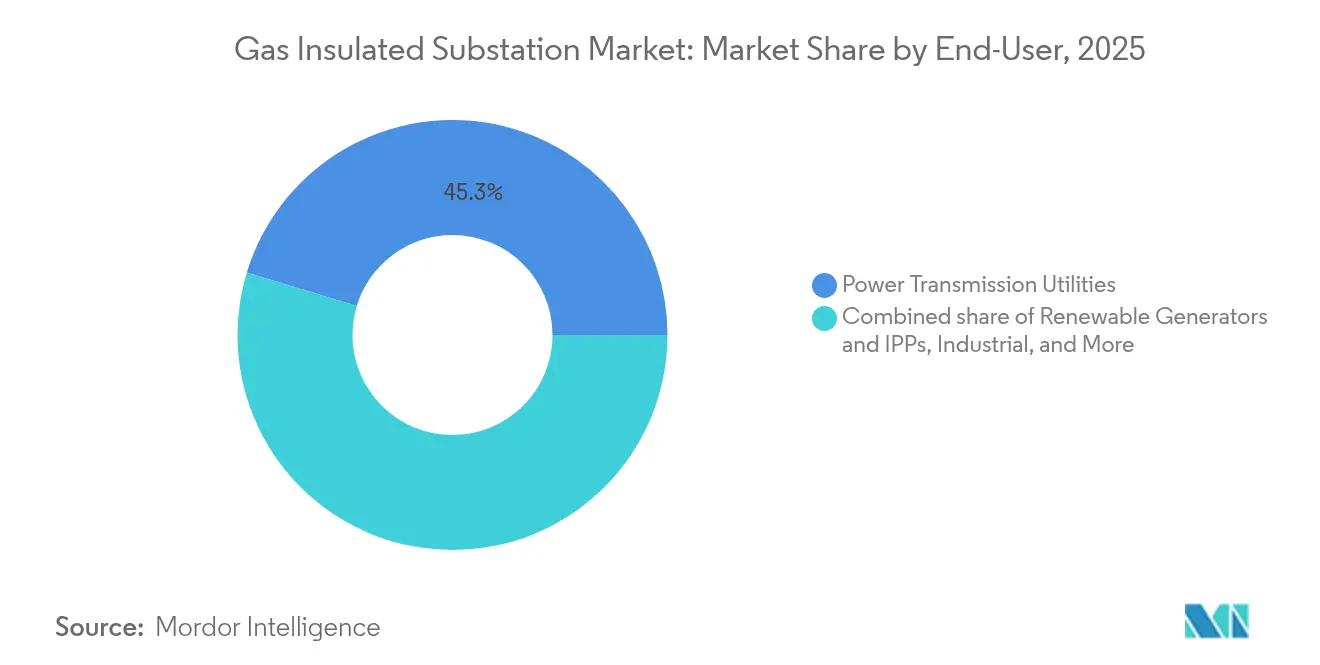
- By end-user, Power Transmission Utilities commanded a 45.30% share in 2025; Renewable Generators and Independent Power Producers are poised to grow at a 12.14% CAGR to 2031.
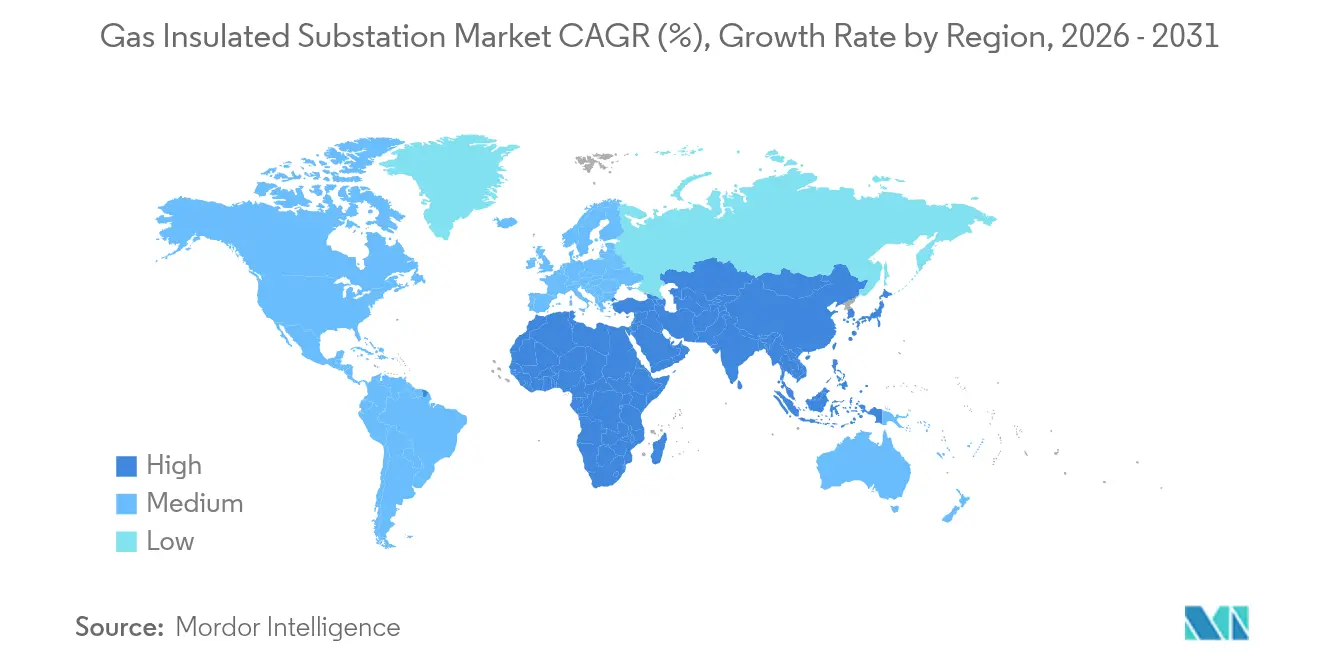
- By geography, the Asia-Pacific region accounted for 46.70% of the gas-insulated substation market share in 2025; it is anticipated to rise at a 9.47% CAGR through 2031.
Note: Market size and forecast figures in this report are generated using Mordor Intelligence’s proprietary estimation framework, updated with the latest available data and insights as of 2026.
Market Trends and Insights
Drivers Impact Analysis of Gas Insulated Substation Market*
| Driver | (~) % Impact on CAGR Forecast | Geographic Relevance | Impact Timeline |
|---|---|---|---|
| Urban land-use constraints propel compact GIS adoption | 2.20% | Global, concentrated in Asian megacities and European capitals | Medium term (2-4 years) |
| Renewable integration demands reliable HV infrastructure | 1.80% | North America, EU offshore wind hubs, APAC solar belts | Long term (≥ 4 years) |
| Modernization of aging AIS fleets in OECD countries | 2.10% | North America and EU, spillover into developed APAC | Long term (≥ 4 years) |
| Grid-upgrade programs in APAC & North America | 1.50% | APAC core markets and U.S. transmission corridors | Medium term (2-4 years) |
| Offshore wind & floating solar electrification needs | 0.90% | North Sea, U.S. East Coast, Japan, Netherlands, Singapore | Long term (≥ 4 years) |
| Climate-resilient substation designs for disaster zones | 0.80% | Hurricane-prone U.S. Gulf, typhoon-hit APAC, global flood plains | Short term (≤ 2 years) |
| Source: Mordor Intelligence | |||
Urban Land-Use Constraints Propel Compact GIS Adoption
Dense metropolitan growth leaves utilities scrambling for real estate, and gas-insulated substation market participants respond by delivering installations that occupy roughly 60% less space than air-insulated equivalents[1]Eaton, “Technical Comparison of Gas and Air-Insulated Substations,” eaton.com. Singapore’s 230 kV underground “figure-eight” GIS, developed by SP Group, demonstrates how vertically stacked layouts preserve surface land without compromising grid capacity[2]T&D World Editors, “Singapore’s Underground Substation Breaks Ground,” tdworld.com. Similar logic drove the construction of Cambridge, Massachusetts’ fully underground substation, which supports a life-sciences campus where premium surface space was repurposed for community amenities. These projects demonstrate how the Gas Insulated Substation market aligns with emerging urban master plans that favor mixed-use zoning over large utility corridors. As real estate values climb, major Asian and European cities are increasingly stipulating compact GIS for new or replacement substations, turning space savings into a quantifiable economic benefit.
Renewable Integration Demands Reliable HV Infrastructure
Variable generation from offshore wind and utility-scale solar introduces power-flow swings that require fast-acting, high-voltage equipment for reactive compensation and fault isolation. Floating wind platforms off the Fukushima coast employ gas-insulated switchgear rated for dynamic motion and salt-spray exposure, proving GIS viability in maritime conditions.[3]DNV, “Floating Offshore Substations: State of the Art,” dnv.com Massive ground-mounted solar clusters in Louisiana integrate collector substations equipped with GIS to maintain grid code compliance during irradiance fluctuations. In parallel, the World Bank identifies 400 GWp in floating-solar potential, a figure that points toward future demand for marine-grade substations.[4]World Bank Group, “Where Sun Meets Water,” worldbank.org Collectively, these deployments reposition the Gas Insulated Substation market from a space-saving niche toward a reliability backbone for renewables-heavy grids.
Modernization of Aging AIS Fleets in OECD Countries
Air-insulated switchgear, commissioned in the 1970s and 1980s, is nearing the end of its life across North America and Europe, prompting utilities to opt for GIS during refurbishment cycles. Pacific Gas & Electric has already halved its operational SF₆ inventory while swapping aging units for dry-air and vacuum-based alternatives that come packaged as compact GIS. A Southern California refinery’s 10-year program replaces 50-year-old substations with modern GIS layouts that embed advanced safety clearances on smaller footprints. As retired engineers take decades of AIS expertise with them, utilities accelerate migrations to low-maintenance GIS designs, thereby extending service intervals and simplifying workforce training.
Grid-Upgrade Programs in APAC & North America
Public-sector stimulus drives multiyear procurement pipelines. The U.S. Department of Energy’s USD 2.2 billion Grid Resilience and Innovation Partnerships grants champion 18 state-wide projects, many of which specify factory-assembled GIS for rapid energization. National Grid commits USD 35 billion between 2024 and 2028 to reinforce the Northeastern U.S. corridors, where high humidity and extreme temperatures favor sealed-gas equipment. Parallel initiatives in India, Indonesia, and the Philippines channel concessional finance into transmission build-outs, cementing Asia-Pacific’s lead in the Gas Insulated Substation market.
Restraints Impact Analysis of Gas Insulated Substation Market*
| Restraint | (~) % Impact on CAGR Forecast | Geographic Relevance | Impact Timeline |
|---|---|---|---|
| High upfront CAPEX versus AIS alternatives | -1.20% | Global, most acute in cost-sensitive emerging markets | Short term (≤ 2 years) |
| SF₆ phase-out regulations increase compliance costs | -0.70% | EU, California, Massachusetts and pending jurisdictions | Medium term (2-4 years) |
| Long lead-times for critical GIS components | -0.50% | Global supply chain, clustered in APAC factories | Short term (≤ 2 years) |
| Talent gap for SF₆-free technology commissioning | -0.40% | OECD grids with senior workforce retiring, emerging markets | Medium term (2-4 years) |
| Source: Mordor Intelligence | |||
High Upfront CAPEX Versus AIS Alternatives
The Gas-Insulated Substation market still competes with lower-cost air-insulated designs, and project quotations often show a 5-30% premium, depending on voltage, enclosure type, and seismic requirements. However, lifecycle models reveal that reduced maintenance offsets initial capital; budget-constrained utilities in Latin America and parts of Africa continue to select AIS for straightforward rural applications. The European Commission confirms that SF₆-free GIS technologies add a further 5-30% to base prices, reinforcing cost sensitivity until volumes scale and manufacturing learning curves kick in. Procurement officers, therefore, conduct exhaustive total-cost-of-ownership analyses that incorporate carbon levies, leakage penalties, and land-purchasing costs before authorizing GIS expenditure.
SF₆ Phase-Out Regulations Increase Compliance Costs
California bars new SF₆-filled gear from 2033 onward, and Massachusetts enforces a 1% annual leak ceiling, obligating utilities to calibrate densimeters, overhaul seals, and maintain inventory tracking software. The EU’s updated F-gas regulation introduces quota auctions, which increase equipment prices because OEMs must purchase allowances if they continue to sell SF₆ variants. New York’s draft rule proposes scaling leakage baselines down 5% every five years after 2035, an approach that shifts the capital budget forward as operators accelerate fleet replacement. These frameworks require utilities to allocate compliance line items across multi-year rate cases, temporarily reducing order volumes.
*Our forecasts treat driver/restraint impacts as directional, not additive. The impact forecasts reflect baseline growth, mix effects, and variable interactions.
Gas Insulated Substation Market Segment Analysis
By Voltage:
Extra-High-Voltage Systems Anchor Backbone ExpansionExtra-high-voltage installations above 300 kV are growing at a 10.15% CAGR, a figure that surpasses the overall Gas Insulated Substation market CAGR as grid planners bring bulk renewable power from remote deserts and offshore zones to demand centers. The class enjoys regulatory backing because its low line-loss profile aligns with national efficiency mandates, and operators value GIS for its sealed architecture, which preserves dielectric integrity at altitude and in corrosive coastal air. High-Voltage systems, which held 51.90% of the Gas Insulated Substation market share in 2025, remain the workhorse for regional networks, sub-transmission rings, and heavy-industry feeders.
Hitachi Energy’s delivery of the first SF₆-free 550 kV GIS to State Grid marks the removal of the last technical barrier to eco-efficient systems at the top of the voltage pyramid, signalling a pivot point where investment decisions can align sustainability with megavolt-class performance. Utilities in Europe and Japan are already piloting similar units to stay ahead of 2030 legislative cut-offs, and North American operators are watching closely to evaluate lifespan economics. Medium-Voltage GIS below 72.5 kV continues to penetrate space-constrained distribution nodes where transformer substations must coexist with residential or commercial real estate.
By Installation Type:
Mobility Adds Agility to Substation StrategyIndoor halls account for 58.74% of the Gas Insulated Substation market, reflecting mature engineering standards and the prevalence of urban load centers that prioritize aesthetics and environmental control. However, mobile and skid-mounted packages, growing at 11.02% CAGR, illustrate how the Gas Insulated Substation market values agility during extreme-weather recovery, festival or event electrification, and planned equipment outages. Integrating breaker, disconnector, and control cubicles inside a single ISO container enables energization within one week, an advantage that outweighs the rental premium in outage cost calculations.
Midwest Energy’s first factory-assembled skid reduced field construction from six months to 30 days, shrinking labor exposure and simplifying permitting because the design qualifies as temporary equipment. Oil-rich Gulf nations are increasingly adopting trailer-mounted GIS systems to maintain power during refinery turnarounds, thereby avoiding multimillion-dollar penalties associated with unplanned downtime. These examples demonstrate how mobility shifts substation planning from static infrastructure toward an operational toolkit that utilities can reposition as system conditions dictate.


By Technology:
SF₆-Free Solutions Move Toward Commercial MaturitySF₆-based equipment still delivers proven arc-quenching performance and commands 85.10% of 2025 shipments. Yet utilities face intensifying regulatory pressure and reputational risk because each kilogram of leaked SF₆ warms the planet 25,200 times more than CO₂ over a 100-year period. The Gas Insulated Substation market therefore sees a 18.65% CAGR surge in clean-air, vacuum, and fluoronitrile blends that replicate dielectric strength while cutting greenhouse-gas footprint by 99% or more. Early adopters gain carbon-accounting credits and avoid future retrofit charges, which increasingly influence cost-benefit analyses in boardrooms.
General Electric’s 420 kV g³ breaker meets IEC short-circuit and switch-duty requirements without SF₆, proving that eco-efficiency no longer stops at distribution levels. Siemens Energy’s Clean Air units eliminate the need for gas-handling licenses because the mixture consists of purified, filtered ambient air, thereby lowering health and safety administrative overhead. Over 30 European and Korean utilities have issued framework contracts for these alternatives, providing a volume that should push unit costs closer to those of incumbent technology by 2028.
By End-User:
Renewable Generators Reshape Procurement PatternsPower Transmission Utilities hold 45.30% of end-user demand due to their statutory obligation to maintain national grids in a balanced and resilient state. Yet Renewable Generators and Independent Power Producers are the fastest-growing cohort, with a 12.14% CAGR, propelled by record solar and wind project pipelines that require collector, inter-array, and converter stations to be built on compressed schedules. Large developers prefer turnkey GIS because factory-tested modules reduce interface risk when multiple EPC consortia share a single site.
Industrial customers—such as chemicals, metals, and oil & gas—continue to source GIS for brownfield plant revamps where clearance envelopes are restricted and ambient particulates pose reliability hazards. Distribution utilities, especially in Southeast Asia, mix AIS and GIS depending on district density, often opting for hybrid substations where gas-insulated switchgear feeds overhead lines, thereby optimizing land use without compromising operational familiarity. The Gas Insulated Substation market thus mirrors broader decentralization trends, with procurement now spanning megawatt-scale rooftop solar exporters to gigawatt-class interconnectors.
Geography Analysis
APAC Gas Insulated Substation Market
The Asia-Pacific region, which accounted for 46.70% of 2025 revenue, is expected to sustain a 9.47% CAGR through 2031 as China and India develop ultra-high-voltage corridors from renewable-rich hinterlands to coastal load hubs. State Grid’s USD 89 billion outlay underwrites ±1,100 kV DC and 1,000 kV AC schemes where sealed-gas enclosures maintain dielectric strength at altitude, mitigating corona losses that plague open-air busbars. Concurrently, Southern Power Grid’s 2024-2027 budget of USD 195.3 billion emphasizes digital twin diagnostics for substation fleets, accelerating demand for smart-sensor-ready GIS bays. Japan’s floating offshore substation serves as a regional lighthouse project, while ASEAN governments unlock concessional financing for solar and storage hybrids, each requiring compact collector hubs that integrate smoothly with urban load pockets.
North America Gas Insulated Substation Market
North America leverages policy catalysts, such as the DOE’s Grid Resilience grants, which funnel USD 2.2 billion into hardware upgrades that specify Gas Insulated Substation market equipment with embedded digital monitoring. National Grid’s USD 35 billion plan encompasses 70 transmission enhancements, spanning from upstate New York to eastern Massachusetts, each engineered for weatherproof operation during prolonged heatwaves and ice storms. California’s binding SF₆ sunset prompts utilities like PG&E to standardize eco-efficient GIS, anchoring a procurement cycle likely to ripple across the West and into Canada as carbon-price convergence tightens. Supply-chain snarls for transformers remain a headwind; however, multi-year frameworks help OEMs justify capacity expansions in Texas and Mexico.
Europe Gas Insulated Substation Market
Europe channels a EUR 584 billion grid investment target into cross-border interconnectors and offshore wind hubs, enforcing tight environmental criteria that automatically elevate demand for SF₆-free devices. Germany’s TransnetBW swaps 26 bays at the Daxlanden site for Siemens Clean Air panels by 2029, while Norway’s BKK Nett locks in a six-year framework for similar replacements. Scandinavia’s wind cluster drives specialized marine GIS procurement for jacket-foundation substations, and the Iberian Peninsula’s solar surge calls for desert-rated enclosures that handle dust-laden airflow. Although the regulatory environment incurs short-term costs, it also provides a predictable runway for OEM R&D investments aligned with net-zero goals.

Regulatory Landscape
Environmental restrictions on fluorinated gases are tightening procurement rules for GIS, pushing adoption of alternative insulation media while increasing compliance documentation requirements. In the European Union, Regulation (EU) 2024/573 introduces a phased prohibition on placing new electrical switchgear using F-gases into operation by voltage class, with an early restriction applying to new switchgear up to 24 kV from January 2026, and this is already appearing in utility specifications such as EirGrid technical updates (December 2025) that require derogation for installing SF6-based 110 kV switchgear.
Safety and performance compliance is also being shaped by international standards, which affect tender qualification and type-testing regimes for OEMs. In May 2026, the International Electrotechnical Commission issued new editions, including IEC 62271-1:2026 and IEC 62271-100:2026, raising thermal stability and short-circuit performance requirements used in qualification testing for gas-insulated switchgear and associated substation bays. Separately, IEC TS 62271-318:2024 established standardized technical requirements for DC gas-insulated metal-enclosed switchgear (100 kV and above), supporting emerging HVDC and DC substation applications where OEM compliance evidence is increasingly requested in transmission procurement.
Competitive Landscape
Traditional titans—ABB, Siemens, and Hitachi Energy—still anchor the Gas Insulated Substation market, leveraging global service networks, in-house sensor ecosystems, and vertically integrated manufacturing lines that stretch from breaker drives to digital relays. Their combined footprint grants volume economies, allowing them to match local currency tenders without compromising engineered-to-order capabilities. Yet the competitive calculus is evolving as eco-efficiency migrates from a marketing slogan to an entry ticket for regulated utilities in Europe and several U.S. states. General Electric’s g³ portfolio, for example, is now qualified by more than 30 utilities, illustrating how first-mover advantage in SF₆-free solutions converts into purchase-order momentum.
Specialist suppliers seize white-space opportunities in mobile GIS and floating substations, domains where historical manufacturing lines cannot be simply repurposed. Nordic engineering firms collaborate with shipyards to certify enclosures under marine classification rules, while U.S. trailer fabricators partner with switchgear OEMs to deliver rapid-deployment units for FEMA-backed recovery efforts. Digital overlays further change the pecking order: cloud-based condition-monitoring platforms become tie-breakers in competitive bids, prompting incumbents to embed cybersecurity hardware roots-of-trust and edge analytics that comply with NERC CIP-013.
Price competition persists for conventional SF₆-filled panels in jurisdictions where phase-out timelines remain distant, and Chinese OEMs capitalize on volume leverage at home to discount export offers in Africa and Latin America. However, as more countries announce leak-rate penalties and carbon taxes, total-cost-of-ownership calculations tilt the balance toward eco-efficient lineups. Industry analysts therefore expect market concentration to erode slightly by 2030 as nimble technology entrants carve niches in regulatory-driven segments, even as incumbents preserve baseline revenue through service contracts and modernization programs.
Gas Insulated Substation Industry Leaders
ABB Ltd
Mitsubishi Electric Corporation
General Electric Company
Siemens AG
Hitachi Energy Ltd.
- *Disclaimer: Major Players sorted in no particular order
Gas Insulated Substation Market Companies Covered in this Report
- ABB Ltd
- Siemens AG
- Hitachi Energy Ltd.
- General Electric Company
- Mitsubishi Electric Corporation
- Schneider Electric SE
- Larsen & Toubro Ltd
- CG Power & Industrial Solutions Ltd
- Hyosung Heavy Industries Co., Ltd
- Bharat Heavy Electricals Ltd
- Toshiba Corp
- Elsewedy Electric S.A.E.
- Powell Industries, Inc.
- TBEA Co., Ltd.
- Eaton Corporation plc
- Fuji Electric Co., Ltd.
- Meidensha Corporation
- Hyundai Electric & Energy Systems Co.
- Jiangsu Xiangyu Power Co., Ltd
- ILJIN Electric Co., Ltd

Market Opportunities and Future Outlook
A clear whitespace is forming around SF6-free GIS at higher voltages, moving from pilot deployments to utility-grade acceptance and creating new replacement and expansion pathways in regulated markets. In Europe, city and regional utilities are translating F-gas compliance into concrete projects: GE Vernova secured contracts from Stromnetz Berlin GmbH in April 2026 for two 110 kV SF6-free GIS substations (Wittenau and Neukolln), and Hitachi Energy with TenneT Germany completed on-site high-voltage testing in June 2026 for the worlds first 420 kV SF6-free GIS at the Erzhausen substation. These actions reduce technical and commissioning risk for subsequent tenders, and they are shifting bid specifications from SF6 leakage management toward lifecycle performance and digital condition monitoring.
Capacity addition within constrained footprints is another opportunity area, where utilities prioritize faster upgrades over greenfield substation builds. In the United States, Schneider Electric announced a collaboration with Southern California Edison in June 2026 to deploy SF6-free technology at existing substations in the Antelope Valley region and San Bernardino Mountains to expand grid capacity within current sites. In Asia, transmission backbone projects are also validating SF6-free performance at the top end: Hitachi Energy delivered the worlds first 550 kV SF6-free GIS to Chubu Electric Power Grid in March 2026 for backbone transmission use. This widens the addressable market for eco-efficient GIS beyond distribution and sub-transmission and supports standardization of SF6-free bay designs and qualification packages across multiple voltage levels.
Recent Industry Developments in Gas Insulated Substation Market
- June 2026: Hitachi Energy and TenneT Germany completed on-site high-voltage testing of the worlds first 420 kV SF6-free gas-insulated switchgear at the Erzhausen substation. This milestone advances field qualification for SF6-free EHV applications and supports utility procurement aligned with EU F-gas requirements, helping to de-risk future multi-bay replacements.
- October 2025: Hitachi Energy received Chinas first 1100 kV GIS order for an ultra-high-voltage transmission system. The order strengthens the EHV and UHV GIS pipeline and reinforces the role of high-rating GIS in long-distance bulk power corridors linked to renewables integration.
- August 2024: GE Vernova announced delivery of the worlds first 245 kV SF6-free gas-insulated substation for RTE in France. Deploying SF6-free technology at transmission voltage levels provides a reference case for broader utility standardization and supports replacement programs where footprint constraints and environmental compliance converge.


Gas Insulated Substation Market Report Scope and Research Methodology
Market Definition and Coverage
For this study, the market covers revenues earned from gas insulated substation solutions supplied for power networks, where primary equipment is enclosed and insulated using gas to enable compact, high reliability substations across voltage classes.
Scope exclusions: We exclude conventional air insulated substations and routine civil construction work that is not specific to GIS electrical packages.
Segments Covered in This Report
- By Voltage
- Medium Voltage (Up to 72.5 kV)
- High Voltage (72.5 to 245 kV)
- Extra-High Voltage (Above 300 kV)
- By Installation Type
- Indoor GIS
- Outdoor GIS
- Mobile/Skid-Mounted GIS
- By Technology
- SF₆-based GIS
- SF₆-free (g³, Clean-Air, Vacuum) GIS
- By End-User
- Power Transmission Utilities
- Power Distribution Utilities
- Renewable Generators and IPPs
- Industrial (Oil and Gas, Mining, Metals, Chemicals)
- Commercial and Residential Buildings
- By Geography
- North America
- United States
- Canada
- Mexico
- Europe
- Germany
- United Kingdom
- France
- Italy
- NORDIC Countries
- Russia
- Rest of Europe
- Asia-Pacific
- China
- India
- Japan
- South Korea
- ASEAN Countries
- Rest of Asia-Pacific
- South America
- Brazil
- Argentina
- Rest of South America
- Middle East and Africa
- Saudi Arabia
- United Arab Emirates
- South Africa
- Egypt
- Rest of Middle East and Africa
- North America
Data Sources, Market Sizing, and Validation
Desk Research
Desk work started by mapping where GIS demand comes from, which is mostly grid buildout, replacement cycles, and space constrained installations. We reviewed public power system and investment signals, including IEA power sector outlooks, World Bank electricity access and reliability indicators, and regulator and grid operator planning documents.
To keep inputs grounded, we also relied on sources such as IEA electricity data, IRENA renewables statistics, UN Comtrade trade codes for high voltage electrical apparatus, IEEE and CIGRE technical publications, and national energy agencies for transmission and distribution expansion plans. These were complemented with company annual reports, investor presentations, project award news, and a paid subscription used for company financials and patent lookups where public detail was limited. The desk sources listed here are illustrative only, and many other documents were reviewed to collect data, validate patterns, and refine assumptions.
Primary Interviews and Surveys
Primary discussions were used to confirm where GIS is specified in practice, how pricing moves by voltage and installation type, and what lead times and tender cycles look like across regions. We spoke with utilities, EPC teams, OEM-side product and sales leaders, and service partners, then checked consistency across APAC, EMEA, and the Americas so gaps from public sources could be closed with practical inputs.
Distribution of primary research fieldwork respondents
| Company type | Respondent position | Region |
|---|---|---|
| Top tier: 26% | CXOs: 14% | APAC: 44% |
| Mid tier: 60% | Functional/Unit leaders: 35% | EMEA: 35% |
| Smaller Players: 14% | Managers: 51% | Americas: 21% |
Market-Sizing & Forecasting
Sizing was built using a top-down and bottom-up blend, where transmission and distribution expansion plans, substation additions, and refurbishment intensity were reconstructed by region, then translated into a GIS demand pool using typical GIS adoption rates for space constrained and high reliability use cases. Once that demand pool was established, it was converted to value using average selling price ranges that vary by voltage class and installation type, then adjusted for mix shifts.
To avoid relying on a single angle, results were corroborated with selective bottom-up approximations, including sampled project award values, supplier revenue splits disclosed at a business line level, and channel checks on tender volumes. A few practical inputs were treated as key model drivers, including planned grid interconnection capacity additions, renewable integration pace (which affects new bays and switching needs), urban substation replacement rates, SF6-free adoption timing, and commodity-linked component cost movement that influences quoted pricing. Where direct data was missing, conservative fill rules were applied using comparable countries with similar grid age and investment patterns, and then rechecked in interviews.
For forecasting, scenario analysis was used so the base case could reflect different speeds of grid modernization and permitting cycles. Assumptions on adoption and pricing were stress-tested with expert feedback, and the final path was selected after the implied trend direction matched observed tender pipelines and utility capex guidance.
Data Validation & Update Cycle
Model outputs were checked against independent signals such as grid capex trends, announced substation projects, and trade flows for high voltage equipment. This helps reveal cases where the build plan and the implied market value do not align. Variances are flagged, the underlying drivers are revisited, and follow-up calls are triggered when a region shows an unusual jump in adoption rate or pricing.
Before sign-off, the work is reviewed in multiple steps so unit assumptions, currency conversions, and regional totals reconcile cleanly. Reports are refreshed annually, with interim updates when major policy changes, large tender announcements, or supply disruptions materially shift the outlook. Immediately before delivery, a final analyst pass is completed so clients receive the latest updated view.
Mordor Intelligence's Gas Insulated Substation Market Size Measured Against Other Published Estimates
Published market values for gas insulated substations often vary because firms do not always count the same equipment scope, base year timing, and pricing treatment. Differences also come from how SF6-free systems are handled, whether mobile or skid substations are included, and how currency conversion is timed for multi-region projects.
The benchmark table shows a spread that mainly links back to what is being counted as GIS revenue and how fast pricing is assumed to move. In Mordor Intelligence's model, only GIS equipment packages and related electrical subassemblies are counted, and totals are cross-checked using tender activity and grid expansion indicators rather than broad substation spending.
Benchmark comparison
| Source | Market Size | Gaps in Research Methodology |
|---|---|---|
| Mordor Intelligence | USD 37.51 B (2026) | |
| Trade Journal A | USD 26.81 B (2025) | Often anchored to an earlier base year and may emphasize historical growth with fewer adjustments for voltage mix and higher value indoor GIS projects, which can keep the value lower versus a later-year price environment. |
| Industry Publisher B | USD 24.99 B (2025) | Commonly uses a narrower interpretation of GIS demand tied to select utility use cases, and may apply flatter ASP progression across regions, which can understate markets with higher specifications and faster grid build cycles. |
Taken together, the gap is explained less by math and more by definition, timing, and pricing logic. By keeping the scope tied to identifiable GIS equipment demand signals and validating totals with interviews, the estimate stays traceable to clear drivers that can be rechecked year to year.


Key Questions Answered in the Report
How large is the Gas Insulated Substation market in 2026?
The Gas Insulated Substation market size is USD 37.51 billion in 2026, keeping pace with its 8.17% CAGR trajectory to 2031.
Which voltage class is expanding fastest?
Extra-High-Voltage GIS installations above 300 kV are growing at a 10.15% CAGR, the quickest among all voltage segments.
Why are utilities shifting toward SF₆-free switchgear?
SF₆-free switchgear eliminates a greenhouse gas with a 25,200-fold global-warming potential versus CO₂ and meets new bans in California (2033) and the EU (2030-2032).
What share does Asia-Pacific hold in global demand?
Asia-Pacific accounts for 46.70% of 2025 revenue and remains the dominant regional buyer through 2031.
How fast are mobile or skid-mounted GIS units growing?
Mobile and skid-mounted installations are advancing at an 11.02% CAGR as utilities prioritize rapid deployment and disaster recovery readiness.
Which companies lead in SF₆-free technology?
Hitachi Energy, Siemens Energy, and General Electric currently trailblaze SF₆-free offerings, each launching high-voltage products between 2024 and 2025.
Page last updated on:


 Your data is secure and never sold or shared.


