
Gas Detection System Market Size and Share
Market Overview
| Study Period | 2020 - 2031 |
|---|---|
| Market Size (2026) | USD 5.88 Billion |
| Market Size (2031) | USD 7.46 Billion |
| Growth Rate (2026 - 2031) | 4.86 % |
| Fastest Growing Market | Asia |
| Largest Market | North America |
| Market Concentration | Medium |
Major Players *Disclaimer: Major Players sorted in no particular order Image © Mordor Intelligence. Reuse requires attribution under CC BY 4.0. | |
Gas Detection System Market Analysis by Mordor Intelligence
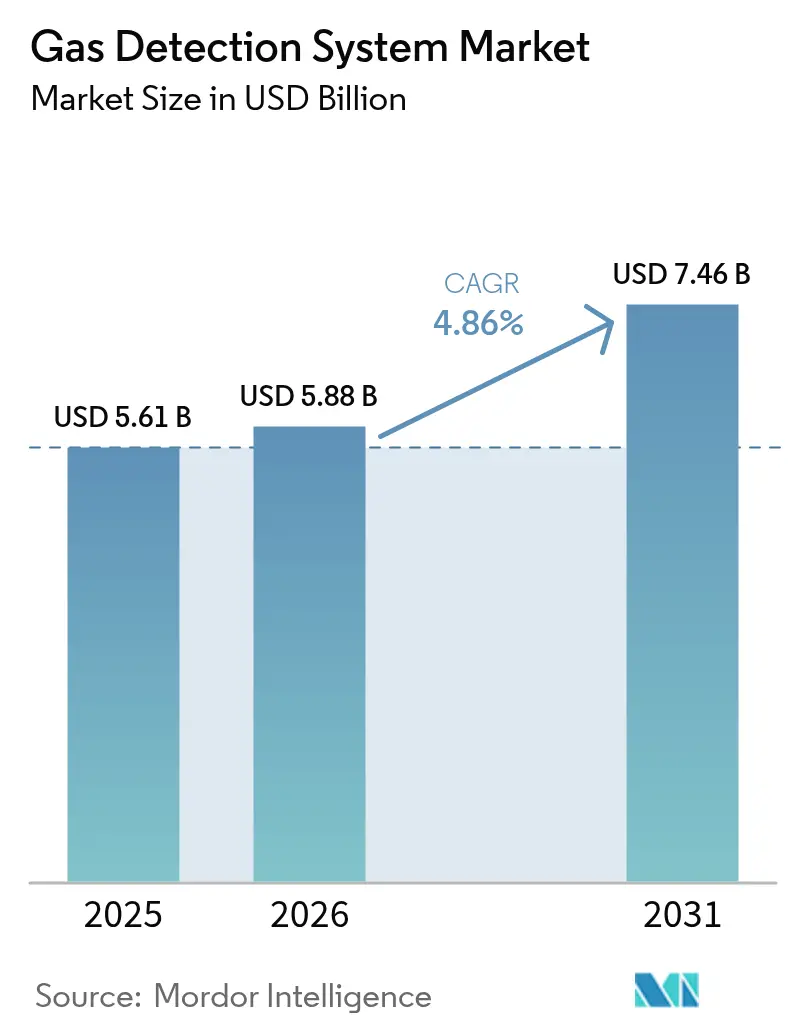
The Gas Detection System Market size was valued at USD 5.61 billion in 2025 and estimated to grow from USD 5.88 billion in 2026 to reach USD 7.46 billion by 2031, at a CAGR of 4.86% during the forecast period (2026-2031). A shift away from exclusive oil-and-gas dependence toward hydrogen infrastructure, battery energy storage, and low-GWP refrigerant applications supports steady demand. Mandatory IIoT safety upgrades in China, updated NFPA 855 codes for energy storage, and Europe’s REPowerEU hydrogen targets collectively enlarge the addressable base. Growth accelerators include wireless networking, predictive analytics, and multi-gas integration, while technical barriers around sensor calibration and certified wireless spectrum temper momentum. Competitive activity remains moderate as established vendors secure technology breadth through acquisitions and joint ventures.
Key Report Takeaways
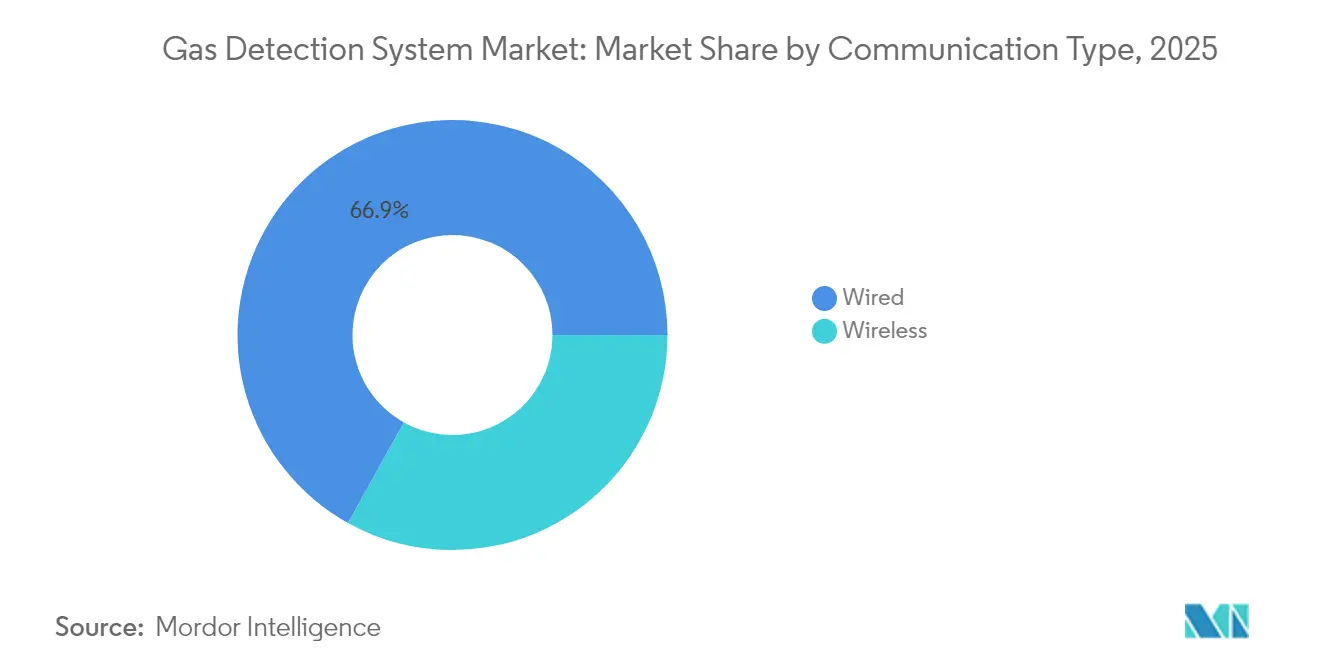
- By communication type, wired systems led with 66.92% revenue share in 2025, whereas wireless recorded the highest 6.12% CAGR through 2031.
- By detector design, fixed installations held 70.62% of the gas detection system market share in 2025, while portable devices are set to expand at 5.48% CAGR to 2031.
- By sensor technology, electrochemical units accounted for 44.55% share of the gas detection system market size in 2025 and infrared sensors are projected to grow 6.84% CAGR over 2026-2031.
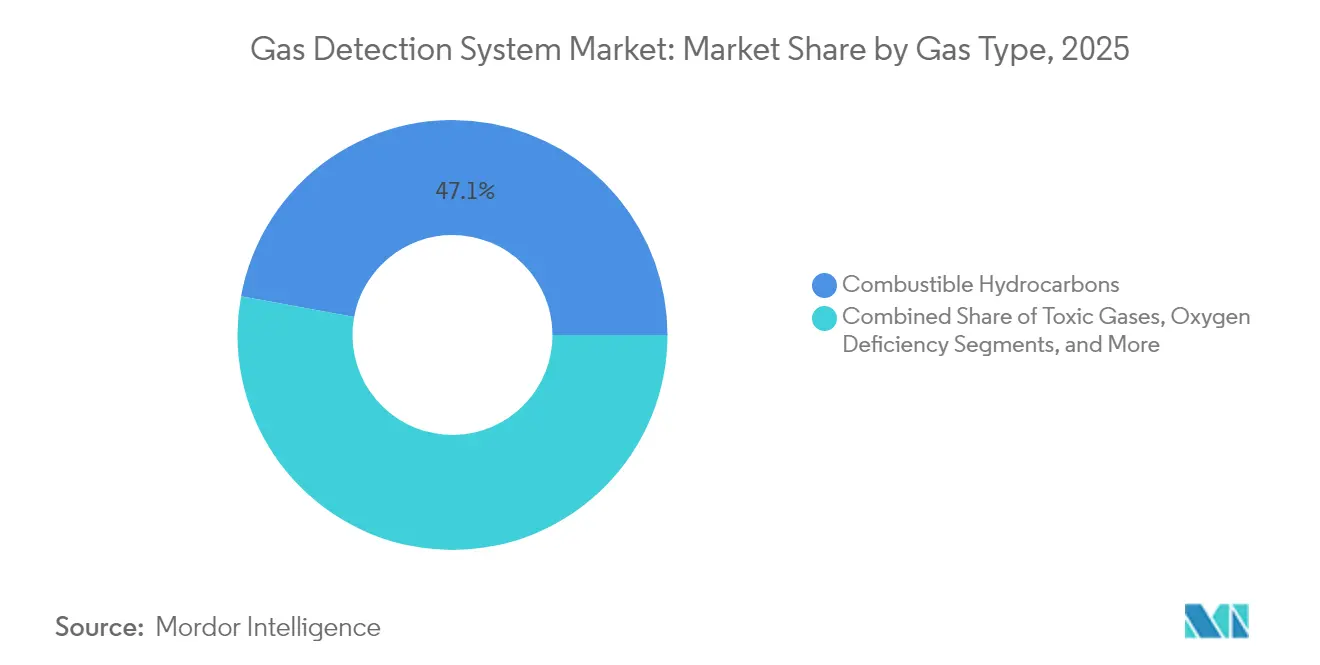
- By gas type, combustible hydrocarbon detection commanded 47.12% share of the gas detection system market size in 2025; refrigerant monitoring is advancing at 5.03% CAGR.
- By device type, multi-gas platforms captured 60.05% revenue share in 2025.
- By power source, hard-wired solutions controlled 68.15% of 2025 revenue and battery-powered units post a 5.98% CAGR outlook.
- By end-user, oil & gas led with 34.18% share in 2025, while discrete manufacturing rises fastest at 7.33% CAGR.
- By geography, North America represented 31.74% revenue share in 2025; Asia-Pacific exhibits the quickest 5.62% regional CAGR.
Note: Market size and forecast figures in this report are generated using Mordor Intelligence’s proprietary estimation framework, updated with the latest available data and insights as of 2026.
Market Trends and Insights
Drivers Impact Analysis of Gas Detection System Market*
| Driver | (~) % Impact on CAGR Forecast | Geographic Relevance | Impact Timeline |
|---|---|---|---|
| Expansion of Hydrogen Economy Driving Demand for Multi-Gas Detectors in Europe | +0.8% | Europe, with spillover to North America | Medium term (2-4 years) |
| Rising Offshore Deepwater E&P Activities Requiring High-Reliability Gas Monitoring | +0.6% | North America, Gulf of Mexico | Short term (≤ 2 years) |
| Mandatory IIoT-enabled Safety Upgrades under China State Administration of Work Safety | +0.7% | China, with regional influence in APAC | Medium term (2-4 years) |
| Accelerating Adoption of Battery Energy Storage Systems with Fire/Gas Codes | +0.5% | Global, concentrated in North America and Europe | Long term (≥ 4 years) |
| Surge in Green Ammonia Projects Boosting NH3 Leak Detection | +0.4% | EMEA, with expansion to APAC | Long term (≥ 4 years) |
| Transition to Low-GWP Refrigerants Driving Refrigerant Gas Detection | +0.3% | Global, led by developed markets | Medium term (2-4 years) |
| Source: Mordor Intelligence | |||
Expansion of Hydrogen Economy
Europe’s hydrogen build-out under the REPowerEU plan demands sensors able to track hydrogen alongside traditional combustibles and oxygen-deficiency risks. Palladium-nanotransistor prototypes now detect parts-per-billion H₂ with minimal power draw.[2] As projects scale, multi-gas devices become budgeted line items, embedding the gas detection system market deeper into European energy infrastructure. Procurement cycles favor vendors with hydrogen-specific analytics and ATEX certificates, elevating design complexity and average selling prices.
Rising Offshore Deepwater Exploration
Thirteen new Gulf of America fields scheduled online through 2026 will add 0.27 Bcf/d of gas, prompting operators to specify marine-certified methane detectors.[1] Honeywell’s Emissions Management Suite-approved for hazardous marine zones-illustrates product differentiation that meets stricter uptime and remote-maintenance criteria. Predictive algorithms trimming false alarms by 40% strengthen value propositions where offshore interventions run into millions of USD per call-out.
Mandatory IIoT Safety Upgrades in China
China’s Three-Year Action Plan mandates real-time, connected gas monitoring in mining, chemicals, and heavy manufacturing.[3] Facilities facing 2026 compliance deadlines accelerate replacement of analog systems with wireless-enabled platforms. The regulation shifts demand from standalone detectors to integrated, cloud-reporting networks, broadening the gas detection system market envelope and raising the technological entry bar for domestic entrants.
Accelerating Battery Energy Storage Deployment
NFPA 855 now requires multi-species gas detection tied to ventilation and suppression controls for storage systems above 20 kWh. Texas fire codes add state-level urgency. Compliance turns detection from optional to mandatory, positioning integrated solution suppliers for premium capture across utility-scale and behind-the-meter projects.
Restraints Impact Analysis of Gas Detection System Market*
| Restraints | (~) % Impact on CAGR Forecast | Geographic Relevance | Impact Timeline |
|---|---|---|---|
| Faulty Calibrations in Sulfur-rich Environments Causing False Alarms | -0.3% | Global, particularly oil & gas regions | Short term (≤ 2 years) |
| Scarcity of Certified Wireless Spectrum for Hazardous Locations (Zones 0/1) | -0.4% | Global, with acute impact in Europe and North America | Medium term (2-4 years) |
| High CapEx for Redundant Sensor Networks in Brown-field Refineries | -0.2% | Global, concentrated in mature oil & gas markets | Medium term (2-4 years) |
| Limited Availability of Long-life Solid-State NH3 Sensors Less than -40 °C (Nordics) | -0.1% | Nordic countries, with spillover to Arctic regions | Long term (≥ 4 years) |
| Source: Mordor Intelligence | |||
Faulty Calibrations in Sulfur-Rich Environments
Hydrogen sulfide above 50 ppm shortens electrochemical sensor life by 60%, inflating maintenance budgets and eroding operator trust. MEMS-based detectors mitigate poisoning but carry higher capital costs . Cross-sensitivities force redundant arrays, complicating wiring schemas and dampening the gas detection system market’s short-term uptake in sour-gas facilities.
Scarcity of Certified Wireless Spectrum
Zone 0 certification for wireless nodes can stretch to 24 months, delaying projects and nudging buyers back toward wired architectures.. Regional NB-IoT spectrum gaps further constrain deployment density, sustaining premium pricing for compliant wireless SKUs and moderating the gas detection system market’s upgrade rate in digitally transforming plants.
*Our forecasts treat driver/restraint impacts as directional, not additive. The impact forecasts reflect baseline growth, mix effects, and variable interactions.
Gas Detection System Market Segment Analysis
By Communication Type:
Wireless Infrastructure Modernization AcceleratesWired installations accounted for 66.92% of 2025 revenue, anchoring the gas detection system market in legacy process industries. Modern plants now weigh material cost savings and installation agility; hence wireless revenues are advancing at 6.12% CAGR. Mesh topologies preserve link resilience, while NB-IoT energy-harvesting prototypes underscore future autonomy. Certification roadblocks and interference management still cap near-term penetration, yet wireless remains the chief modernization lever across brownfield projects.
Reduced trenching costs appeal to temporary construction and turnaround scenarios, and battery-free sensor nodes promise maintenance relief. With wireless links feeding cloud dashboards, operators move from compliance-driven monitoring toward predictive asset health, reinforcing recurring-service revenue streams in the gas detection system market.

By Detector Type:
Portable Solutions Gain Traction in Flexible OperationsFixed detectors retained 70.62% share in 2025, reflecting code requirements for continuous coverage in petrochemical and utility sites. Workforce mobility and shutdown activities fuel a 5.48% CAGR for portables, which now bundle CAT-M cellular modems and cloud APIs. Fleet-wide analytics streamline compliance documentation, improving ROI narratives.
Hybrid area monitors extend portable coverage with 100-day battery life, bridging gaps between personal and fixed layers. While fixed arrays remain foundational for process control integration, modular sensor cartridges and hot-swap designs cut downtime, fortifying their long-term position inside the gas detection system market.
By Sensor Technology:
Infrared Innovation Reconfigures Maintenance EconomicsElectrochemical cells delivered 44.55% of 2025 revenues, yet infrared devices are rising 6.84% CAGR on stability and low drift. Photoacoustic IR systems detect ammonia to 1 ppm without frequent recalibration. Mid-IR metasurface microspectrometers show promise for multi-gas analytics at chip-scale footprints.
Catalytic bead sensors still underpin basic hydrocarbon alarms, but sensor-fusion firmware now marries IR, PID, and electrochemical channels for selectivity gains. These advances cut lifetime ownership costs and expand the gas detection system market into environments where maintenance access is constrained.
By Gas Type:
Refrigerant Monitoring Gains Regulatory TailwindCombustible gases generated 47.12% of 2025 sales, yet low-GWP refrigerant detection is growing 5.03% CAGR as HVAC-R codes tighten. ASHRAE 15-2024 mandates dual-range sensors, stimulating demand for specialized A2L products. NDIR-based R290 detectors with ±2.5% LFL accuracy meet flammability challenges.
Toxic gas and oxygen-deficiency monitoring retain steady industrial relevance, while semiconductor fabs spur niche demand for ultra-trace specialty-gas detection. Such diversification shields the gas detection system market from commodity price swings in hydrocarbons.
By Device Type:
Multi-Gas Integration Becomes Default SpecificationMulti-gas instruments captured 60.05% of 2025 turnover as facilities prioritize platform simplicity over single-species specialization. Controllers supporting up to 16 channels streamline rack space and supervisory system integration. Parts-per-trillion comb-interferometry prototypes could enable 20-gas monitoring on one optical bench.
Single-gas units continue where extreme sensitivity is paramount, but life-cycle economics and reduced calibration overhead anchor multi-gas as the mainstream of the gas detection system market.
By Power Source:
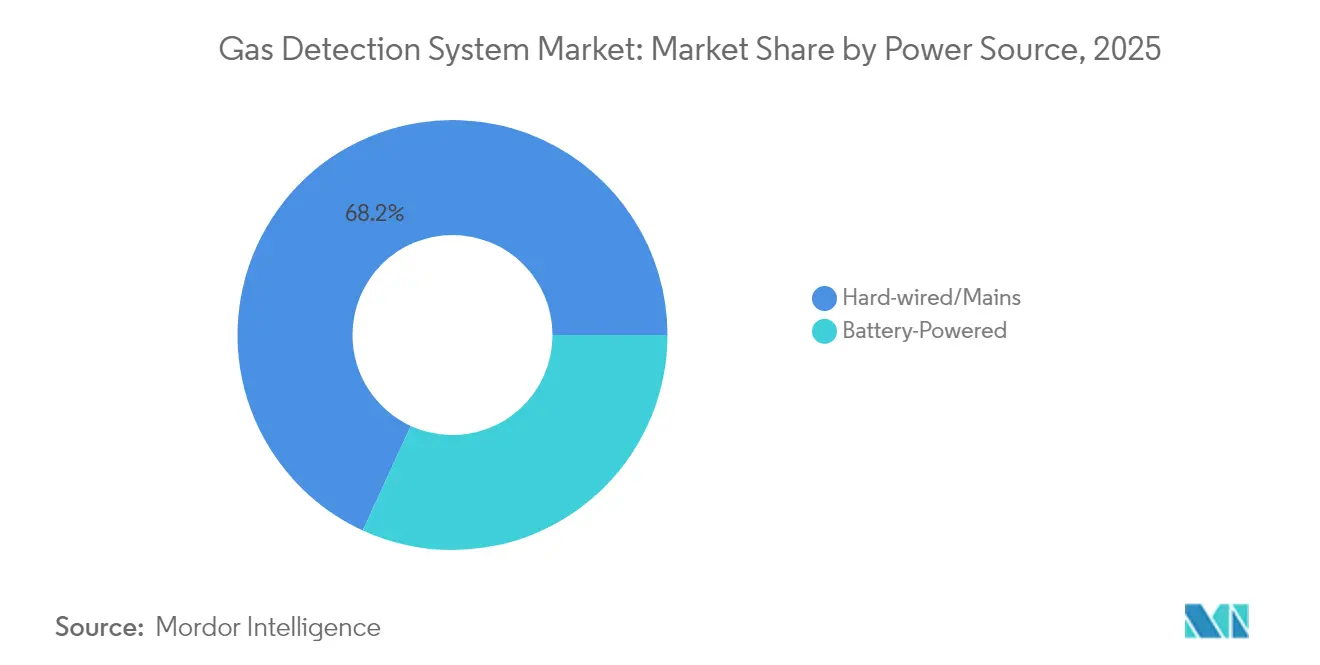
Battery and Energy-Harvesting Options Broaden DeploymentHard-wired products held 68.15% share in 2025, supported by code preferences and intrinsic power reliability. Battery-powered units grow 5.98% CAGR as Li-ion density climbs and firmware throttles current below 0.5 mA . Thermoelectric harvesters reclaim process heat to create autonomous nodes, ideal for pipelines and flare stacks.
Hybrid solar or vibration-assisted systems extend deployments into remote or mobile assets, deepening reach of the gas detection system market while easing total-cost barriers for smaller operators.
By End-User Industry:
Discrete Manufacturing Sparks Technology RefreshOil & gas retained 34.18% share, yet discrete manufacturing posts a 7.33% CAGR on semiconductor, battery, and EV supply-chain expansion. Sub-ppm toxic-gas detection in fabs and battery fire-gas analytics spearhead premium sensor adoption
Water-wastewater, chemicals, mining, and food processing each maintain niche, regulation-driven baselines. Cross-industry diversification cushions the gas detection system industry against cyclical swings in any one vertical.
Geography Analysis
North America Gas Detection System Market
North America led revenue with 31.74% share in 2025, reflecting entrenched OSHA and NFPA frameworks that compel comprehensive safety monitoring. Offshore project starts and LNG build-outs sustain capital spending on marine-certified detectors, while battery energy storage rollouts widen scope into utility and commercial real estate. Canadian hydrogen pilots and carbon-capture hubs further reinforce demand across multi-gas platforms.
Europe Gas Detection System Market
Europe follows with strong growth tied to hydrogen infrastructure and refrigerant phase-downs. ATEX and IECEx compliance requirements raise entry barriers, channeling contracts toward firms with established certification pedigrees. German chemical clusters and UK pharmaceuticals champion early adoption of wireless analytics, whereas Nordic operators specify low-temperature sensor packages calibrated to -40 °C.
APAC Gas Detection System Market
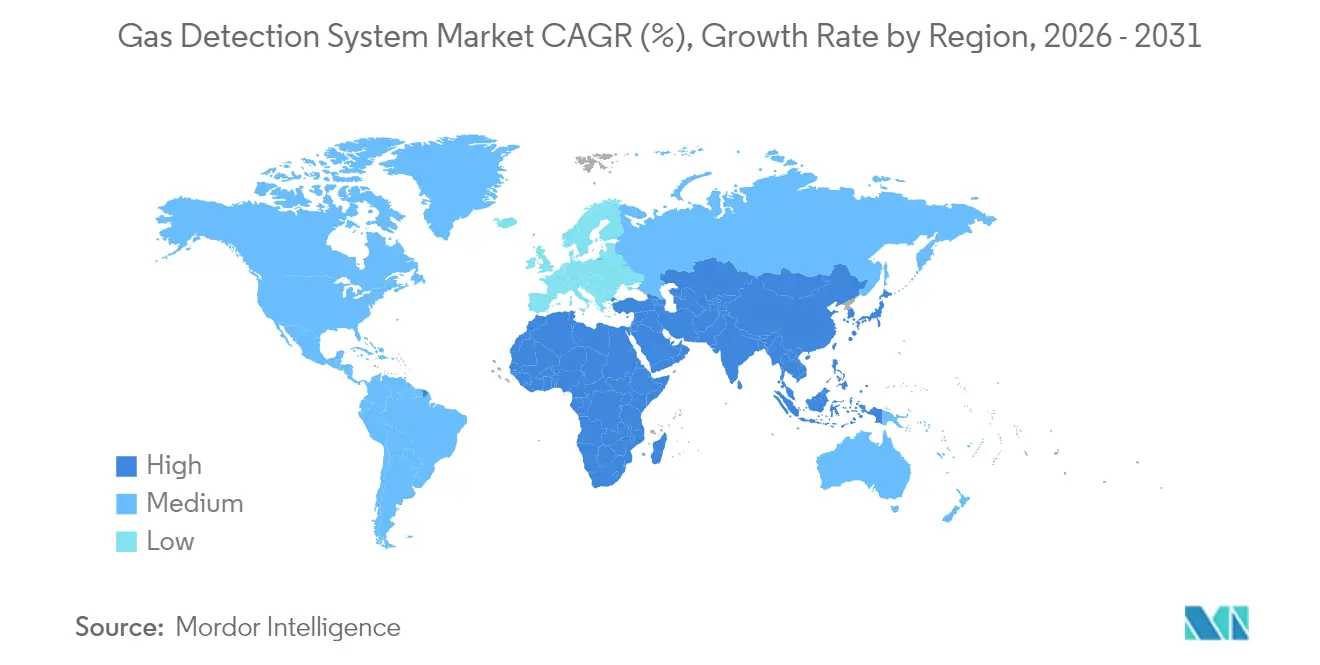
Asia-Pacific records the fastest 5.62% CAGR, propelled by China’s IIoT safety mandate and India’s hazardous-chemical rules. Japanese updates to the High-Pressure Gas Safety Act and SEA petrochemical investments also boost uptake. Rapid industrialization, combined with maturing safety cultures, enlarges regional opportunity for both basic and advanced offerings, positioning APAC as the primary incremental engine for the gas detection system market through 2031.
Regulatory Landscape
The regulatory environment for gas detection systems is anchored in explosive-atmosphere compliance and sector-specific safety and emissions requirements. International and regional standard updates tightened technical baselines, including the IEC 60079:2025 series for equipment used in explosive atmospheres and the European publication of EN IEC 60079-29-0:2026 for gas detection equipment requirements, which affects product testing, ATEX/IECEx-aligned certification cycles, and tender eligibility across process industries.
Enforcement-oriented rules are also reinforcing continuous monitoring and documented performance testing. In the United States, EPA amendments to Clean Air Act NESHAP rules finalized in April 2026 raised requirements tied to leak detection and repair (LDAR) and performance testing in covered industrial operations, while mining safety requirements in Title 30 CFR support demand for compliant methane detection in underground environments. In the United Kingdom, the Office for Product Safety and Standards published a designated-standards notice in June 2026 for equipment in potentially explosive atmospheres, which keeps conformity pathways aligned for manufacturers placing certified devices on the UK market.
Value Chain Analysis
The gas detection system value chain begins with sensing elements and electronics inputs (electrochemical cells, IR optics, catalytic beads, MOS components, microcontrollers, radios, batteries). It then moves to detector OEMs and contract manufacturers that assemble fixed and portable devices, followed by certification bodies and test labs that validate compliance for hazardous locations, including IEC/EN 60079 and ATEX-related requirements. System design and deployment are often handled by distributors and system integrators that bundle detectors with controllers, gateways, and plant networks, while software layers increasingly connect fleets to dashboards and safety workflows.
Downstream value is realized through commissioning, calibration, bump testing, spares, and multi-year service agreements, which makes aftersales and maintenance providers critical participants alongside OEM service teams. Supply-side risks concentrate in semiconductor and radio component availability and in long certification lead times for Zone 0/1 wireless devices, which can extend project schedules and shift buyers toward wired architectures for critical coverage. As demand broadens beyond oil and gas into hydrogen infrastructure, battery energy storage, and low-GWP refrigerant applications, integrators and OEMs are also expanding capabilities around wireless networking, analytics, and multi-gas integration to deliver turnkey safety systems rather than point products.
Competitive Landscape
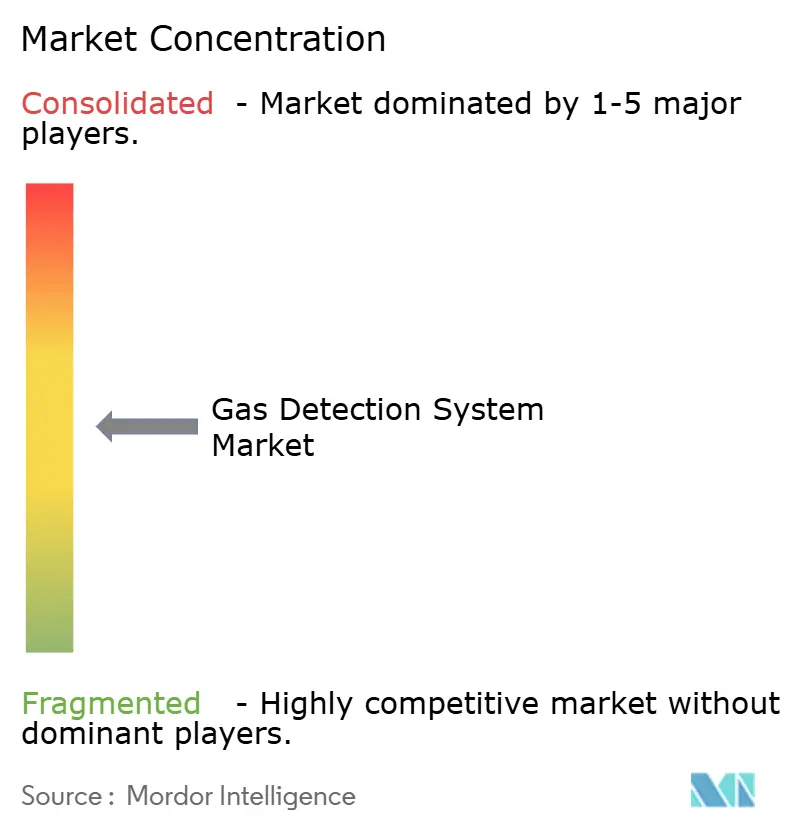
Industry consolidation remains moderate. Honeywell’s USD 1.81 billion LNG technology buy and USD 2.25 billion catalyst acquisition underscore a strategy to couple process know-how with detection hardware, embedding sales into larger energy-transition projects. MSA Safety added German gas-analysis expertise through the USD 200 million M&C TechGroup deal and logged 17% Q1 2025 organic growth in detection revenue, validating cross-sell leverage.
Connected-safety specialist Blackline Safety crossed USD 100 million in annual sales on service-centric models, highlighting a shift from hardware margins to SaaS-recurring revenue. The SICK–Endress+Hauser joint venture pools analyzer and flow-meter intellectual property, aiming to speed multi-parameter product launches and compete on integrated plant packages.
Emerging disruptors exploit rare-earth orthoferrites and nanomaterial electrodes for heightened sensitivity, though certification complexity slows rapid scaling. Players capable of merging AI diagnostics, cloud analytics, and IECEx Zone 0 wireless certificates hold a defensible technology moat, shaping the medium-term structure of the gas detection system market.
Gas Detection System Industry Leaders
-
Honeywell International Inc.
-
Drägerwerk AG & Co KgaA
-
SENSIT Technologies
-
Hanwei Electronics Group Corporation
-
Emerson Electric Co.
- *Disclaimer: Major Players sorted in no particular order
Gas Detection System Market Companies Covered in this Report
- Honeywell International Inc.
- Drägerwerk AG and Co. KGaA
- MSA Safety Inc.
- Emerson Electric Co.
- Teledyne Gas and Flame Detection
- Industrial Scientific Corp.
- Riken Keiki Co. Ltd.
- GfG Gas Detection Germany
- Det-Tronics (Carrier)
- New Cosmos Electric Co.
- Sensidyne LP
- SENSIT Technologies
- Crowcon Detection Instruments Ltd.
- Trolex Ltd.
- Hanwei Electronics Group
- International Gas Detectors Ltd.
- OTIS Instruments Inc.
- GASTEC Corp.
- ABB Ltd.
- Xylem Inc. (YSI)
- General Monitors (United Technologies)
Market Opportunities and Future Outlook
A key opportunity is compliance-driven refresh cycles that require higher-performing and certified detection in hazardous and regulated environments. The publication of EN IEC 60079-29-0:2026 creates a concrete requalification and upgrade trigger for suppliers selling into explosive-atmosphere applications. Emissions and LDAR-focused rulemaking, including EPA NESHAP amendments finalized in April 2026, also reinforces demand for reliable detection and documented testing workflows at regulated industrial sites.
Whitespace is opening around connected safety and lower-maintenance sensing architectures that reduce lifecycle cost in hard-to-access assets. In 2026, Honeywell expanded its portfolio with a 4-Series NDIR hydrocarbon gas sensor (March 2026) and launched Safety Suite 2.0 to provide real-time visibility into portable detector fleets (June 2026), indicating where budgets are moving toward integrated hardware plus software management. Emerson's addition of combustible gas detection capability to the Rosemount 928 Wireless Gas Monitor over WirelessHART (June 2026) supports remote monitoring use cases in brownfield plants where trenching and wiring costs are a constraint. These proof points point to opportunities in wireless retrofits, multi-gas platforms for hydrogen and energy storage safety, and service-led models that bundle calibration management, analytics, and uptime guarantees.
Recent Industry Developments in Gas Detection System Market
- June 2026: Honeywell launched Safety Suite 2.0, an industrial software upgrade aimed at delivering real-time visibility into fleets of portable gas detection devices across refineries, chemical plants, and utilities. The release strengthens connected-safety workflows by linking device status and compliance data to centralized operations, supporting service and software attachment alongside detector deployments.
- May 2026: Drager Safety UK won a GBP 1.8 million contract from Southern Water to provide TotalCare service and maintenance for more than 700 fixed gas detection systems across about 150 sites over five years, with an extension option. The award highlights utilities appetite for outsourced lifecycle support and locks in recurring service revenue tied to installed-base reliability.
- December 2025: Drager secured a six-figure contract to supply advanced gas detection and monitoring solutions for a North Sea offshore oil and gas operator. The win reinforces demand for high-reliability detection in offshore environments where uptime and remote support requirements shape vendor selection and long-term service pull-through.
Gas Detection System Market Report Scope and Research Methodology
Market Definition and Coverage
For this methodology, the gas detection system market covers fixed and portable solutions used to detect hazardous gases in workplaces. It includes devices, controllers, and connected monitoring components that are sold for safety and compliance use.
Scope exclusions: We exclude general fire alarm panels and stand-alone fire detection equipment that are not sold or deployed as part of a gas detection system.
Segments Covered in This Report
- By Communication Type
- Wired
- Wireless
- By Detector Type
- Fixed
- Portable
- By Sensor Technology
- Electrochemical
- Infra-red (IR)
- Catalytic Bead
- Photo-ionization (PID)
- Others (MOS, Optical)
- By Gas Type
- Combustible Hydrocarbons
- Toxic Gases (CO, H?S, Cl?, SO?)
- Oxygen Deficiency
- Refrigerant Gases
- Specialty and Rare Gases
- By Device Type
- Single-Gas Detectors
- Multi-Gas Detectors
- By Power Source
- Battery-Powered
- Hard-wired/Mains
- By End-user Industry
- Oil and Gas
- Chemicals and Petrochemicals
- Water and Wastewater
- Metals and Mining
- Power and Utilities
- Food and Beverage
- Pharma and Life-Sciences
- Discrete Manufacturing (Semiconductor, Automotive, Battery)
- Other Industries (Battery Energy Storage, and More)
- By Geography
- North America
- United States
- Canada
- Mexico
- Europe
- Germany
- United Kingdom
- France
- Nordics
- Rest of Europe
- South America
- Brazil
- Rest of South America
- Asia-Pacific
- China
- Japan
- India
- South-East Asia
- Rest of Asia-Pacific
- Middle East and Africa
- Middle East
- Gulf Cooperation Council Countries
- Turkey
- Rest of Middle East
- Africa
- South Africa
- Rest of Africa
- Middle East
- North America
Data Sources, Market Sizing, and Validation
Desk Research
We first shaped the demand pool using public safety and industry signals, since gas detection purchases typically follow clear risk exposure and compliance needs. Sources reviewed included materials from agencies such as OSHA and NIOSH, standards bodies such as NFPA and IEC, and technical references from NIST, which helped anchor definitions and typical performance requirements.
To estimate scale by end user and region, we also used public industrial activity indicators and trade signals. This included sources such as the US EIA for oil and gas activity context, the USGS for mining indicators, and customs trade statistics for shipments of safety and sensing equipment. We then cross-checked those signals against company filings, annual reports, investor decks, and credible industry press. In parallel, we used select paid subscriptions for company financials and intelligence, patent databases, and an import-export shipment-level database to validate supplier presence and movement trends. These desk research sources are illustrative only, and many other references were used for data collection, validation, and clarification during the work.
Primary Interviews and Surveys
Inputs were tested through expert interviews and structured surveys with system OEMs, channel partners, safety managers, and maintenance service teams who handle calibration and replacement cycles. Since this is a global market, we balanced coverage across APAC, EMEA, and the Americas so adoption patterns in oil and gas, chemicals, mining, utilities, and manufacturing could be compared, and the model assumptions could be adjusted where needed.
Distribution of primary research fieldwork respondents
| Company type | Respondent position | Region |
|---|---|---|
| Top tier: 39% | CXOs: 17% | APAC: 50% |
| Mid tier: 42% | Functional/Unit leaders: 34% | EMEA: 31% |
| Smaller Players: 19% | Managers: 49% | Americas: 19% |
Market-Sizing & Forecasting
Our sizing starts with a top-down build that reconstructs demand from end-user activity and installed-base exposure, then converts that pool into system value using adoption and replacement logic. For gas detection systems, this means linking industry footprints to purchase triggers such as hazardous area count, workforce safety coverage, and plant-level monitoring needs.
Key inputs used in the model include the split of fixed versus portable deployments, typical calibration and sensor replacement intervals, adoption of wireless connectivity for monitoring, end-user spending sensitivity to oil prices and industrial output, and regional safety and emissions enforcement intensity. Where a data gap exists, especially for smaller end users, totals were checked using selective bottom-up approximations such as sampled ASP by device type multiplied by estimated shipment volumes, alongside channel feedback on annual procurement cycles.
Forecasts were built using scenario analysis, since growth tends to move with industrial capex cycles and regulatory tightening rather than smooth linear trends. Assumptions on adoption and pricing were adjusted using primary feedback on technology shifts (for example, changes in infrared or electrochemical sensor mix) and on whether service and calibration contracts are bundled or purchased separately in each region.
Data Validation & Update Cycle
Outputs are validated through consistency checks that compare modeled totals with independent signals such as industrial production direction, major project commissioning activity, and import trends for safety sensing equipment. When variances show up by region or end user, the working file is reviewed again, and follow-up calls are triggered to re-check the underlying adoption, replacement, or pricing assumptions.
Before sign-off, the model is reviewed in multiple steps so inputs, conversions, and currency treatments remain consistent across years. Reports are refreshed annually, and interim updates are made when major events materially change demand drivers, such as new safety mandates, sharp industrial slowdowns, or step changes in energy investment. Right before delivery, a final pass is completed so clients receive the most current view based on the latest available data and re-validations.
Mordor Intelligence's Gas Detection System Market Size Compared With Other Published Estimates
Published market sizes for gas detection systems can differ more than people expect, even when sources focus on safety monitoring equipment. The spread usually comes from how each source draws the line between systems, detectors, and services, and also from the year selected as the starting point for the forecast.
By tracking installed-base replacement cycles, calibration-driven refresh needs, and end-user adoption by detector type, Mordor Intelligence keeps the 2025 value tied to system-only demand and avoids inflating totals with broader fire-and-gas bundles or adjacent sensing categories.
Benchmark comparison
| Source | Market Size | Gaps in Research Methodology |
|---|---|---|
| Mordor Intelligence | USD 5.61 B (2025) | |
| Industry Research Publisher A | USD 6.39 B (2025) | Uses a wider equipment boundary that can include broader gas detection equipment categories beyond system-level deployments, and it also applies a higher growth curve from a 2024 base year. |
| Global Research Publisher B | USD 6.14 B (2025) | Builds from a 2024 estimated base and appears to include a broader equipment scope, which can pull in stand-alone detectors and related hardware that are not always sold as part of a gas detection system. |
The comparison mainly points to scope and boundary decisions, rather than a disagreement on the direction of demand. When the model is anchored to system deployments, replacement cadence, and realistic pricing by use case, the result becomes easier to trace back to real purchase behavior and to reproduce in future updates.
Key Questions Answered in the Report
What is the current size of the gas detection system market?
The gas detection system market stands at USD 5.88 billion in 2026.
How fast is the gas detection system market expected to grow?
It is forecast to expand at a 4.86% CAGR, reaching USD 7.46 billion by 2031.
Which region is growing the quickest?
Asia-Pacific shows the fastest regional CAGR of 5.62% through 2031 due to mandatory IIoT safety upgrades and industrial expansion.
What technology segment is outperforming others?
Infrared sensor technology is projected to post the highest 6.84% CAGR thanks to greater stability and lower maintenance demands.