Gas Chromatography Market Size and Share
Market Overview
| Study Period | 2020 - 2031 |
|---|---|
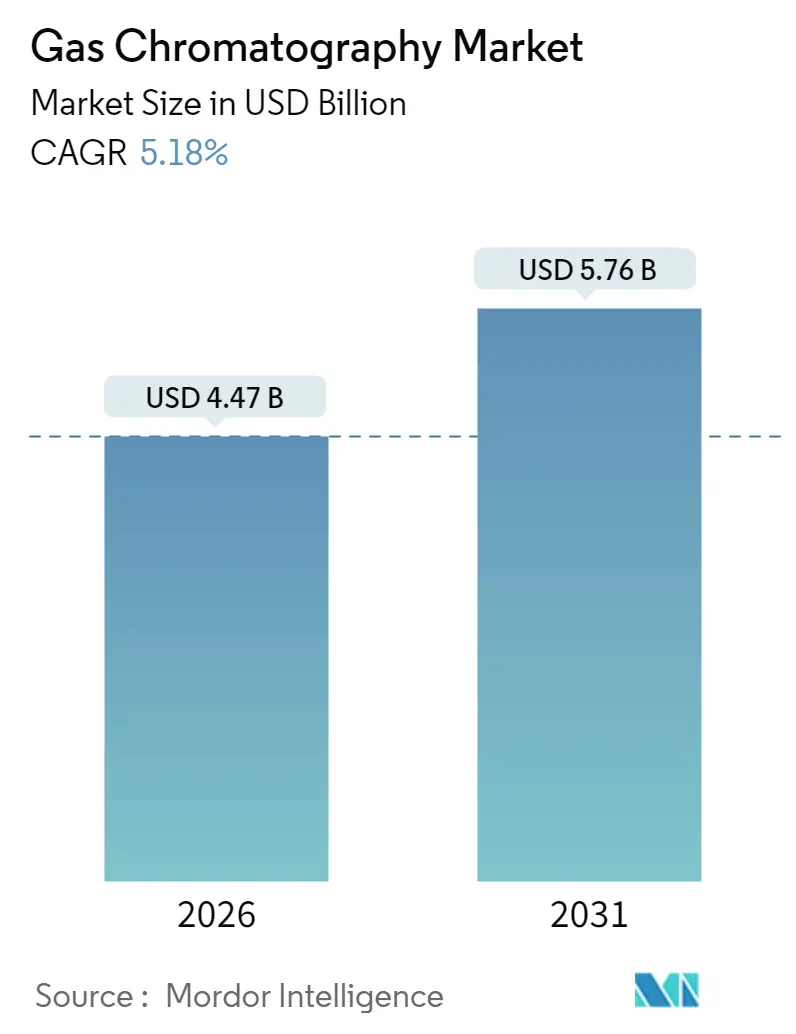
| Market Size (2026) | USD 4.47 Billion |
| Market Size (2031) | USD 5.76 Billion |
| Growth Rate (2026 - 2031) | 5.18% CAGR |
| Fastest Growing Market | Asia Pacific |
| Largest Market | North America |
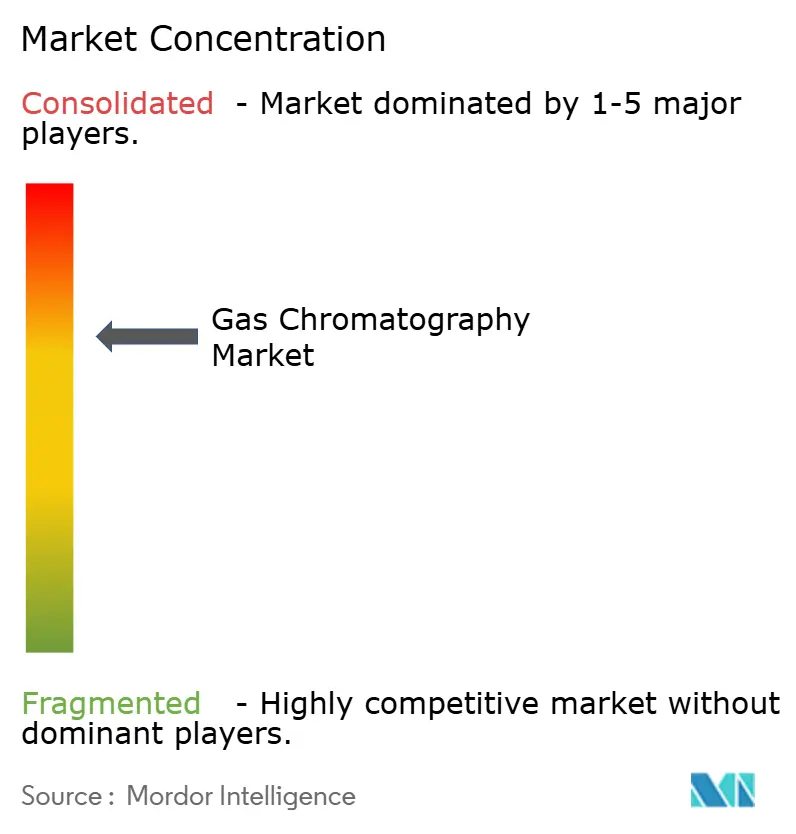
| Market Concentration | Medium |
Major Players *Disclaimer: Major Players sorted in no particular order Image © Mordor Intelligence. Reuse requires attribution under CC BY 4.0. | |
Gas Chromatography Market Analysis by Mordor Intelligence
Gas Chromatography Market size in 2026 is estimated at $4.47 billion, growing from 2025 value of $4.25 billion with 2031 projections showing USD 5.76 billion, growing at 5.18% CAGR over 2026-2031.
Heightened regulatory scrutiny in environmental and pharmaceutical testing, rapid technology upgrades such as hydrogen-ready systems, and proactive supply-chain strategies around carrier gases underpin this steady trajectory. Laboratories worldwide are moving from helium to hydrogen and nitrogen, trimming operating costs while reducing dependence on scarce noble gas supplies. Integrations with mass spectrometry now dominate capital‐spending agendas because they condense separation and identification into a single run, accelerating throughput and improving data integrity. Portable and micro-GC units are reshaping field analytics, and accessory innovations, particularly gas generators and low-phase-ratio capillary columns, signal that sustainable, autonomous operations will define competitive advantage through 2030.
Key Report Takeaways
- By instrument type, systems led with 38.12% revenue share in 2025, while portable and micro-GC platforms are projected to grow at 9.25% CAGR through 2031.
- By accessories & consumables, columns commanded 45.88% of the gas chromatography market share in 2025, whereas gas generators are on track for an 8.28% CAGR to 2031.
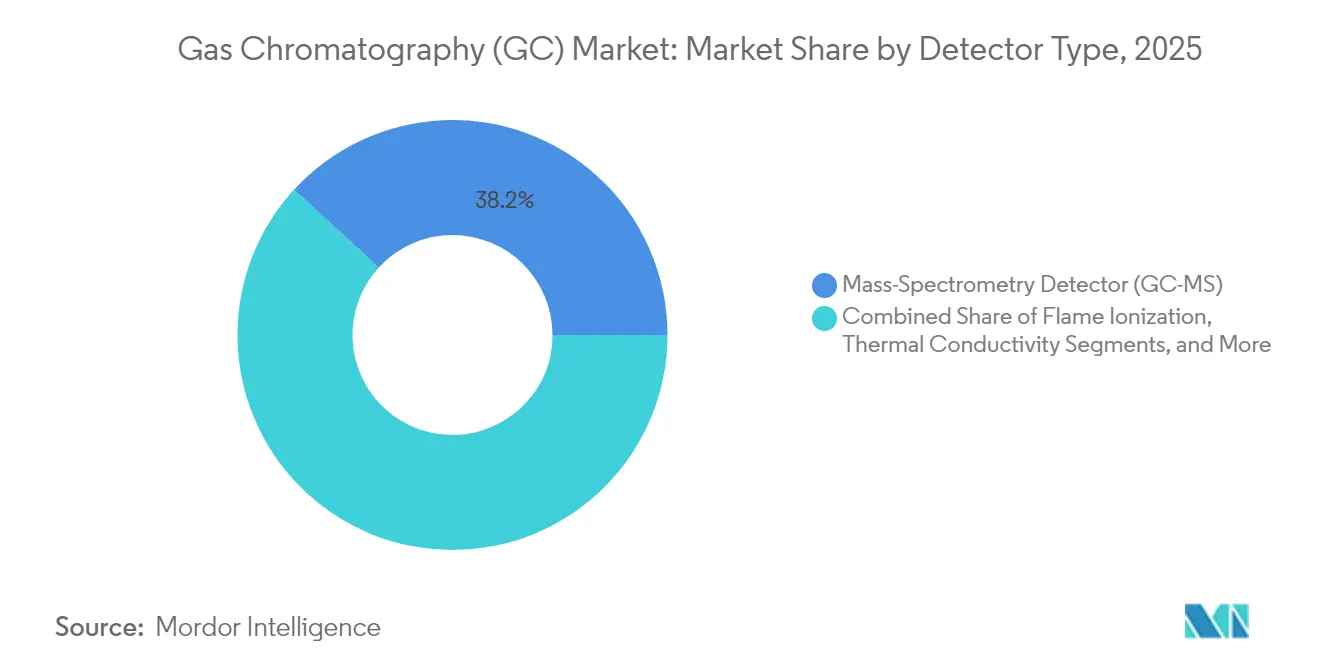
- By detector, flame ionization units accounted for 31.45% share of the gas chromatography market size in 2025, while mass spectrometry detectors are expanding at 9.84% CAGR through 2031.
- By end user, pharmaceutical and biotechnology companies each held 29.60% share in 2025; environmental agencies record the fastest-rising demand with a 8.97% CAGR.
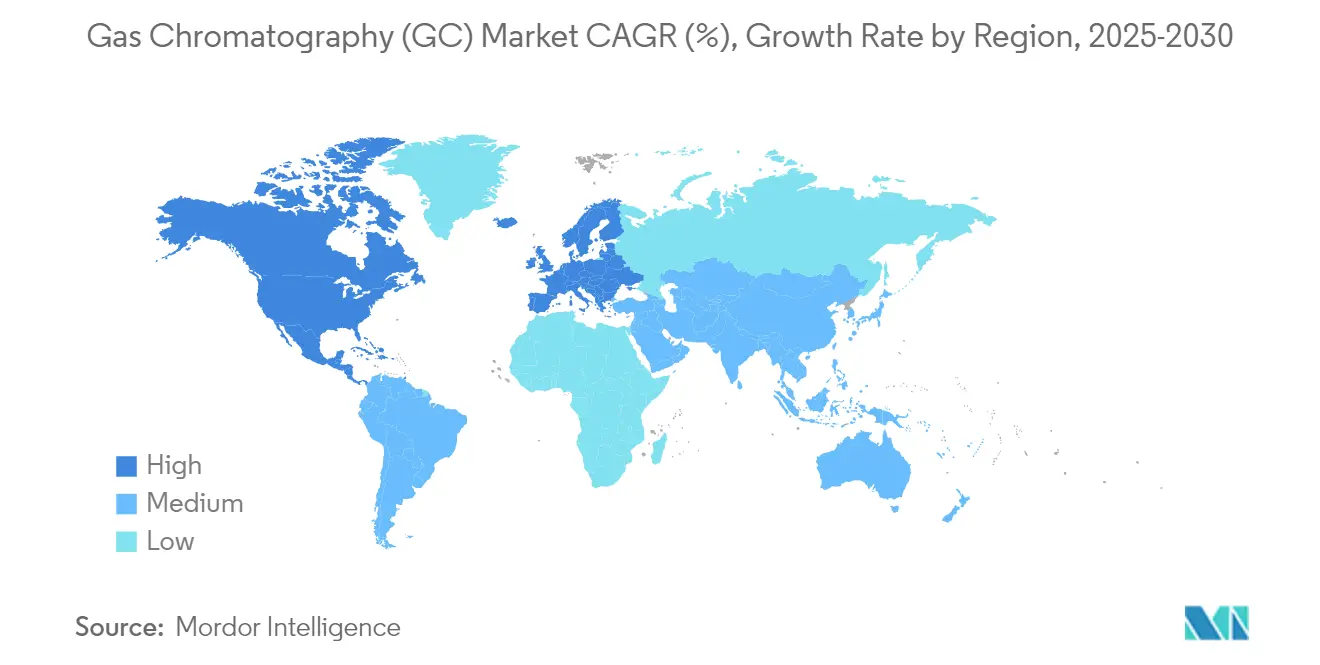
- By geography, North America captured 35.98% of the gas chromatography market in 2025, whereas Asia Pacific is advancing at an 8.29% CAGR through 2031.
Note: Market size and forecast figures in this report are generated using Mordor Intelligence’s proprietary estimation framework, updated with the latest available data and insights as of January 2026.
Global Gas Chromatography Market Trends and Insights
Drivers Impact Analysis
| Driver | (~) % Impact on CAGR Forecast | Geographic Relevance | Impact Timeline |
|---|---|---|---|
| Rising adoption of GC-MS workflows | +1.20% | Global, stronger in North America & Europe | Medium term (2–4 years) |
| Growing role of GC in drug-approval quality controls | +0.90% | Global, concentrated in pharmaceutical hubs | Long term (≥ 4 years) |
| Expansion of shale-gas & petrochemical analytics | +0.80% | North America, Middle East, Asia Pacific | Medium term (2–4 years) |
| Stringent air & water-quality regulations worldwide | +1.10% | Global, led by EU and North America | Long term (≥ 4 years) |
| Shift to hydrogen carrier gas amid global helium shortage | +0.70% | Global | Short term (≤ 2 years) |
| Surge in PFAS/micro-plastic monitoring requirements | +0.60% | North America, Europe, expanding Asia Pacific | Medium term (2–4 years) |
| Source: Mordor Intelligence | |||
Rising Adoption of GC-MS Workflows
Linking gas chromatography with mass spectrometry is now standard practice across regulated industries. Pharmaceutical pipelines rely on GC-MS for impurity profiling, and more than 80% of new-drug dossiers reference integrated chromatography data systems. Environmental agencies use GC-MS to detect contaminants at trace levels, and developments such as atmospheric pressure chemical ionization push sensitivity even further.[1]Journal of the American Society for Mass Spectrometry, “Advances in APCI-GC-MS,” jasms.org These combined capabilities shorten sample preparation steps, free analyst time, and meet regulators’ data-integrity demands, reinforcing the momentum of the gas chromatography market.
Growing Role of GC in Drug-Approval Quality Controls
Stringent process analytical technology guidance from the FDA mandates real-time monitoring, driving investment in rugged GC units that can run continuously on production floors.[2]U.S. Food & Drug Administration, “Process Analytical Technology Guidance,” fda.gov Two-dimensional GC and automated impurity quantitation address increasingly complex biologic formulations, while machine-learning algorithms accelerate peak identification, reinforcing GC’s role in fast-tracking approvals, across the gas chromatography market.
Expansion of Shale-Gas & Petrochemical Analytics
Unconventional energy production depends on real-time GC measurements of volatile organic compounds to comply with EPA emission rules.[3]U.S. Bureau of Labor Statistics, “Occupational Employment and Wage Statistics: Chemists and Materials Scientists,” bls.gov Emerging markets for synthetic aviation fuels and hydrogen blends require bespoke methods, prompting vendors to bundle microreactor add-ons and MEMS-based analyzers for at-line use, further expanding opportunities within the gas chromatography market.
Stringent Air & Water-Quality Regulations Worldwide
PFAS limits as low as 4 ng/L in U.S. drinking water oblige laboratories to attain parts-per-trillion detection performance. The European Union’s pesticide residue alerts similarly push demand for high-sensitivity GC systems, while mandatory gasoline-terminal monitoring drives continuous online GC deployments.
Restraints Impact Analysis
| Restraint | (~) % Impact on CAGR Forecast | Geographic Relevance | Impact Timeline |
|---|---|---|---|
| High capital expenditure for advanced GC platforms | -0.80% | Global, more pronounced in emerging markets | Short term (≤ 2 years) |
| Shortage of trained chromatographers | -0.60% | Global, acute in North America & Europe | Long term (≥ 4 years) |
| Supply-chain volatility for helium impacting uptime | -0.50% | Global, with higher impact in regions dependent on imported helium | Medium term (2-4 years) |
| Emission-control compliance costs for GC solvents | -0.30% | North America & Europe, expanding to Asia Pacific | Medium term (2-4 years) |
| Source: Mordor Intelligence | |||
High Capital Expenditure for Advanced GC Platforms
Comprehensive two-dimensional GC-MS systems can top USD 500,000 per unit, and installation plus service contracts can add 30% to total spend. Smaller laboratories delay upgrades, yet leasing programs and shared-instrument initiatives are gaining momentum, softening the financial barrier and supporting broader access across the gas chromatography market.
Shortage of Trained Chromatographers
Testing labs employ 164,490 professionals in the United States, yet vacancies persist as veteran analysts retire faster than universities train replacements.[3] Vendors are responding with intuitive software, automated troubleshooting, and dedicated training centers that compress learning curves.
Segment Analysis
By Instrument Type: Portable Systems Drive Field Analytics
Systems remained the workhorse, contributing 38.12% to 2025 revenue. The gas chromatography market size for these benchtop units will continue to rise, propelled by replacement cycles and integrated detectors. Portable and micro-GC instruments, growing at 9.25% CAGR, meet on-site monitoring needs in emergency response, mining, and fuel distribution. Devices such as the FLIR Griffin G510 deliver laboratory-grade detection in rugged housing. Field deployability saves sample-handling time and supports real-time decision making. Laboratories also add auto-samplers to close skill gaps and standardize throughput, while fraction collectors carve niches in preparative workflows. Detector upgrades and MEMS-based innovations extend analytics to previously inaccessible environments, reinforcing the relevance of portable systems within the gas chromatography market.
A parallel trend is the miniaturization of high-performance modules: on-column heaters, micro-injectors, and rapid cooling designs shrink physical footprints while maintaining chromatographic resolution. The preference for hydrogen carrier gas aligns with portable power budgets and environmental objectives, reinforcing demand for hydrogen-ready micro-GCs. Continuous cost improvements suggest portable platforms will capture a growing slice of gas chromatography market share over the next five years.

Note: Segment shares of all individual segments available upon report purchase
By Accessories & Consumables: Gas Generators Transform Supply Chains
Columns captured 45.88% of the 2025 spend, reflecting their status as consumables with predictable replacement intervals. Low-phase-ratio capillary innovations improve inertness and peak shape for volatile sulfur compounds. Gas generators, however, are racing ahead at an 8.28% CAGR as labs swap cylinders for on-demand hydrogen, nitrogen, and zero air. PEAK Scientific’s takeover of Noblegen extends capacity and global reach in this segment. Column accessories such as guard columns and high-purity connectors keep maintenance workflows efficient. Pressure regulators made from advanced alloys withstand hydrogen service, while RFID-enabled valves automate replacement alerts. Tubing refinements cut dead volume, sharpening peak symmetry and conserving gas. As sustainability priorities climb, premium consumables that reduce waste and extend instrument uptime earn price premiums, directly influencing the gas chromatography market.
By Detector Type: Mass Spectrometry Dominates Innovation
Flame ionization detectors still own 31.45% of detector revenue in 2025 because they are rugged, affordable, and universal for hydrocarbons. Mass spectrometry attachments expand to a 9.84% CAGR, converting existing GCs into hybrid separation-identification platforms. Thermo Fisher’s Stellar mass spectrometer underscores the priority on fast throughput for translational omics. Labs retire older electron-capture detectors in favor of MS or vacuum UV options such as Agilent’s LUMA for better sensitivity toward halogenated pollutants. Ion mobility add-ons further resolve isomers, an advantage for environmental forensics. Thermal conductivity and chemiluminescence detectors occupy specialist niches, but forward R&D dollars overwhelmingly favor selective, high-resolution MS technologies that lift analytical certainty and compliance confidence.
Note: Segment shares of all individual segments available upon report purchase
By End User: Environmental Agencies Lead Growth
Pharmaceutical and biotechnology companies account for 29.60% of current demand, reflecting legacy usage patterns. Environmental and wastewater authorities register the strongest expansion tempo at 8.97% CAGR. PFAS regulations, microplastic surveillance, and air toxics compliance require trace-level sensitivity that only GC-MS or GC-IMS systems can deliver. Food and beverage producers escalate pesticide testing, adopting QuEChERS extraction and GC-MS/MS to clear export inspections. Academic centers upgrade to handle multi-omics projects, while forensic and clinical labs introduce steroidomics and toxicology workflows. This diversification boosts resilience while pushing the gas chromatography market toward integrated service models such as instrument-as-a-service subscriptions.
Geography Analysis
North America contributes 35.98% of global revenue in 2025, anchored by robust EPA mandates, strong pharmaceutical output, and a deep bench of analytically intensive industries. Thermo Fisher’s USD 2 billion domestic expansion plan asserts confidence in sustained equipment demand. The United States enforces PFAS drinking-water limits that require sub-parts-per-trillion detection, driving laboratory upgrades and new installations. Canada and Mexico supplement growth via petrochemical outputs and harmonized environmental protocols, ensuring replacement cycles stay active throughout the forecast window.
Europe maintains second-tier leadership through far-reaching environmental directives and stringent food-safety regulations. Union-wide pesticide residue controls and vigorous microplastic initiatives elevate demand for sensitive GC platforms, and hydrogen conversion incentives align with regional energy goals. Germany, the United Kingdom, and France dominate orders, while Italy and Spain grow through agricultural quality testing. The European market rewards low-power, hydrogen-optimized instruments and integrated data integrity modules that simplify compliance with GDPR and GMP provisions.
Asia Pacific records the fastest trajectory at 8.29% CAGR, driven by industrialization, rising pharmaceutical output, and progressive monitoring laws. China remains the largest contributor, though vendor sales fluctuated amid macroeconomic headwinds. Japan and India accelerate demand through clean-energy programs and API manufacturing scale-up. South Korea invests in high-tech industries requiring ultra-trace analytics, whereas Australia’s mining sector adopts portable GC units for site survey efficiency. Technology transfer, local production, and government funding schemes expand the addressable base, cementing the region’s role in future gas chromatography market growth.
Middle East and Africa register emerging momentum as petrochemical complexes modernize quality labs. GCC investments in refinery upgrades and hydrogen production translate into steady instrument orders, while South Africa’s mining and chemicals sectors rely on GC platforms for process control. Economic variance tempers short-term volumes, but regional alignment with international standards fosters gradual adoption.
South America presents moderate yet stable expansion. Brazil’s pharmaceutical and petrochemical clusters anchor orders, and Argentine agribusiness drives pesticide residue testing. Regional trade pacts ease cross-border equipment movement, and Chilean copper operations integrate online GC systems for emission compliance. Currency swings and political shifts add volatility, but local distributors offset risk by offering financing and maintenance contracts.
Competitive Landscape
The gas chromatography market is moderately fragmented. Established brands pursue differentiation via automation, carrier-gas flexibility, and vertically integrated service portfolios. Consolidation continues: PEAK Scientific’s acquisition of Noblegen fortifies its hydrogen and nitrogen generator range. Vendors bundle instruments with consumables and cloud software, creating recurring revenue and lock-in. Portable systems receive disproportionate R&D funding, while benchtop platforms gain features like AI-assisted troubleshooting and predictive maintenance dashboards. Companies that foreground sustainability, lower power draw, hydrogen compatibility, and recyclable consumables gain traction in procurement evaluations, especially within public-sector laboratories.
Tier-one suppliers expand factory footprints to protect supply chains. Thermo Fisher’s multiyear U.S. investment earmarks USD 500 million for R&D that spans environmental, life-science, and industrial domains. Shimadzu’s acquisition of microreactor IP strengthens green transformation credentials, targeting hydrogen and biofuel analytics. Waters inaugurated a Bangalore capability center to cultivate Asia Pacific innovation. These moves signal a strategic pivot toward regionalized manufacturing and distributed R&D.
Service differentiation now complements hardware excellence. Vendors roll out remote diagnostics, automated firmware updates, and subscription-based application support. Training academies mitigate the chromatographer shortage, while cross-platform method libraries ease carrier-gas conversion. Compliance-ready e-records and cybersecurity features appeal to pharmaceutical clients subject to data-integrity audits. Collectively, these initiatives shape a competitive mosaic where technological support and operational resilience define leadership as much as instrument specifications.
Gas Chromatography Industry Leaders
Agilent Technologies, Inc.
Thermo Fisher Scientific, Inc.
Danaher Corporation
Merck KgaA
PerkinElmer, Inc.
- *Disclaimer: Major Players sorted in no particular order
Recent Industry Developments
- April 2025: Thermo Fisher Scientific committed USD 2 billion over four years to expand U.S. manufacturing and R&D, allocating USD 1.5 billion to capital projects and USD 500 million to life-science instrument innovation.
- March 2025: Cytiva and Pall pledged USD 1.5 billion to enlarge chromatography resin capacity across 13 U.S. and UK sites, adding 2,000 jobs.
- February 2025: Shimadzu Corporation acquired the catalyst microreactor line from Activated Research Company, integrating Jetanizer and Polyarc IP to improve GC sensitivity while eliminating helium dependence.
- February 2025: PEAK Scientific purchased Wirac Automation (Noblegen) to widen its nitrogen, hydrogen, and zero air generator offerings for gas chromatography applications.
- June 2025: Agilent Technologies launched the 7010D Triple Quadrupole GC/MS system with HES 2.0 ion source and compliance features for food and environmental labs.
Research Methodology Framework and Report Scope
Market Definitions and Key Coverage
Our study defines the gas chromatography (GC) market as global revenue from new GC systems, detectors, autosamplers, portable or micro-GC units, analytical columns, carrier-gas generators, and high-turn consumables that separate and quantify volatile compounds in pharmaceutical, petrochemical, environmental, food, and academic laboratories.
Scope exclusion: service contracts, refurbished equipment, and chromatography reagents.
Segmentation Overview
- By Instrument Type
- Systems
- Detectors
- Auto-samplers
- Fraction Collectors
- Micro & Portable GC
- Other Instruments
- By Accessories & Consumables
- Columns
- Column Accessories
- Pressure Regulators
- Gas Generators
- Fittings & Tubing
- Others
- By Detector Type
- Flame Ionization Detector (FID)
- Thermal Conductivity Detector (TCD)
- Electron Capture Detector (ECD)
- Mass-Spectrometry Detector (GC-MS)
- Others
- By End User
- Pharmaceutical & Biotechnology Companies
- Oil & Gas / Petrochemical Industry
- Environmental & Waste-water Agencies
- Food & Beverage Industry
- Academic & Government Research Institutes
- Others
- By Geography
- North America
- United States
- Canada
- Mexico
- Europe
- Germany
- United Kingdom
- France
- Italy
- Spain
- Rest of Europe
- Asia Pacific
- China
- Japan
- India
- South Korea
- Australia
- Rest of Asia Pacific
- Middle East and Africa
- GCC
- South Africa
- Rest of Middle East and Africa
- South America
- Brazil
- Argentina
- Rest of South America
- North America
Detailed Research Methodology and Data Validation
Primary Research
We spoke with GC application scientists, drug-plant quality heads, refinery buyers, and environmental officers in North America, Europe, and Asia-Pacific. Their insight on usage rates, carrier-gas switches, and price concessions tightened assumptions that desk work alone could not settle.
Desk Research
We begin with open datasets such as the US EPA air-emission registry, ECHA REACH dossiers, WHO water guidelines, UN Comtrade HS-9027 flows, and PubMed papers. Public company 10-Ks, investor decks, and customs data reveal shipment volumes and pricing shifts. Mordor analysts smooth anomalies across years and enrich gaps using D&B Hoovers financial snapshots and Questel patent counts. The sources listed illustrate our approach; many additional publications informed checks.
Market-Sizing & Forecasting
A top-down build from production and trade statistics sets the opening total. Then, sampled supplier roll-ups and channel price scans test the figure. Key variables like laboratory capital cycles, mandated test volumes, helium prices, pharmaceutical batch counts, and refinery throughput feed a multivariate regression through 2030. Where data run thin, we interpolate from historical replacement ratios and align outcomes with interview consensus.
Data Validation & Update Cycle
Outputs clear anomaly screens, senior peer review, and variance checks against external indicators. Reports refresh once a year, and mid-cycle updates follow material events; an analyst reruns the model before every delivery.
Why Mordor's Gas Chromatography Baseline Earns Decision-Maker Trust
Published estimates differ because providers blend distinct product baskets, price years, and refresh tempos.
According to Mordor Intelligence, anchoring on a narrow hardware scope and disciplined variables produces the most dependable baseline.
Benchmark comparison
| Market Size | Anonymized source | Primary gap driver |
|---|---|---|
| USD 4.25 B (2025) | Mordor Intelligence | |
| USD 4.05 B (2024) | Global Consultancy A | counts reagents and service bundles |
| USD 3.50 B (2025) | Trade Journal B | excludes portable GC equipment |
We're confident our annually refreshed, driver-grounded approach offers a balanced midpoint users can trace to clear inputs and repeatable steps.
Key Questions Answered in the Report
What is the current value of the gas chromatography market?
The market is valued at USD 4.47 billion in 2026 and is projected to reach USD 5.76 billion by 2031, growing at a 5.18% CAGR.
Which region holds the largest gas chromatography market share?
North America leads with 35.98% of global revenue in 2025 thanks to strict environmental and pharmaceutical regulations.
Why are laboratories shifting from helium to hydrogen carrier gas?
Global helium shortages elevate costs and supply risks, while hydrogen generators cut gas expenses and enable sustainable, high-speed separations.
Which detector technology is growing fastest?
Mass spectrometry detectors are expanding at 9.84% CAGR because they combine separation and identification, essential for trace-level regulatory testing.
What end-user segment shows the highest growth?
Environmental and wastewater agencies lead with a 8.97% CAGR due to new PFAS and microplastic monitoring mandates.
How are companies addressing the shortage of trained chromatographers?
Vendors offer intuitive software, automated troubleshooting tools, and dedicated training centers, reducing onboarding time for new analysts.


