
Market Overview
| Study Period | 2020 - 2031 |
|---|---|
| Market Size (2026) | USD 14.39 Billion |
| Market Size (2031) | USD 23.14 Billion |
| Growth Rate (2026 - 2031) | 9.96 % |
| Fastest Growing Market | Asia Pacific |
| Largest Market | North America |
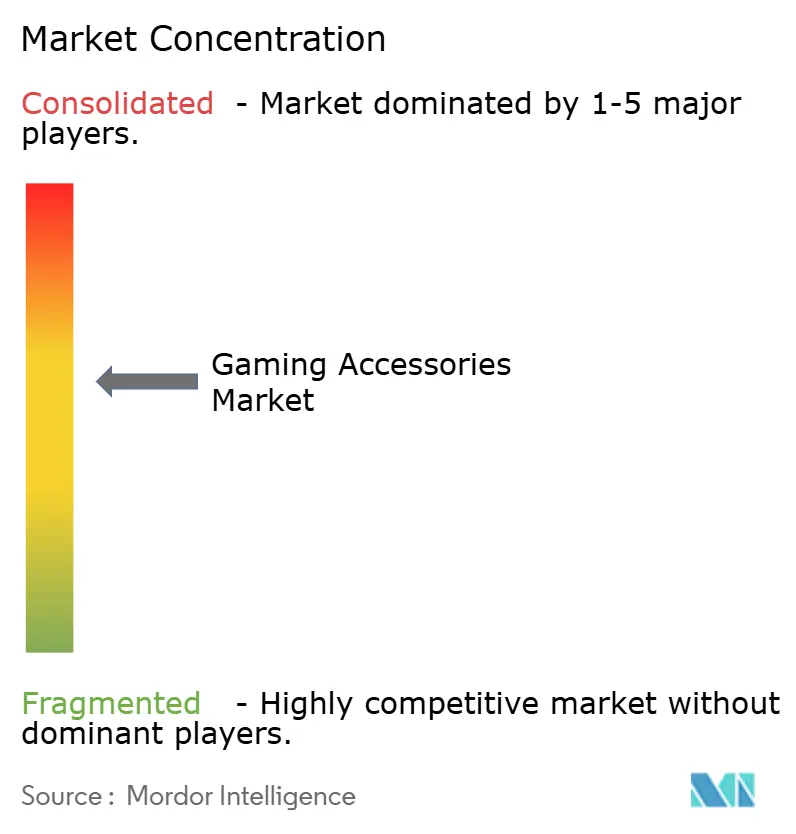
| Market Concentration | Medium |
Major Players *Disclaimer: Major Players sorted in no particular order Image © Mordor Intelligence. Reuse requires attribution under CC BY 4.0. | |
Gaming Accessories Market Analysis by Mordor Intelligence
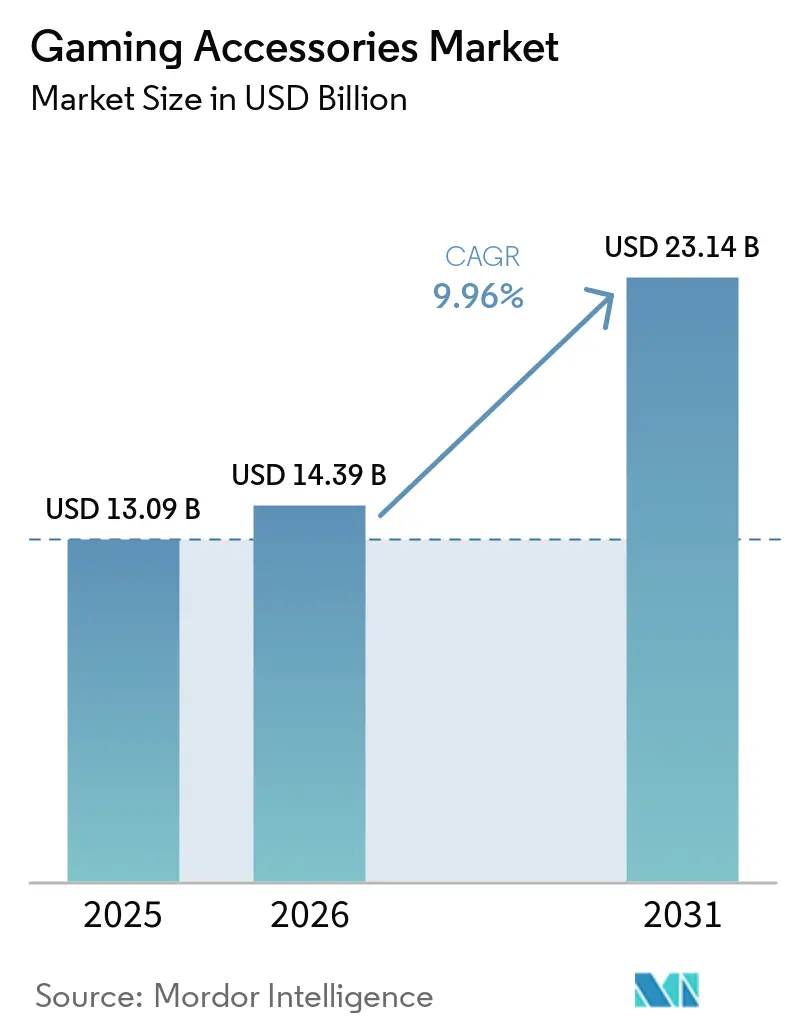
The gaming accessories market size is expected to grow from USD 13.09 billion in 2025 to USD 14.39 billion in 2026 and is forecast to reach USD 23.14 billion by 2031 at 9.96% CAGR over 2026-2031. This trajectory captured the sector’s transition from simple peripherals toward software-integrated ecosystems that united play, productivity, and content creation. Growth had been driven by the professionalization of esports, the rise of cloud gaming platforms that reduced hardware barriers, and the first wave of AI-powered peripherals that demanded low-latency interfaces. Manufacturers also responded to rising cross-platform engagement by building universal compatibility into design roadmaps, while haptic feedback and early neural-interface research pushed accessories beyond passive input toward active sensory feedback. Strategic moves-such as Corsair’s September 2024 acquisition of Fanatec-demonstrated how leading firms pursued vertical integration to secure differentiated technologies and supply-chain control.
Key Report Takeaways
- By product type, headsets led with 27.92% of gaming accessories market share in 2025 and gaming chairs recorded the fastest expansion with an 11.02% CAGR to 2031.
- By device compatibility, PC peripherals held 43.25% share of the gaming accessories market size in 2025, while mobile accessories accelerated at a 12.11% CAGR through 2031.
- By distribution channel, online retail captured 55.38% revenue share in 2025 and expanded at a 12.86% CAGR to 2031.
- By price range, mid-range equipment accounted for 46.25% of the gaming accessories market size in 2025, whereas premium devices advanced at a 13.03% CAGR through 2031.
- By geography, North America commanded 31.74% share in 2025; Asia Pacific grew at a 12.21% CAGR to 2031.
Note: Market size and forecast figures in this report are generated using Mordor Intelligence’s proprietary estimation framework, updated with the latest available data and insights as of 2026.
Market Trends and Insights
Drivers Impact Analysis of Gaming Accessories Market*
| Driver | (~) % Impact on CAGR Forecast | Geographic Relevance | Impact Timeline |
|---|---|---|---|
| Surge in global gamer population and e-sports viewership | +2.8% | Global, with concentration in North America and Asia Pacific | Medium term (2-4 years) |
| Continuous product innovation (RGB, haptics, wireless) | +2.1% | Global, led by North America and Europe | Long term (≥ 4 years) |
| Expansion of cloud gaming and cross-platform ecosystems | +1.9% | Global, early adoption in North America and Europe | Long term (≥ 4 years) |
| Growing disposable income in emerging economies | +1.7% | Asia Pacific core, spill-over to Middle east and Africa and Latin America | Medium term (2-4 years) |
| Ergonomic regulations spurring demand for gaming chairs | +1.2% | Europe and North America, expanding to Asia Pacific | Medium term (2-4 years) |
| Aesthetic-centric accessories for female gamer segment | +0.8% | Global, strongest in North America and Europe | Short term (≤ 2 years) |
| Source: Mordor Intelligence | |||
Surge in Global Gamer Population and Esports Viewership
Competitive gaming participation had soared and transformed premium peripherals into mainstream expectations. When global esports revenue approached USD 4.3 billion in 2024, livestreamed tournaments showcased professional setups that casual players emulated.[1]Educational institutions likewise adopted standardized equipment, embedding high-performance headsets, keyboards, and mice into curricula. This professionalization placed millisecond-level precision at the center of purchasing decisions and sustained demand for low-latency interfaces. The demonstration effect widened the addressable base and lengthened replacement cycles as performance-oriented amateurs sought tournament-grade technology.
Continuous Product Innovation (RGB, Haptics, Wireless)
Peripherals evolved past ornamental features into functional performance drivers. Wireless headsets and mice delivered wired-class latency, freeing desk space and improving ergonomics. Haptic feedback advanced beyond vibration; research teams at Northwestern Engineering unveiled flexible wireless devices that simulated twisting and pressure sensations, opening paths to richer spatial awareness in games.[2] RGB lighting moved from decoration to real-time telemetry, signaling game status or device health. For manufacturers, such layered functionality prolonged product relevance in a market where commoditization pressure shortened lifecycles.
Expansion of Cloud Gaming and Cross-Platform Ecosystems
Cloud gaming lowered entry costs for high-fidelity play but raised expectations around universal accessory support. Microsoft enabled mouse-and-keyboard functionality for 26 Xbox Cloud Gaming titles in 2024, confirming a convergence trend that redefined “console” boundaries.[3]Gamers increasingly demanded seamless peripheral profiles across PC, console, and mobile sessions. Vendors answered with firmware that detected host platforms automatically and preserved user preferences in onboard memory, streamlining transitions between work and play.
Growing Disposable Income in Emerging Economies
Rapid income growth across Asia Pacific strengthened unit demand, particularly in India, where the domestic games market was projected to reach USD 9.2 billion by 2029 with 591 million active players. The audience skewed young, featured 44% female participation, and expanded beyond major metros, signaling a broad consumer base. As 5G networks rolled out, mobile esports leagues flourished and created fresh demand for controllers, cooling docks, and latency-optimized earbuds tailored to smartphone play.
Restraints Impact Analysis of Gaming Accessories Market*
| Restraint | (~) % Impact on CAGR Forecast | Geographic Relevance | Impact Timeline |
|---|---|---|---|
| High import tariffs on electronics | -1.8% | Global, acute impact in United States and China trade | Short term (≤ 2 years) |
| Product commoditization and short replacement cycles | -1.4% | Global, most pronounced in mature markets | Medium term (2-4 years) |
| Semiconductor and sensor supply-chain constraints | -1.1% | Global, concentrated in Asia-Pacific manufacturing hubs | Short term (≤ 2 years) |
| E-waste policies increasing compliance costs | -0.7% | Europe and North America, expanding globally | Long term (≥ 4 years) |
| Source: Mordor Intelligence | |||
High Import Tariffs on Electronics
Trade tensions imposed sudden cost hikes on gaming hardware. In April 2025 the Nintendo Switch 2 incurred a 46% United States tariff when assembled in Vietnam, while Japanese game cards faced 24% duties. Accessory makers redirected production to tariff-free hubs, raising logistics complexity and inventory risk. The Consumer Technology Association warned that higher duties could erode American purchasing power by as much as USD 143 billion annually, curbing discretionary spending on peripherals. Some niche brands, such as 8BitDo, halted United States warehouse shipments, leaving constrained domestic stocks and pushing prices upward.
Product Commoditization and Short Replacement Cycles
As multi-platform compatibility became standard, differentiation shifted toward incremental DPI gains or lighter chassis designs. With typical replacement windows of 12-18 months, R&D expenses climbed even as retail prices faced discount pressure. Smaller firms lacking scale turned into acquisition targets for conglomerates seeking novel IP. Vertical integration, exemplified by Corsair’s 2024 move into simulation gear, illustrated how scale players shored up margins by broadening portfolios and internalizing core components.
*Our forecasts treat driver/restraint impacts as directional, not additive. The impact forecasts reflect baseline growth, mix effects, and variable interactions.
Gaming Accessories Market Segment Analysis
By Product Type:
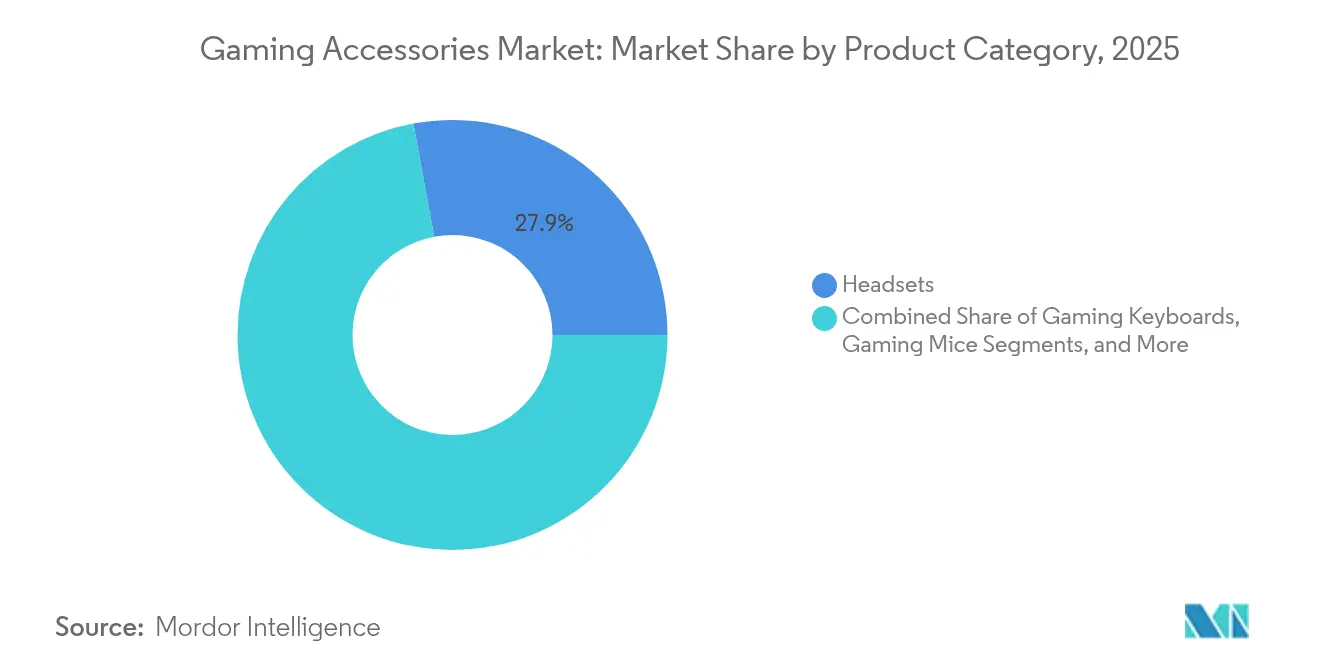
Headsets Anchored Revenue while Gaming Chairs AcceleratedHeadsets captured 27.92% gaming accessories market share in 2025 as directional audio and clear voice chat remained decisive in competitive play. The segment’s dominance had been reinforced by noise-canceling microphones and spatial-sound firmware that mimicked tournament conditions. Gaming chairs showed an 11.02% CAGR to 2031, propelled by workplace-safety rules that mandated ergonomic seating for streamers and content creators who spent extended hours online. Keyboard and mouse categories held steady as established staples, with mechanical keyboard designs and optical-switch advancements trimming actuation times. Controllers, mouse pads, and cable-management kits filled ecosystem needs and leveraged cross-selling. Razer’s 2025 Skibidi headset, with on-board AI language translation, signaled the next frontier where software features rather than raw drivers defined value.
Immersive seating followed a similar trajectory; Project Carol prototypes integrated near-field surround sound and haptics directly into chair headrests, elevating furniture from passive support into sensory portals. Such innovations hinted that future differentiation would revolve around firmware updates, cloud-linked profiles, and machine-learning-driven personalization, extending product life and fostering subscription add-ons.

By Device Compatibility:
PC Leadership Faced Mobile MomentumPC peripherals held 43.25% share of the gaming accessories market size in 2025, benefiting from content-creation workflows that demanded macro-rich keyboards and adjustable-weight mice. Yet mobile-focused gear recorded a 12.11% CAGR through 2031, backed by competitive smartphone titles and telco-sponsored leagues. Console accessories maintained stable demand tied to the PlayStation and Xbox installed bases, while cross-platform devices gained traction among households juggling multiple gaming endpoints. The gaming accessories market experienced tightening latency requirements as cloud platforms compressed response envelopes, spurring investment in high-polling-rate wireless dongles that worked interchangeably across PC rigs, handheld consoles, and smart TVs.
Manufacturers bundled firmware suites that detected host systems and reconfigured sensitivity curves on the fly. Logitech’s 2024 MX Ink stylus, built for Meta Quest, illustrated how hybrid creative-gaming use cases blurred device lines. Looking ahead, PC strongholds could erode if cloud services fully decoupled local processing from input responsiveness.
By Distribution Channel:
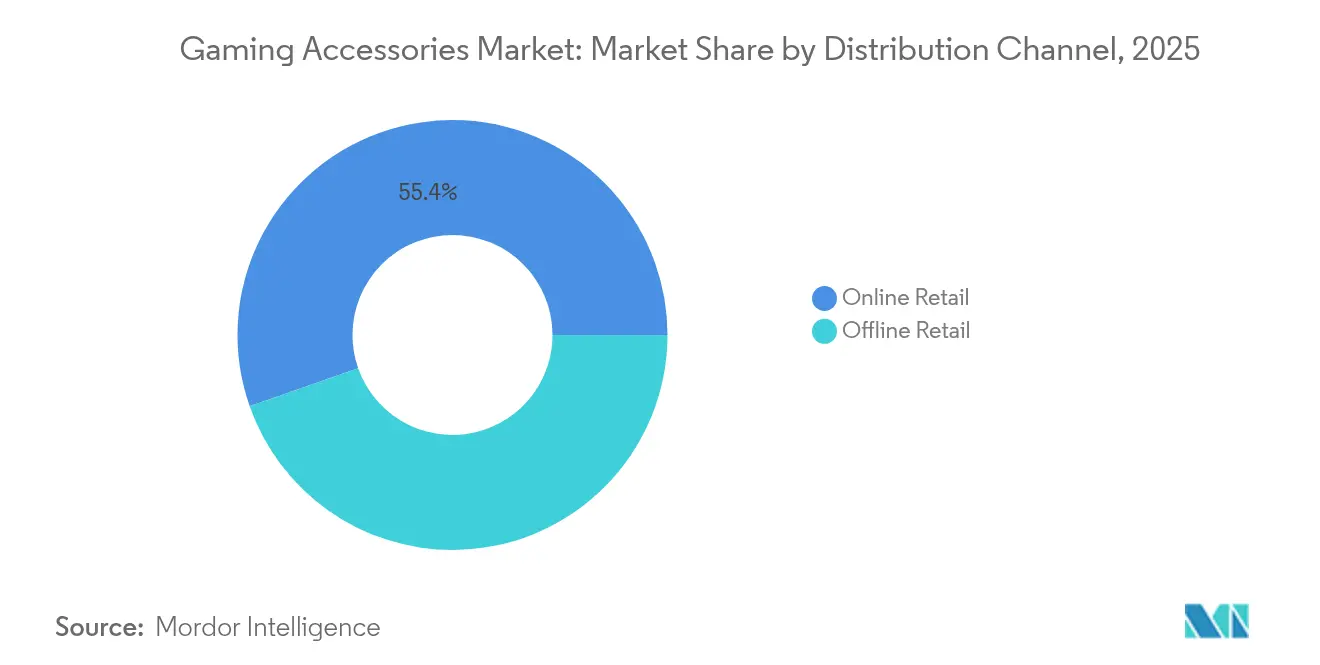
Online Retail Strengthened LeadOnline retailers owned 55.38% market share in 2025 and grew at 12.86% CAGR, as comparison shopping, influencer reviews, and customization tools steered buyers toward digital carts. Direct-to-consumer portals enabled firms like SCUF Gaming to offer real-time configurators, handling pandemic-era surges without compromising satisfaction. Specialty gaming storefronts retained relevance for high-ticket purchases by providing demos, while big-box electronics chains focused on mainstream SKUs. E-commerce’s algorithmic merchandising surfaced niche products, extending tail sales and empowering indie brands with global reach.
Subscription shipping models for replacement ear-pads or joystick modules also gained followers, supporting predictable revenue streams and fostering brand communities centered on firmware updates and cosmetic add-ons.
By Price Range:
Mid-Tier Dominated, Premium Sped UpAccessories priced between USD 51 and 150 represented 46.25% market share in 2025, balancing value with noticeable performance gains. Premium devices above USD 150 posted a 13.03% CAGR, reflecting gamers’ willingness to chase marginal advantages and aesthetics. Economy gear under USD 50 introduced newcomers to the gaming accessories market, often serving as stepping-stones toward mid-tier upgrades. Limited-edition colorways and esports-team co-branding allowed firms to charge premiums without hardware changes, leveraging scarcity dynamics. As AI firmware unlocked adaptive profiles and real-time translation, vendors bundled software subscriptions with premium SKUs, turning peripherals into recurring-revenue gateways.
Geography Analysis
North America Gaming Accessories Market
North America’s 31.74% hold in 2025 had reflected a cohesive esports infrastructure, strong sponsorship funding, and entrenched streaming-creator cultures. Retailers benefited from coordinated launch calendars that leveraged influencer unboxings to accelerate sell-through. Tariff shocks raised landed costs in 2025, prompting inventory pooling and just-in-time restocks to minimize capital locks.
APAC Gaming Accessories Market
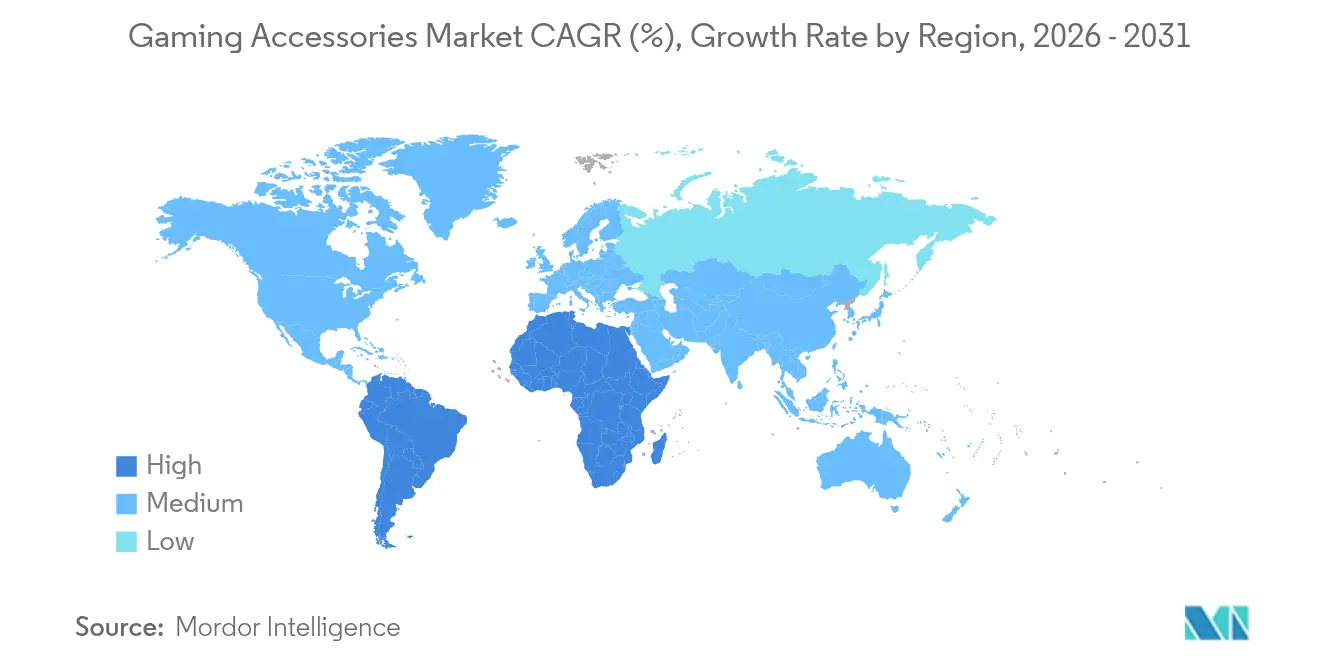
Asia Pacific’s double-digit CAGR owed much to China’s manufacturing ecosystem, which tightened design-to-delivery cycles, and to Southeast Asia’s robust mobile esports scene. Government support for tech parks in India and Malaysia fostered accessory start-ups that targeted localized aesthetics and budget ranges. Regional telcos bundled game-pass subscriptions with 5G contracts, driving controller sales bundled in welcome kits.
EMEA and LATAM Gaming Accessories Market
Europe’s market matured around ergonomic compliance. Germany enforced chair safety certifications that became de facto global benchmarks. Nordic countries prioritized sustainable materials, influencing worldwide sourcing standards. Latin American gamers gravitated toward mid-range wired devices due to higher import duties on lithium-battery products, although Argentina and Brazil began hosting regional tournaments that spurred headset upgrades. In the Middle East and Africa, premium console sales catalyzed accessory pull-through, particularly during Ramadan promotional seasons when retailers widened installment-payment options.
Regulatory Landscape
Wireless and connected gaming accessories fall under a tightening mix of RF, safety, and cybersecurity requirements across major importing regions. In the United States, the Federal Communications Commission (FCC) requires RF-emitting electronic products, including wireless headsets, controllers, and dongles, to demonstrate compliance via Supplier Declaration of Conformity or Certification prior to import and sale. In the European Union, enforcement moved beyond radio performance to connected-device security, with the Radio Equipment Directive (RED) applying cybersecurity, privacy, and fraud-prevention requirements for in-scope internet-connected radio products from August 1, 2025.
Regional compliance frictions are also increasing in emerging import markets. In Brazil, ANATEL measures referenced for wireless devices (Ato No. 18086) took effect May 25, 2026, linking customs clearance of imported wireless gaming controllers to the homologation certificate holder or an authorized representative and requiring homologation identifiers in import documentation, raising the bar for channel partners and cross-border resellers. Hearing health is an adjacent standard-setting area for headsets and earbuds: the WHO and ITU published ITU-T H.872 safe listening guidance (2025) for voluntary manufacturer adoption, which can influence product design (volume management and user warnings) as countries operationalize listening-safety policies.
Value Chain Analysis
The value chain begins with component ecosystems (switches and sensors, PCBs and microcontrollers, wireless chipsets, batteries, drivers, foam and plastics, and metals and textiles for chairs). It then runs through ODM/OEM manufacturing and final assembly, which is heavily concentrated in Asia-Pacific hubs, before splitting across global brands, software layers (device configuration, RGB/haptics control, and profiles), and distribution. Brand owners increasingly treat firmware and companion apps as part of the bill of materials because features such as low-latency wireless, on-device profiles, and AI-enabled capabilities require ongoing updates and certification management. Supply-side volatility in semiconductors and memory remains a recurring constraint, and 2026 reporting highlighted that AI data-center demand can distort availability for consumer hardware, while retail pricing for gaming hardware can lag upstream supply shifts by several months, complicating launch timing and promotional calendars.
Downstream, demand creation and sell-through are increasingly mediated by esports teams, publishers, and platform ecosystems, tightening the loop between marketing partnerships and product roadmaps. In 2026 examples include CORSAIRs three-year partnership with FaZe Esports (covering mice, keyboards, headsets, and mousepads) and Logitech Gs designation as Official PC Peripheral Partner for Call of Duty: Modern Warfare 4, which formalizes integration and co-marketing opportunities across accessories and game franchises. Adjacent simulation and enthusiast categories also use licensing to pull differentiated components and designs into the chain, illustrated by Fanatecs licensing partnership with Nissan for officially licensed sim racing steering wheels (July 2026), supporting premium attach and specialized distribution through sim-racing channels.
Competitive Landscape
Competition tightened as leading brands executed vertical integration. Corsair’s Fanatec purchase expanded its cockpit peripherals and absorbed simulationIP while preserving scale efficiencies in plastics and PCB sourcing. Logitech diversified into mixed-reality with the MX Ink stylus, signaling ambitions beyond pure gaming. Razer publicized the WYVRN ecosystem in March 2025, positioning an AI layer that unified device telemetry, voice translation, and adaptive lighting across its catalog.
Strategic partnerships illustrated brand-equity battles: 100 Gamers selected Razer as headset and chair provider in June 2025, while FURIA secured Logitech G support the same month, reinforcing Latin American outreach. Turtle Beach amplified modularity by releasing the USD 209.99 Victrix Pro BFG Reloaded controller with Hall-effect thumbsticks, highlighting a shift toward drift-resistant components. Patent filings around low-power haptic coils and glove-based feedback hinted at future directions. Supply-chain resilience became a differentiator; vendors with tier-one chip alliances weathered sensor shortages better and aligned launch windows with GPU cycles to capture halo effects from major PC releases.
Forecast consolidation may intensify as rising firmware complexity favors companies with in-house software teams. Mid-sized contenders will likely attract acquisition offers if they possess proprietary connectivity stacks or niche ergonomic patents. Sustainability credentials gained mindshare; recycled-aluminum chassis and biodegradable packaging became table stakes in Europe and advanced marketing levers elsewhere.
Gaming Accessories Industry Leaders
-
Logitech International SA
-
Razer Inc.
-
Mad Catz Global Limited
-
Turtle Beach Corporation
-
Dell Technologies Inc. (Alienware)
- *Disclaimer: Major Players sorted in no particular order
Gaming Accessories Market Companies Covered in this Report
- Corsair Gaming, Inc.
- Logitech International S.A.
- Razer Inc.
- Turtle Beach Corporation
- Kingston Technology Company, Inc. (HyperX)
- Sony Group Corporation (PlayStation Accessories)
- Microsoft Corporation (Xbox Accessories)
- SteelSeries ApS (GN Store Nord A/S)
- Cooler Master Technology Inc.
- Anker Innovations Limited
- Thermaltake Technology Co., Ltd.
- ASUS Tek Computer Inc. (ROG)
- Acer Inc. (Predator)
- Dell Technologies Inc. (Alienware)
- Lenovo Group Limited (Legion)
- HP Inc. (OMEN)
- Mad Catz Global Limited
- PDP Performance Designed Products LLC
- Hyperkin Inc.
- Scuf Gaming International, LLC
Market Opportunities and Future Outlook
Software-integrated performance and tournament-ready predictability create whitespace in premium and mid-range peripherals where differentiation is moving from basic specifications to validated responsiveness across platforms. In 2024, Microsoft enabled mouse-and-keyboard support for 26 Xbox Cloud Gaming titles, which expands the number of living-room and mobile-first play sessions that can support PC-class input devices and cross-platform profiles. Brand strategies in 2025 also indicate where product roadmaps are heading: Razer publicized the WYVRN ecosystem as an AI layer across its catalog, and Turtle Beach highlighted modularity and drift-resistance with its Victrix Pro BFG Reloaded controller using Hall-effect components, both pointing to opportunities for vendors that can combine durable hardware with recurring software services.
Regulatory and compliance shifts also create room for channel and product redesign, particularly for connected peripherals. EU enforcement of cybersecurity requirements under the Radio Equipment Directive from August 1, 2025 pushes manufacturers to build secure-by-design wireless stacks and update mechanisms, favoring suppliers with in-house firmware teams and established certification workflows. In Latin America, Brazils ANATEL-linked customs and homologation requirements taking effect May 25, 2026 for imported wireless controllers raise the value of compliant local representation, authorized importing structures, and SKU-level labeling discipline, which supports partnerships with established distributors and certified importers over informal gray channels.
Recent Industry Developments in Gaming Accessories Market
- June 2026: Logitech G partnered with Activision to become the Official PC Peripheral Partner for Call of Duty: Modern Warfare 4. The agreement ties a major AAA franchise to Logitechs accessory ecosystem and strengthens co-marketing leverage around launch windows, influencer activations, and peripherals bundling.
- August 2025: Turtle Beach unveiled the Victrix Pro BFG Reloaded wireless modular controller featuring Hall-effect sticks and triggers, with pre-orders opened in September 2025. The launch reinforces the shift toward drift-resistant components and modular designs that extend device life and support premium pricing in controllers.
- September 2024: Corsair completed its acquisition of Fanatec, expanding into sim-racing wheels, pedals, and cockpit accessories. The move deepened vertical integration in a specialized, higher-ticket segment and broadened Corsairs portfolio for cross-selling to performance and enthusiast gamers.
Gaming Accessories Market Report Scope and Research Methodology
Market Definition and Coverage
For this methodology, the gaming accessories market covers add-on devices used to play games better or more comfortably across PCs, consoles, and mobile devices. It includes input and audio peripherals and other companion hardware purchased through online and offline retail.
Scope exclusions: core gaming hardware (PCs and consoles), gaming software, and in-game digital goods are not counted in this market value.
Segments Covered in This Report
- By Product Type
- Headsets
- Gaming Keyboards
- Gaming Mice
- Gamepads / Controllers
- Gaming Chairs
- Other Product Types
- By Device Compatibility
- PC
- Console
- Mobile
- Cross-Platform / Universal
- By Distribution Channel
- Online Retail
- Offline Retail
- Specialty Gaming Stores
- Consumer Electronics Stores
- Hypermarkets and Supermarkets
- By Price Range
- Economy (Less Than USD 51)
- Mid-Range (USD 51 - USD 150)
- Premium (Above USD 150)
- By Geography
- North America
- United States
- Canada
- Mexico
- South America
- Brazil
- Argentina
- Rest of South America
- Europe
- Germany
- United Kingdom
- France
- Spain
- Italy
- Russia
- Rest of Europe
- Asia Pacific
- China
- Japan
- South Korea
- India
- Australia
- Rest of Asia Pacific
- Middle East and Africa
- Middle East
- United Arab Emirates
- Saudi Arabia
- Turkey
- Rest of Middle East
- Africa
- South Africa
- Nigeria
- Rest of Africa
- Middle East
- North America
Data Sources, Market Sizing, and Validation
Desk Research
Desk research was used to build the basic demand pool and keep assumptions realistic before we spoke to industry participants. We referenced public sources such as the US Census Bureau retail trade releases, Eurostat household and ICT statistics, UN Comtrade trade flows for relevant electronics categories, and OECD data on household consumption and digital access. We also used trade and standards bodies such as the Consumer Technology Association, plus public filings and investor presentations, to understand category mix shifts and pricing direction.
To sanity-check volumes and product momentum, we reviewed indicators like installed base trends, console cycle timing, PC and mobile gaming participation, and retail channel mix changes. Where additional company-level financial context was required, paid subscriptions for company financials and news intelligence were used only to complement what was already public. The sources mentioned above are illustrative, and many other public references were used to clarify, validate, and fill data gaps.
Primary Interviews and Surveys
Primary work focused on interviews and structured surveys with accessory makers, distributors, retailers, and platform-focused channel partners across major gaming regions. Respondent input was used to confirm typical pricing ladders, the share of wireless versus wired mixes, replacement cycles, and how demand differs between PC, console, and mobile users. Those points were then used to refine assumptions where desk research was thin.
Distribution of primary research fieldwork respondents
| Company type | Respondent position | Region |
|---|---|---|
| Top tier: 28% | CXOs: 16% | APAC: 41% |
| Mid tier: 54% | Functional/Unit leaders: 34% | EMEA: 33% |
| Smaller Players: 18% | Managers: 50% | Americas: 26% |
Market-Sizing & Forecasting
Sizing starts with a top-down demand reconstruction, where we map the active gamer base and device mix by region, then apply accessory attach rates and replacement cycles to form unit demand. After that, typical average selling prices are applied by category and channel, and results are converted into a single market value for the year. To keep totals grounded, we corroborate the outcome with selective bottom-up approximations, including sampled category revenue roll-ups from public disclosures, channel checks on sell-through, and ASP times volume cross-checks for key peripherals.
Key inputs that shape the model include the installed base of consoles and gaming PCs, the share of online retail in gaming hardware purchases, the shift toward wireless peripherals, headset and controller replacement frequency, and the pricing premium for feature upgrades (for example, haptics and spatial audio). When direct datapoints are missing for smaller countries, we bridge assumptions using regional peer markets with similar device penetration and retail structure, then adjust after interview feedback.
Forecasting is mainly done using scenario analysis, since console refresh cycles, macro spending, and esports participation can swing demand differently by year. The scenarios are anchored to expected gamer growth, mix changes between platforms, and interview-led views on pricing direction, followed by a final normalization step so growth stays consistent with observed retail and trade signals.
Data Validation & Update Cycle
Validation is done in layers, so each major assumption is checked more than once before sign-off. Model outputs are compared against independent signals like trade movement direction, public category commentary in filings, and shifts seen in retail channel behavior, then anomalies are reviewed until the drivers are clearly explained.
If a large variance appears by region or category, we re-check the unit logic, currency conversion timing, and price steps, then re-contact selected interviewees to confirm whether a market event changed the run-rate. Reports are refreshed annually, with interim updates when material events occur, and a final pre-delivery pass is completed so clients receive the latest updated view.
Mordor Intelligence's Gaming Accessories Market Size Compared Against Other Published Estimates
Published market values for gaming accessories can vary a lot, even when the topic sounds similar, because the counted products and pricing basis are not always the same. Differences also come from how each publisher treats platform overlap, retail pricing versus shipment value, and whether the latest year is refreshed after major launches.
The largest gaps usually show up when one estimate includes adjacent items like gaming chairs, webcams, or broader PC peripherals, or when aggressive price growth is assumed without a clear check against channel realities. Another common driver is whether the model is tied to a defined accessory attach and replacement logic by platform, which reduces double counting across PC and console users. This discipline is applied in this study by Mordor Intelligence.
Benchmark comparison
| Source | Market Size | Gaps in Research Methodology |
|---|---|---|
| Mordor Intelligence | USD 13.09 B (2025) | |
| Industry Research Publisher A | USD 11.40 B (2025) | Often reflects a narrower accessory basket and may emphasize selected core peripherals, which can undercount categories that sell strongly through online channels and cross-platform usage. |
| Trade Journal B | USD 20.00 B (2025) | May capture a broader spend pool labeled as peripherals and accessories, and may lean on retail value headlines that can include adjacent gear or wider PC peripheral spend beyond gaming-specific accessories. |
Overall, the spread is mainly explained by what is included in the accessory basket and whether values represent a tight gaming-only scope or a wider peripherals spend view. By keeping inputs traceable to platform mix, attach rates, replacement cycles, and realistic ASP movement, the resulting number stays repeatable and easier to reconcile when new products and channels shift demand.
Key Questions Answered in the Report
How large was the gaming accessories market in 2026?
It stood at USD 14.39 billion with a 9.96% compound annual growth outlook toward 2031.
Which product category held the top revenue share?
Headsets led with 27.92% of gaming accessories market share in 2025, underpinned by the need for positional audio in competitive play.
Which region is forecast to grow the fastest through 2031?
Asia Pacific is projected to expand at a 12.21% CAGR, fueled by rising disposable incomes and mobile esports adoption.
What drives premium-price accessories growth?
Enthusiast gamers and professional streamers invested in high-performance gear, pushing premium devices above USD 150 to a 13.03% CAGR.
How are tariffs affecting accessory prices?
Recent U.S. duties on imported electronics raised landed costs, prompting brands to diversify production and boosting retail prices in the short term.
What technologies will shape next-generation peripherals?
AI integration, advanced haptics, and cross-platform wireless protocols are expected to define differentiation over the next five years.