
Technology, Media and Telecom
5th MayAccelerating Additive Manufacturing Adoption in India
3 Min Read
The Game Streaming Market Report is Segmented by Hardware (Mobile Devices, PCs/Laptops/TVs, Game Consoles, and More), Content Genre (Shooter/Battle Royale, Adventure/RPG, and More), Revenue Model (In-Game Advertising, Subscription, Donations/Virtual Gifts, and More), Streaming Platform Type (Web-Based, Mobile Apps, Console-Integrated, and More), and Geography. The Market Forecasts are Provided in Terms of Value (USD).
Market Overview
| Study Period | 2019 - 2030 |
|---|---|
| Market Size (2025) | USD 8.40 Billion |
| Market Size (2030) | USD 13.85 Billion |
| Growth Rate (2025 - 2030) | 10.52 % CAGR |
| Fastest Growing Market | Asia Pacific |
| Largest Market | Asia Pacific |
| Market Concentration | Medium |
Major Players *Disclaimer: Major Players sorted in no particular order. Image © Mordor Intelligence. Reuse requires attribution under CC BY 4.0. |
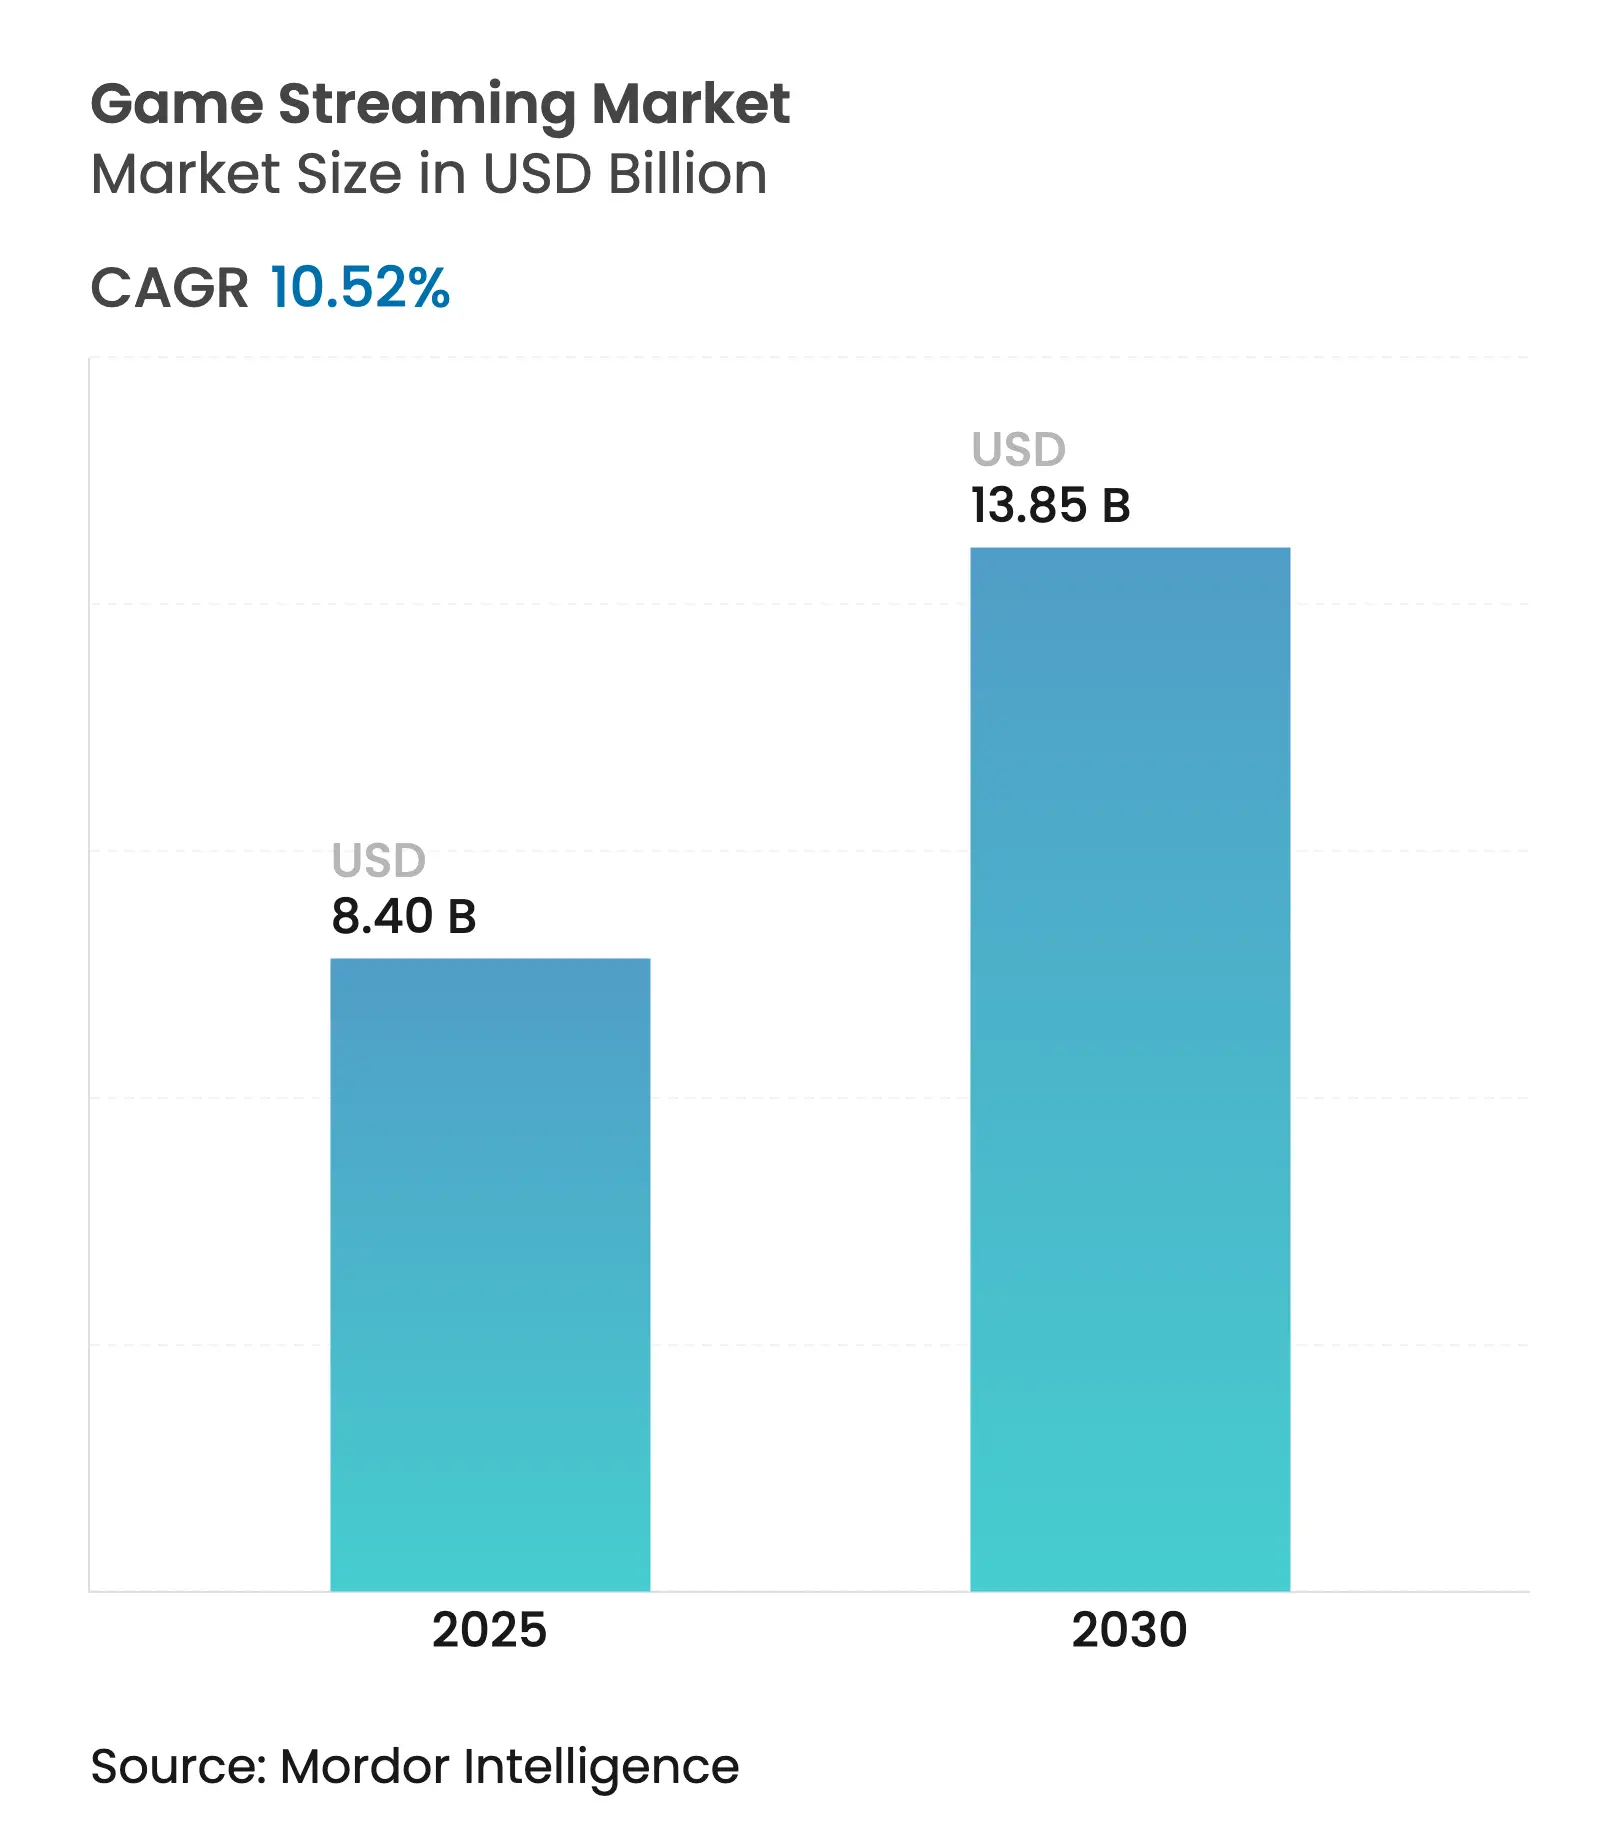
The Game Streaming Market size reached USD 8.40 billion in 2025 and is forecast to climb to USD 13.85 billion by 2030, reflecting a CAGR of 10.52% over 2025-2030. Robust network upgrades, the maturation of cloud infrastructure, and the shift toward subscription-based gaming services combine to accelerate adoption, while 5G coverage is expanding the addressable audience for mobile-first experiences. Platform consolidation is intensifying as incumbent services face competition from specialist challengers, creator monetization tools are expanding revenue opportunities, and regulatory scrutiny around loot-box mechanics is forcing greater transparency. Cloud-only devices are maturing rapidly, pure-cloud platforms are gaining scale, and Asia-Pacific continues to account for the largest regional game streaming market share, even as the Middle East and Africa record the fastest growth.
Key Report Takeaways
Drivers Impact Analysis
| Driver | (%) Impact on CAGR Forecast | Geographic Relevance | Impact Timeline | |||
|---|---|---|---|---|---|---|
Esports viewership surge and rising prize pools
Esports viewership surge and rising prize pools
| +2.1% | Global – APAC and North America lead | Medium term (2-4 years) |
(%) Impact on CAGR Forecast
:
+2.1%
|
Geographic Relevance
:
Global – APAC and North America lead
|
Impact Timeline
:
Medium term (2-4 years)
|
5G-enabled mobile streaming expansion
5G-enabled mobile streaming expansion
| +1.8% | APAC core, spill-over to MEA and Latin America | Short term (≤ 2 years) | |||
Growth of subscription game libraries
Growth of subscription game libraries
| +1.5% | North America and Europe, expanding to APAC | Medium term (2-4 years) | |||
Native streaming on smart-TV OS and consoles
Native streaming on smart-TV OS and consoles
| +1.3% | Global – early adoption in developed markets | Long term (≥ 4 years) | |||
AI live-caption / translation for cross-language reach
AI live-caption / translation for cross-language reach
| +0.9% | Global – supports non-English markets | Long term (≥ 4 years) | |||
Multi-stream distribution tools boosting creator
earnings
Multi-stream distribution tools boosting creator
earnings
| +0.7% | Global – creator-economy hubs | Short term (≤ 2 years) | |||
| Source: Mordor Intelligence | ||||||
Esports viewership surge and rising prize pools
Esports tournaments are evolving into prime-time spectacles that draw consistent audiences across streaming platforms. Record viewership in 2025 reflects deeper engagement even with fewer events, and prize-pool escalation strengthens the narrative arc that sustains audience attention. Co-streaming now accounts for nearly half of total esports hours watched, creating incremental monetization paths for both primary organizers and secondary creators. Sponsorship valuations rise in parallel, and brands benefit from highly targeted reach that rivals traditional sports advertising.[1]DreamHack AB, “DreamHack Partners Report,” dreamhack.com
5G-enabled mobile streaming expansion
Fifth-generation wireless speeds averaging almost five times those of 4G remove historical latency and compression barriers, enabling high-fidelity cloud streams to smartphones in real time. Carriers such as Deutsche Telekom are commercializing gaming-optimized 5G bundles, validating gaming traffic as a premium bandwidth segment. Regions with robust 5G rollouts capture an outsized share of new users and establish first-mover advantages in creator recruitment and viewer loyalty.[2]Deutsche Telekom AG, “5G+ Gaming Launch Press Release,” telekom.com
Growth of subscription game libraries
Subscription platforms lower discovery friction and provide predictable revenue streams. Microsoft’s Game Pass achieved double-digit PC subscription growth, underscoring cross-device scalability. Usage metrics show television and console screens dominating cloud-based playtime, implying that large-format experiences remain the preference when connectivity permits. Exclusive day-one releases and bundled perks reinforce retention, and the model stabilizes platform economics against swings in advertising demand. [3]Microsoft Corporation, “FY2025 Q3 Earnings Call Transcript,” microsoft.com
Native streaming on smart-TV OS and consoles
Partnerships between console manufacturers and television makers integrate cloud streaming directly into operating systems, eliminating external hardware. LG’s integration of Xbox Cloud Gaming into webOS and Samsung’s parallel initiatives signal that premium gaming libraries are becoming a basic smart-TV feature. Native apps tighten authentication, simplify payments, and unlock data-driven personalization, shifting competition from device capabilities toward content differentiation and user experience.
Restraints Impact Analysis
| Restraint | (%) Impact on CAGR Forecast | Geographic Relevance | Impact Timeline | |||
|---|---|---|---|---|---|---|
Escalating AAA content production budgets
Escalating AAA content production budgets
| −1.4% | Global – Western studios most exposed | Long term (≥ 4 years) |
(%) Impact on CAGR Forecast
:
−1.4%
|
Geographic Relevance
:
Global – Western studios most exposed
|
Impact Timeline
:
Long term (≥ 4 years)
|
Bandwidth and data-cap limitations in emerging markets
Bandwidth and data-cap limitations in emerging markets
| −1.1% | MEA, Latin America, rural APAC | Medium term (2-4 years) | |||
Platform bidding wars for exclusive creators inflating
CAC
Platform bidding wars for exclusive creators inflating
CAC
| −0.8% | Global – major creator hubs | Short term (≤ 2 years) | |||
Tightening ad-disclosure and loot-box regulations
Tightening ad-disclosure and loot-box regulations
| −0.6% | EU, North America – expanding to APAC | Medium term (2-4 years) | |||
| Source: Mordor Intelligence | ||||||
Escalating AAA content production budgets
Budgets for blockbuster titles surpass USD 200 million, limiting portfolio diversity and elevating financial risk for publishers. Streaming platforms become reliant on fewer high-profile releases that concentrate viewership and bargaining power in the hands of large studios. Escalating licensing demands raise content-acquisition costs, and smaller developers struggle to secure shelf space, potentially narrowing genre variety for audiences.
Platform bidding wars for exclusive creators inflating CAC
Multi-million-dollar exclusive contracts rarely deliver commensurate long-term audience gains, as viewers follow creators back to incumbent platforms once lock-ups expire. High churn and uncertain payback periods strain cash flows, prompting a gradual pivot toward revenue-sharing models that align incentives and avoid speculative spending spikes. Simulcast technology further erodes the value of exclusivity.
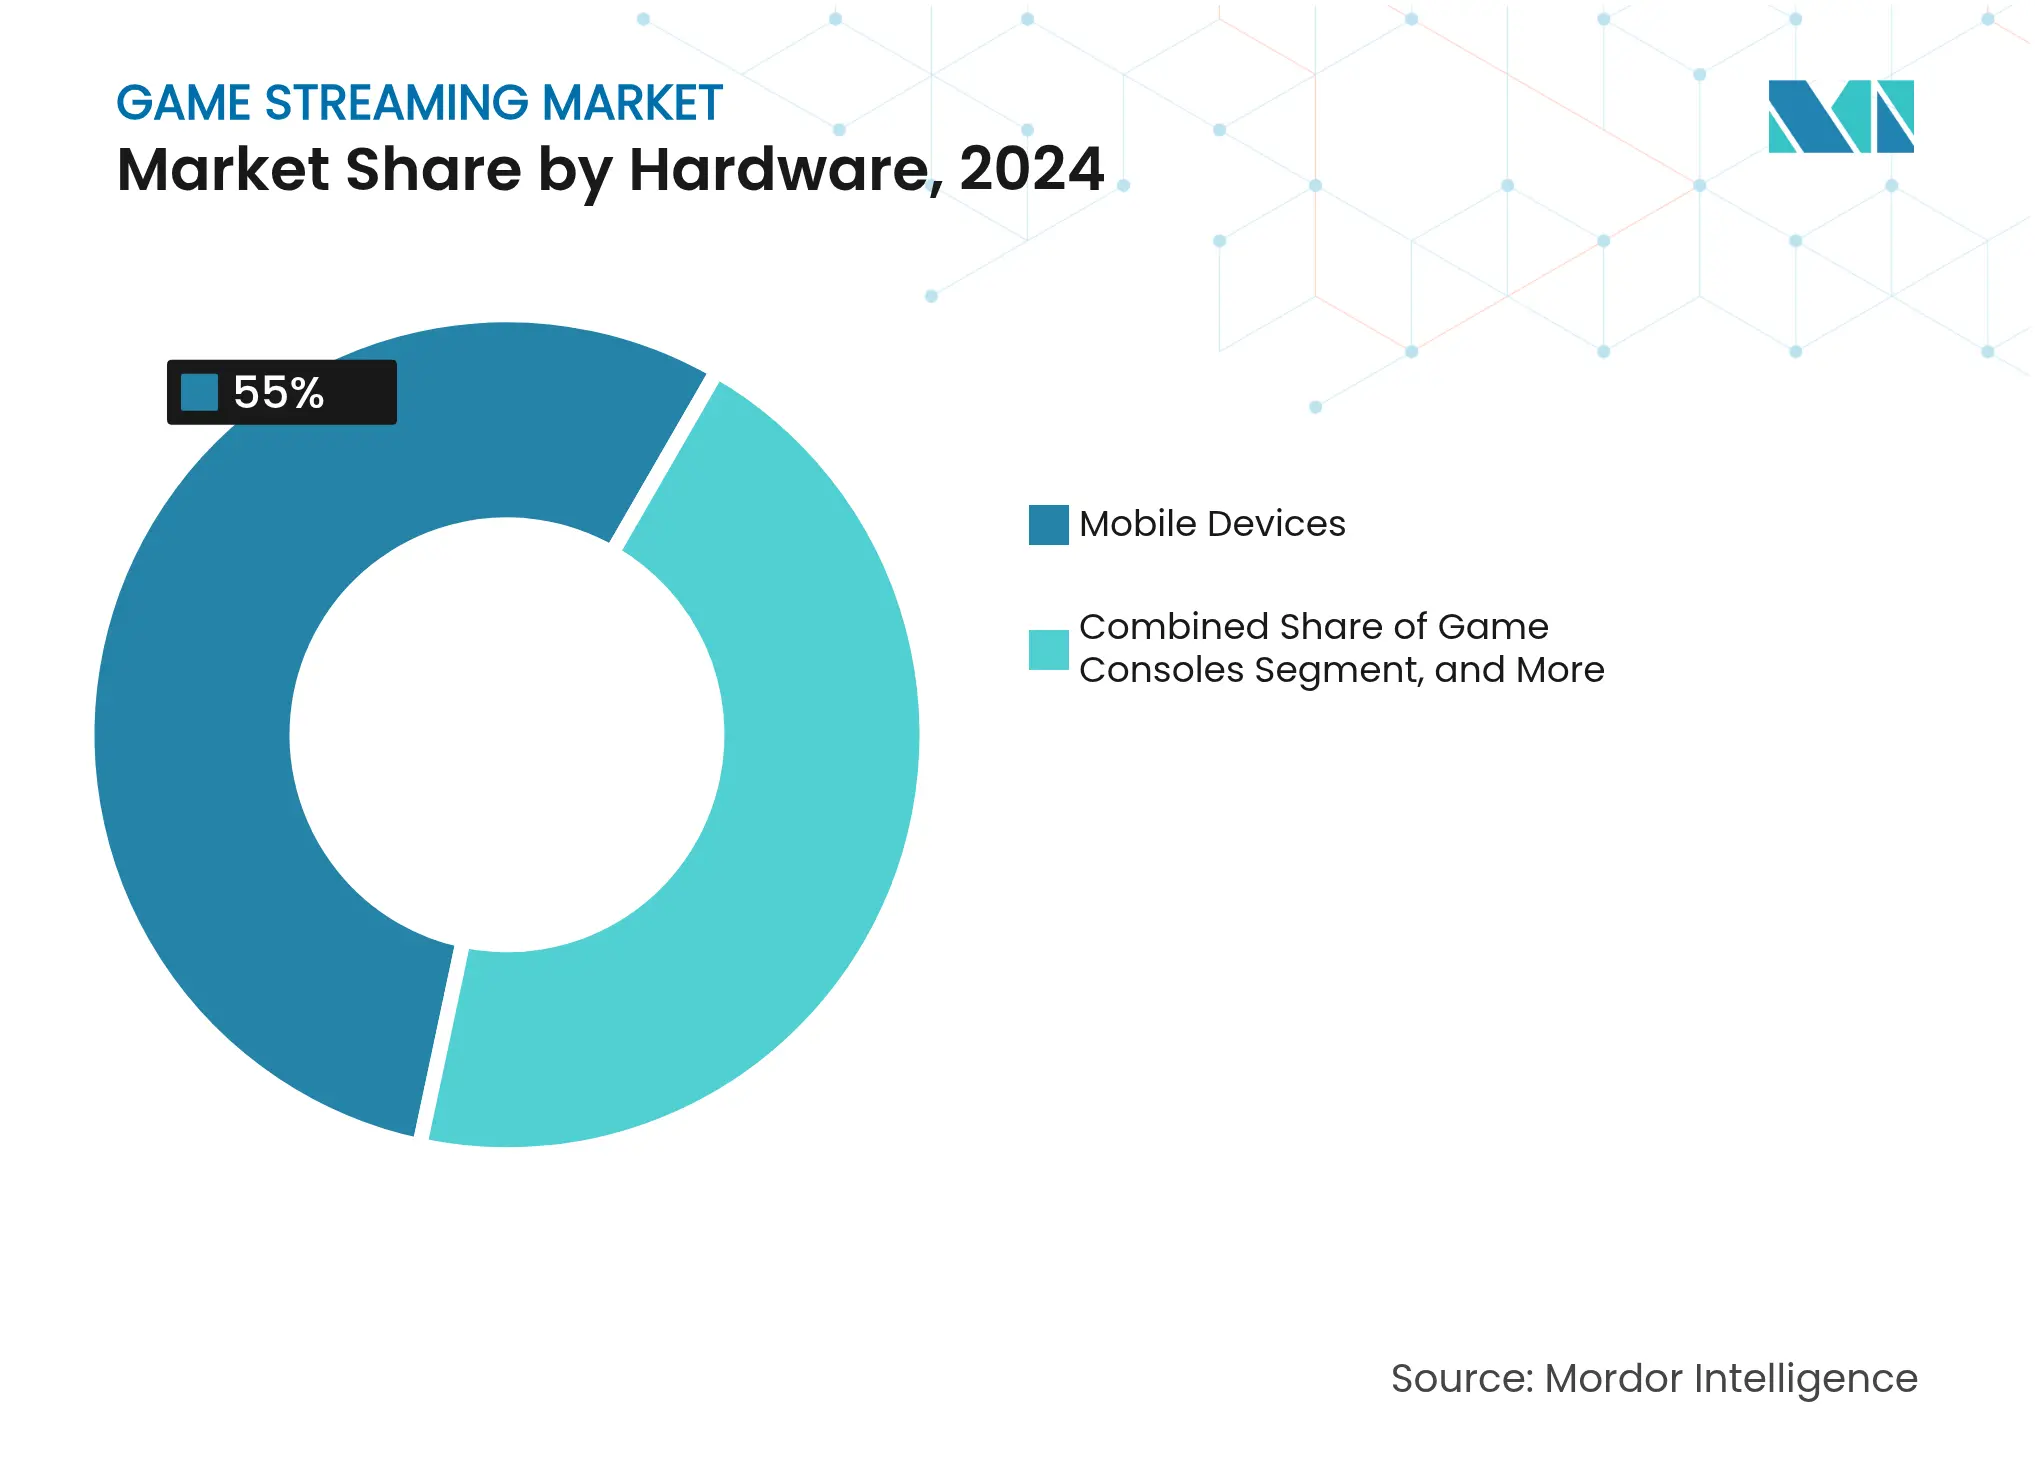
By Hardware: Mobile Dominance Drives Cloud Transition
Mobile hardware accounted for 55.0% of the game streaming market in 2024, a share reinforced by global smartphone saturation and lower entry costs. Hand-held and cloud-only devices are tracking a 29% CAGR through 2030, reflecting consumer desire for console-quality play on portable screens. The game streaming market size for hand-held PCs surpassed 6 million cumulative units, with Valve’s Steam Deck holding the lead in unit sales. Early adopters generate 10-20% of playtime for top Steam titles, confirming strong engagement per device. PCs, laptops, and smart TVs remain critical for high-resolution streams and competitive esports, yet their growth lags that of lightweight, cloud-centric form factors. Cloud-only dongles and VR headsets now access NVIDIA GeForce NOW, signaling that future success will depend on connectivity and seamless UI rather than raw silicon.
Consumer willingness to pay for mobile broadband upgrades and all-you-can-eat data bundles supports ongoing migration to cloud-optimized hand-helds. Hardware makers differentiate on battery life, thermals, and haptic feedback, but platform loyalty leans toward ecosystems offering unified libraries, cross-save, and synchronized friends lists. As latency falls below the perceptible threshold for most casual genres, value proposition shifts from device horsepower to content availability and subscription perks. This dynamic incentivizes cross-platform libraries that let users start a session on mobile and finish on a living-room TV without hardware barriers, a trend likely to sustain double-digit growth in portable cloud devices within the overall game streaming market.
Note: Segment shares of all individual segments available upon report purchase
By Content Genre: Shooter Dominance Meets Creative Innovation
Shooter and battle royale titles retained 28.0% of the 2024 game streaming market size, fueled by competitive formats, regular seasonal updates, and large-scale esports circuits. However, sandbox and creative experiences are advancing at an 18% CAGR, propelled by user-generated worlds that encourage participatory entertainment. Elden Ring’s RPG expansion drew 127 million watched hours and proved the staying power of narrative-rich content. Roblox registered 15.5 billion hours played in Q4 2023 and 240 brand activations, highlighting monetization potential in player-built environments.
Long-form narrative games sustain viewer engagement over extended streams, offering creators episodic content arcs that build loyalty. Strategy, simulation, and puzzle genres maintain smaller but dedicated followings attracted to analytical gameplay and educational value. Sports and racing streams synchronize with real-world event calendars, generating periodic spikes around major tournaments. The growing preference for interactive and co-creative formats is shifting monetization toward branded partnerships, in-world events, and virtual merchandise.
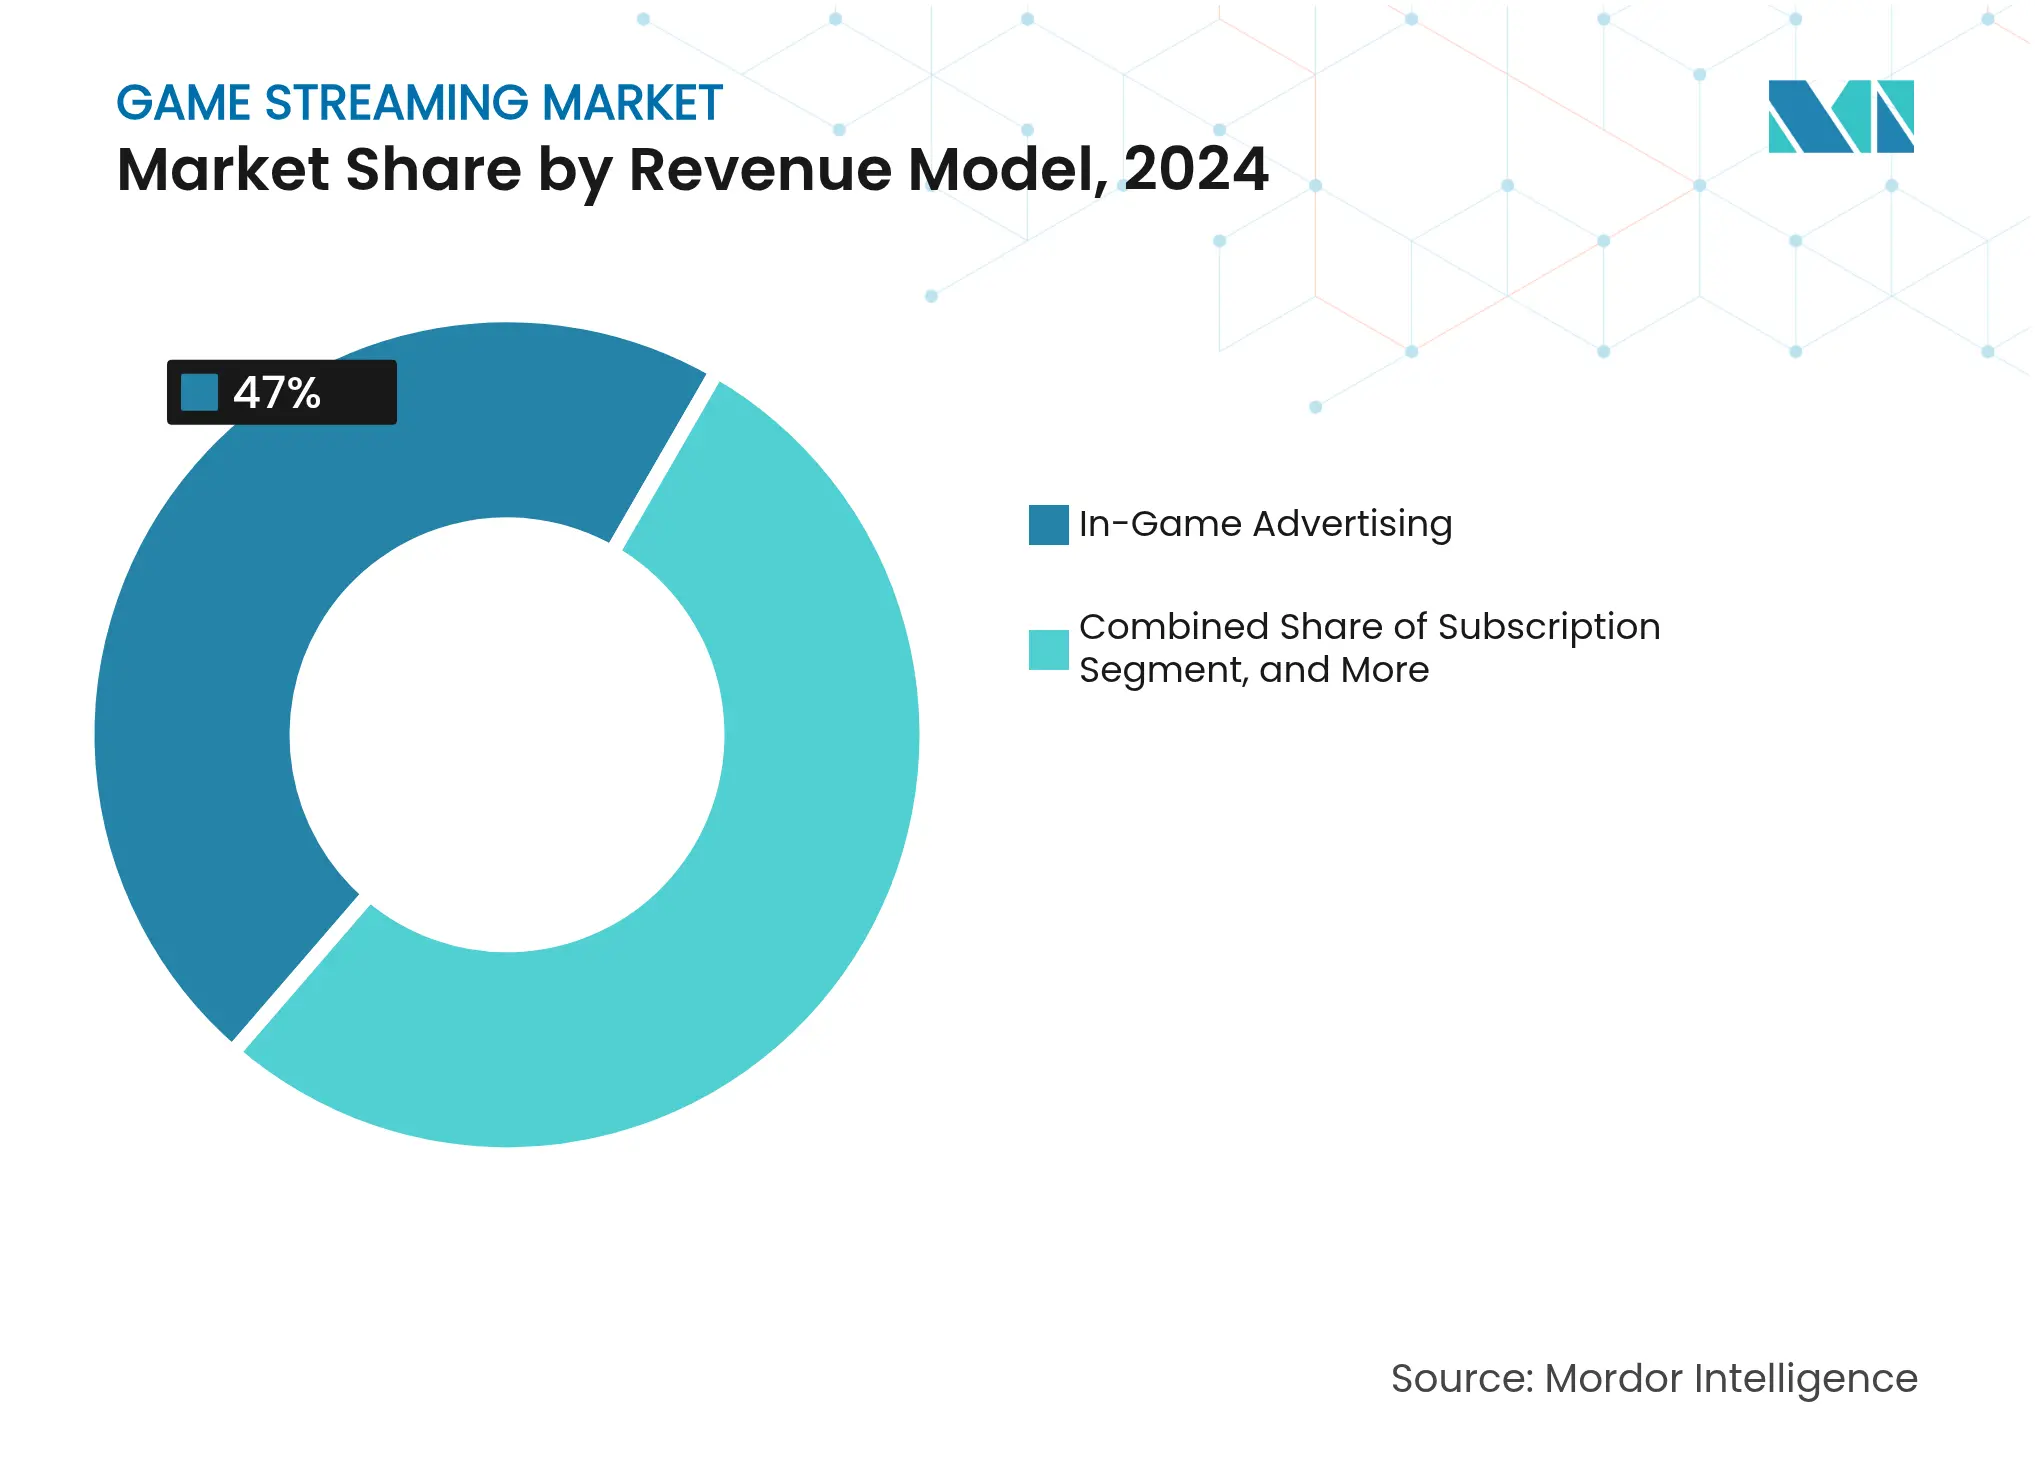
By Revenue Model: Advertising Leads Subscription Growth
Advertising contributed 47% of the 2024 game streaming market size, leveraging interactive ad units and AI-generated replays that integrate sponsor messages without disrupting immersion. Subscription services, currently smaller, are climbing at a 14% CAGR as platforms seek stable cash flows and users opt for ad-free experiences bundled with exclusive perks. AI targeting increases CPMs, and brand safety filters aid compliance with emerging disclosure rules. Donations, virtual gifting, and merchandise remain vital supplements, particularly in Asia-Pacific where tipping cultures prevail.
Pay-per-view passes monetize marquee esports finals and exclusive DLC reveals, but scalability is limited outside premium events. Hybrid revenue stacks combining ad-supported free tiers with premium subscriptions provide flexibility across income levels and geographic markets. The success of subscription libraries ties directly to content cadence, as churn accelerates when exclusive releases slow. Seamless wallet integrations across devices reduce friction and strengthen retention.
Note: Segment shares of all individual segments available upon report purchase
By Streaming Platform Type: Web Platforms Face Cloud Disruption
Web-based portals held 61.0% of the 2024 game streaming market share, benefiting from ingrained user habits and low onboarding friction. Pure-cloud services, however, are expanding at a 27% CAGR and threaten to displace traditional hosts by offering infrastructure-as-a-service models to third-party studios. Amazon GameLift Streams enables developers to reach any WebRTC-compatible device without proprietary tooling, democratizing entry and compressing margins for incumbent gatekeepers.
Mobile apps capture smartphone-first audiences in high-growth regions, while smart-TV and console-integrated apps blur the line between linear content and interactive play. Kick, a newcomer, recorded triple-digit growth by courting underserved languages, signaling that audience fragmentation rewards niche community focus. Long-term success will hinge on latency optimization, rights management, and scalable creator revenue splits.
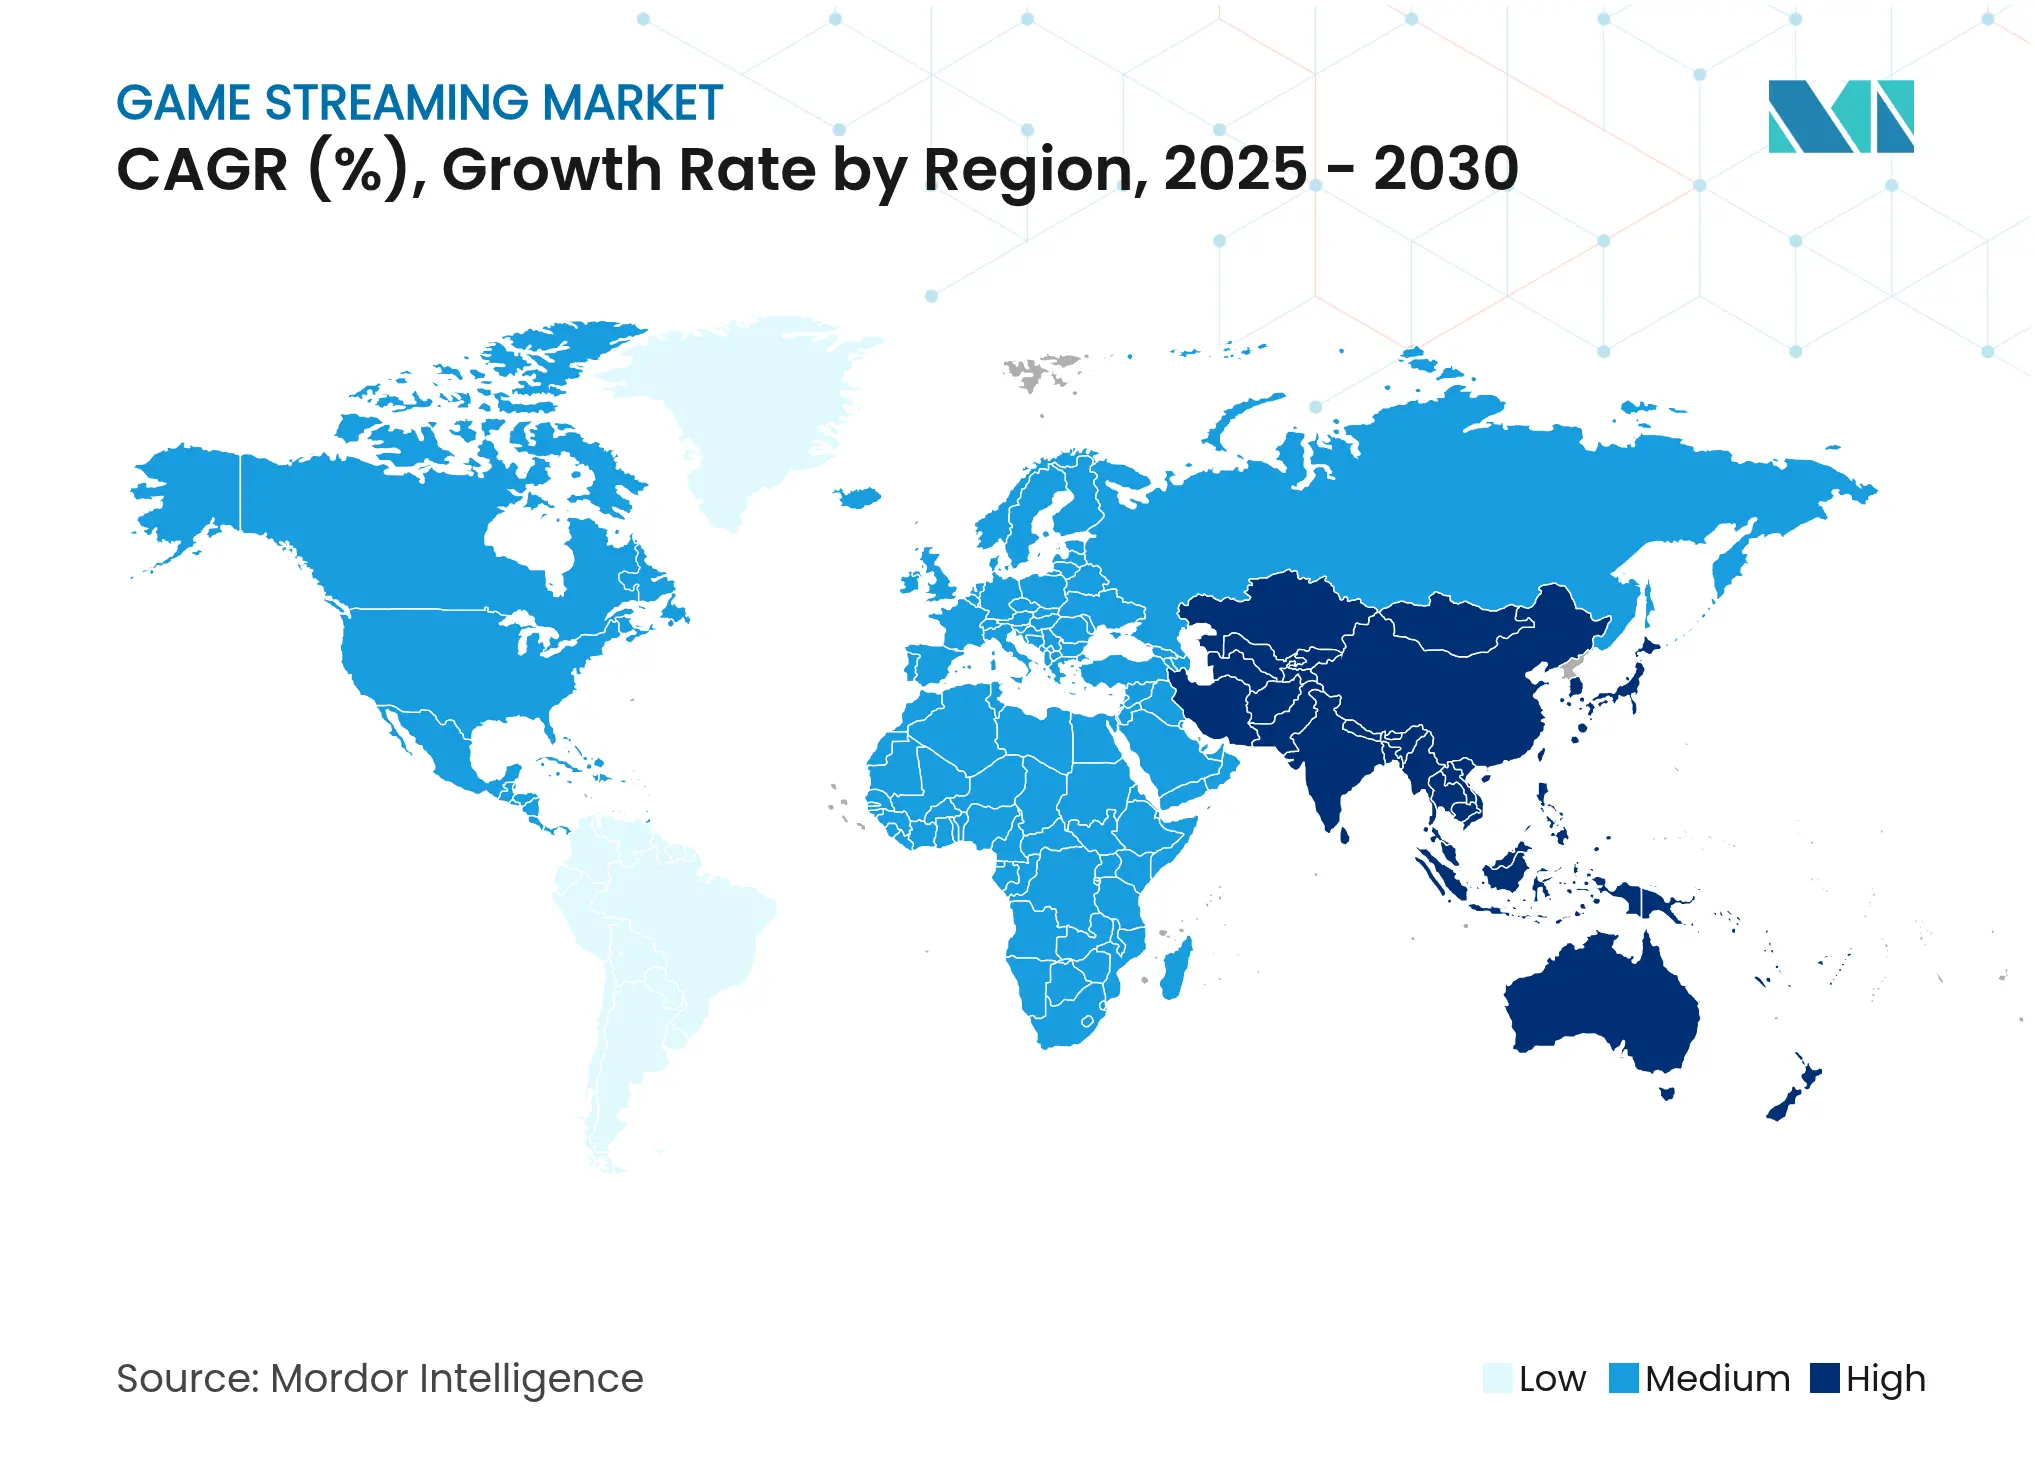
Asia-Pacific’s 44% share of 2024 revenue underscores the region’s vast user base, entrenched gaming culture, and advanced connectivity infrastructure. China’s live-commerce ecosystem, worth USD 694.5 billion in 2023 and projected to top USD 1.1 trillion by 2026, offers a blueprint for integrating shopping links into game streams, while Japan’s USD 179 billion mobile app spend reinforces consumer willingness to pay for premium experiences. South Korea’s leadership in 5G yields superior real-world latency scores that translate directly into higher engagement metrics on local platforms.
The Middle East and Africa post the fastest growth at a 15% CAGR through 2030, fueled by sovereign investment funds and telecom operators building esports arenas, studios, and regional servers. Saudi Arabia’s USD 38 billion allocation to gaming and the UAE’s USD 1 billion earmark for esports infrastructure underscore top-down policy support. Localized Arabic-language platforms like Stream Shreek meet cultural preferences in commentary style and community features, accelerating market penetration.
North America remains a revenue powerhouse due to high ARPU and entrenched creator ecosystems, but growth is moderating as core demographics near saturation. Regulatory enforcement is tightening: the Federal Trade Commission levied a USD 20 million penalty on HoYoverse for COPPA infractions, highlighting rising compliance costs. Europe offers regulatory stability under GDPR but imposes strict data-handling rules that elevate barriers for smaller entrants. South America shows upside as broadband infrastructure improves, with Brazil leading adoption; yet macroeconomic volatility and currency swings add risk premiums for investors.
Market Concentration
Top Companies in Game Streaming Market
The game streaming industry exhibits moderate fragmentation, with no single entity exceeding one-third of total hours watched. Twitch remains the largest platform but experienced a 6.9% decline in Q1 2025 viewership, while challenger Kick expanded 112%. Technology differentiation increasingly centers on AI-assisted content discovery, auto-translation, and creator revenue dashboards. Strategic alliances, such as Amazon’s developer-facing GameLift Streams, aim to lock in ecosystem participants through toolchain dependencies.
Vertical integration is gaining momentum: hardware makers embed cloud services to capture downstream subscription revenue, and content studios acquire middleware providers to streamline direct-to-consumer distribution. Global gaming M&A hit USD 23.2 billion across 665 deals in 2024, evidencing sustained consolidation. Regulatory regimes emphasize transparency in advertising and loot-box mechanics, favoring incumbents with robust compliance infrastructure. Specialized platforms targeting under-served languages, genres, or geographies capture loyal micro-communities that resist generic mass-market appeals.

*Disclaimer: Major Players sorted in no particular order
1. INTRODUCTION
2. RESEARCH METHODOLOGY
3. EXECUTIVE SUMMARY
4. MARKET LANDSCAPE
5. MARKET SIZE AND GROWTH FORECASTS (VALUE)
6. COMPETITIVE LANDSCAPE
7. MARKET OPPORTUNITIES AND FUTURE OUTLOOK
The game streaming market is defined by the revenue for game streaming solutions, such as web-based and app-based, worldwide.
The game streaming market is segmented by revenue model (in-game advertising model, subscription model, and other revenue models), solutions (web-based [Twitch, YouTube, Facebook, and Dailymotion] and application-based [Xbox Streaming, Remotr, Steam Link, and Rainway Inc]), and geography (North America (the United States and Canada), Europe (Germany, the United Kingdom, and Rest of Europe), Asia-Pacific (China, Japan, India, South Korea, and Rest of Asia-Pacific), Latin America, and Middle East and Africa). The market size and forecasts are provided in terms of value (USD) for all the above segments.
Accelerating Additive Manufacturing Adoption in India
3 Min Read
Pricing Strategy for Semiconductor Components
3 Min Read
When decisions matter, industry leaders turn to our analysts. Let’s talk.