
Fusion Splicer Market Size and Share
Market Overview
| Study Period | 2020 - 2031 |
|---|---|
| Market Size (2026) | USD 774.23 Million |
| Market Size (2031) | USD 993.12 Million |
| Growth Rate (2026 - 2031) | 5.11 % |
| Fastest Growing Market | Asia Pacific |
| Largest Market | Asia Pacific |
| Market Concentration | Medium |
Major Players *Disclaimer: Major Players sorted in no particular order Image © Mordor Intelligence. Reuse requires attribution under CC BY 4.0. | |
Fusion Splicer Market Analysis by Mordor Intelligence
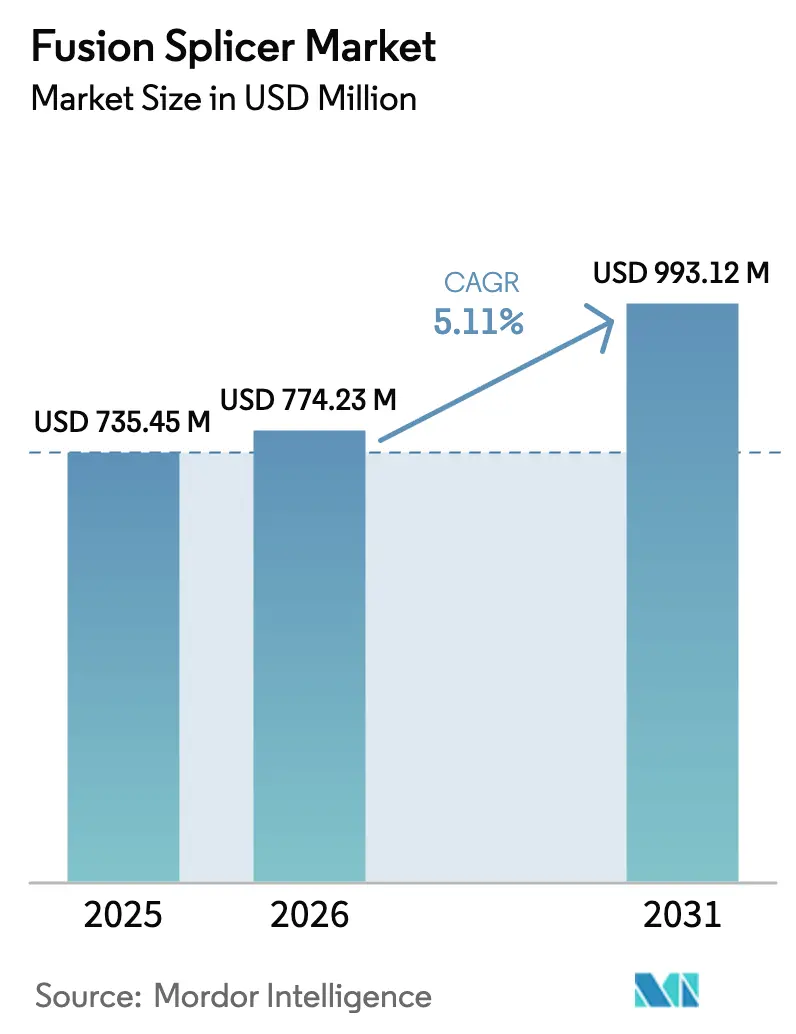
The Fusion Splicer Market size is expected to grow from USD 735.45 million in 2025 to USD 774.23 million in 2026 and is forecast to reach USD 993.12 million by 2031 at 5.11% CAGR over 2026-2031.
Demand is expanding as fiber backhaul for 5G densification, hyperscale data centers, and publicly funded rural broadband programs converge, creating sustained equipment requirements. Contractors are replacing mechanical splicing with automated fusion systems that lower insertion loss and improve long-run network reliability, while telecom operators, cloud providers, and system integrators allocate fresh capital to ribbon splicers that accelerate crew productivity. Competitive dynamics continue to shift as lower-priced Chinese entrants force incumbents to differentiate through AI-enabled alignment algorithms and cloud-linked splice diagnostics. Volatility in electrode raw materials and an aging, undersized technician workforce remain structural concerns for the fusion splicer market.
Key Report Takeaways
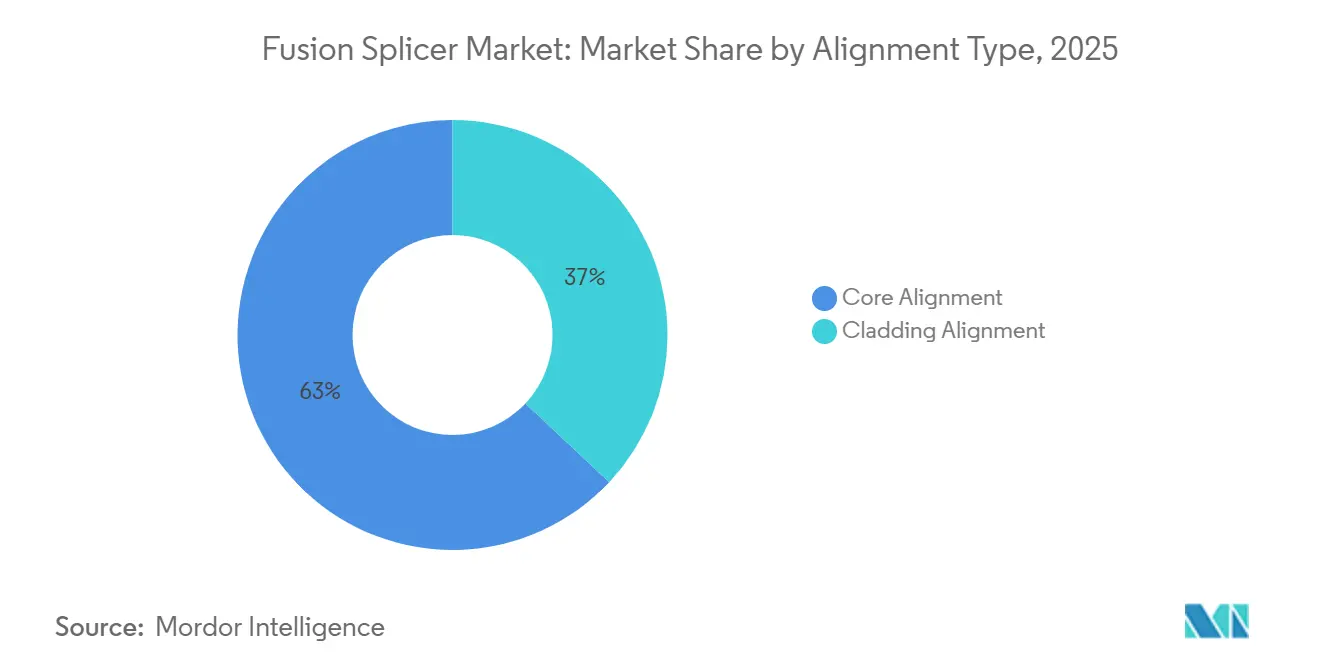
- By alignment type, core alignment held 63% fusion splicer market share in 2025, whereas cladding alignment is projected to record a 5.87% CAGR through 2031.
- By product type, single-fiber units led the fusion splicer market with 58% of the market share in 2025, while ribbon splicers are set to expand at a 6.12% CAGR.
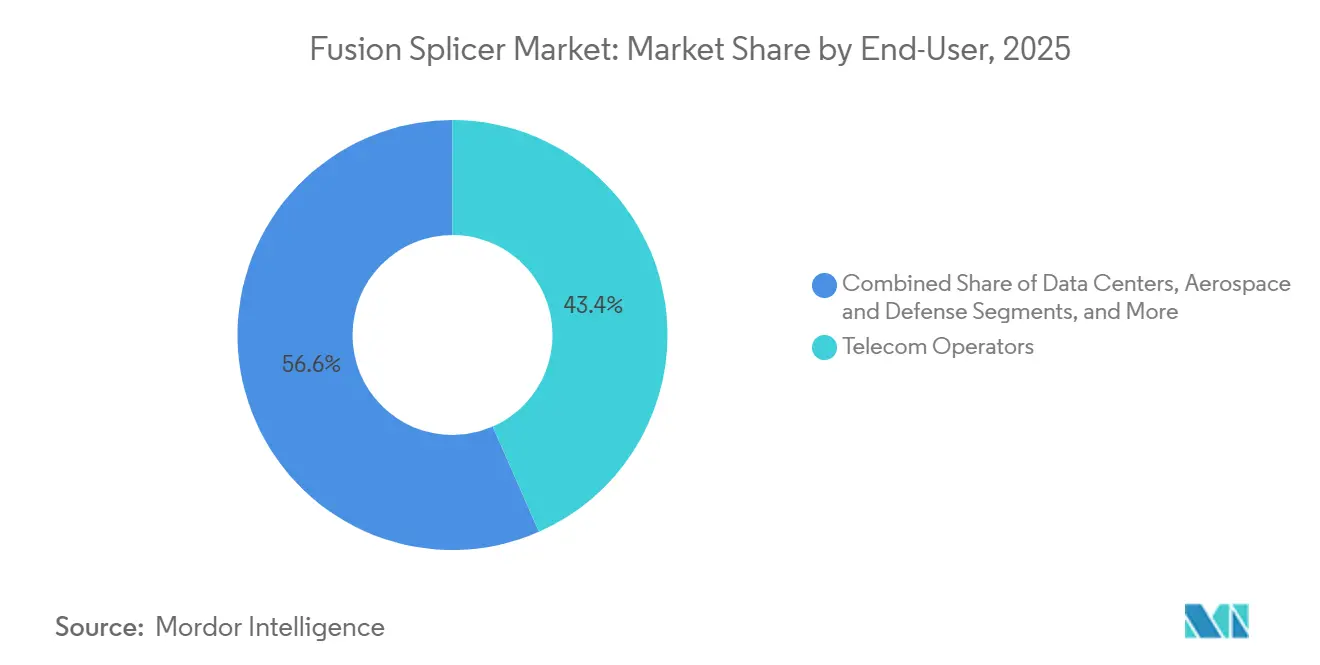
- By end user, telecom operators accounted for 43.4% of 2025 revenue, yet data centers are advancing at a 5.98% CAGR through 2031.
- By application, telecommunications accounted for 56.4% of demand in 2025, and premises networks are expected to rise at a 6.32% CAGR.
- By geography, Asia-Pacific captured 42.1% of 2025 revenue, and is expected to rise at a 6.78% CAGR.
Note: Market size and forecast figures in this report are generated using Mordor Intelligence’s proprietary estimation framework, updated with the latest available data and insights as of January 2026.
Market Trends and Insights
Drivers Impact Analysis of Fusion Splicer Market*
| Driver | (~) % Impact on CAGR Forecast | Geographic Relevance | Impact Timeline |
|---|---|---|---|
| Accelerating 5G Backhaul Fiber Deployment | +1.2% | Global, strong in Asia-Pacific and North America | Medium term (2-4 years) |
| Rising Rural Broadband Funds | +0.9% | North America, India, Southeast Asia | Medium term (2-4 years) |
| Surge in Hyperscale Data Center Construction | +1.4% | North America, Europe, Asia-Pacific core markets | Short term (≤ 2 years) |
| Transition From Mechanical to Automated Fusion Splicing | +0.7% | Global, strong in Asia-Pacific and North America | Long term (≥ 4 years) |
| Adoption of AI-Enabled Self-Aligning Splicers | +0.6% | North America, Europe, Japan | Medium term (2-4 years) |
| Growing Use of Specialty Fibers | +0.3% | North America, Europe, select Asia-Pacific research hubs | Long term (≥ 4 years) |
| Source: Mordor Intelligence | |||
Surge in Hyperscale Data Center Construction
Hyperscale operators are adding server capacity at a pace that eclipses traditional enterprise build cycles. Each data hall requires tens of thousands of low-loss fiber terminations, and 400 G to 800 G optical transceivers demand parallel fiber ribbons that magnify splice counts. In 2024 hyperscale capacity grew 18%, underpinned by 120 new facilities that collectively stretched global splice demand. Contractors now specify 12- and 24-fiber ribbon units that cut per-splice time to under 90 seconds, improving labor productivity and ensuring consistent optical performance across high-fiber-count interconnects.
Accelerating 5G Backhaul Fiber Deployment
Mobile operators continue to densify mid-band and millimeter-wave cells, with each small-cell node requiring several dedicated fibers. China plans to install fiber to more than 3 million 5G base stations by 2024, a build that will multiply splice points well beyond legacy macro architectures.[1] Portable, battery-driven splicers that withstand aerial and underground conditions are in high demand as field crews race to meet rollout deadlines.
Rising Rural Broadband Funds
Government subsidy programs such as the USD 42.5 billion BEAD initiative in the United States, BharatNet in India, and national rollouts across Southeast Asia mandate fiber-to-the-premises as the default technology. These policies translate directly into new orders for fusion splicers, often in challenging terrain where ribbon models enhance crew efficiency. Contractors that historically focused on wireless or coaxial deployments are ramping up splicer fleets to capture funded projects.[2]
Transition From Mechanical to Automated Fusion Splicing
Insertion-loss budgets are tightening as operators push longer reach and higher bandwidth. Fusion splicing typically holds losses below 0.05 dB, well inside IEC 61300-3-4 thresholds. Automated units now use real-time image analytics to self-adjust arc energy and electrode gap, driving uniform results with less technician intervention. The shift lowers consumable costs and accelerates deployment compared to mechanical methods that rely on index-matching gel.
Restraints Impact Analysis of Fusion Splicer Market*
| Restraint | (~) % Impact on CAGR Forecast | Geographic Relevance | Impact Timeline |
|---|---|---|---|
| High Up-Front Equipment Costs for Contractors | -0.5% | Global, acute in emerging markets | Short term (≤ 2 years) |
| Shortage of Certified Fiber-Splicing Technicians | -0.8% | North America, Europe, select Asia-Pacific markets | Medium term (2-4 years) |
| Price Pressure From Low-Cost Chinese Entrants | -0.4% | Global, intense in Asia-Pacific and Middle East | Short term (≤ 2 years) |
| Volatility in Rare-Earth Electrode Materials | -0.3% | Global | Medium term (2-4 years) |
| Source: Mordor Intelligence | |||
Shortage of Certified Fiber-Splicing Technicians
The United States alone faces a projected deficit of 700,000 qualified fiber technicians through 2029, a gap that prolongs project timelines and inflates labor rates.[3] Europe reports similar hiring delays, with vacancies for installers remaining open twice as long as general construction trades. Although AI-enabled units reduce the learning curve, complex ribbon or specialty fiber tasks still require experienced personnel, limiting deployment velocity in rural and remote builds.
High Up-Front Equipment Costs for Contractors
Advanced core-alignment splicers list between USD 15,000 and USD 25,000, capital outlays that deter small regional contractors from bidding on large projects. In emerging markets the barrier is more acute, impeding fusion splicer market penetration despite strong underlying fiber demand. Leasing models and vendor financing are emerging, yet ownership costs remain a hurdle until unit prices decline or project margins expand.
*Our forecasts treat driver/restraint impacts as directional, not additive. The impact forecasts reflect baseline growth, mix effects, and variable interactions.
Fusion Splicer Market Segment Analysis
By Alignment Type:
Core Dominance With Specialty PivotCore-alignment systems delivered 63% of fusion splicer market revenue in 2025, underscoring their role in long-haul and metro backbones where ultralow loss is mandatory. Precise imaging aligns fiber cores within sub-micron tolerances, holding attenuation to 0.02-0.05 dB. The fusion splicer market size for core-alignment units is projected to stay ahead as telecom operators refresh existing fleets for AI-assisted versions.
Cladding-alignment demand is nevertheless climbing, expanding at a 5.87% CAGR as quantum sensing and aerospace programs rely on non-standard fiber geometries that preclude core-based alignment. Lower equipment prices, typically 15-20% below core units, help contractors address specialty projects without straining budgets. Manufacturers are now introducing hybrid platforms that toggle between modes, ensuring one chassis covers both mainstream and niche requirements.
By Product Type:
Ribbon Splicers Gain As Data Centers ScaleSingle-fiber models retained 58% of 2025 revenue owing to their versatility across access and enterprise links. Yet ribbon splicers are on a faster 6.12% trajectory because a single 12-fiber splice replaces a dozen sequential terminations, cutting labor time by up to 85%. The fusion splicer market share for ribbon equipment is poised to widen further as 400 G and 800 G transceivers proliferate across hyperscale sites.
Specialty-fiber units occupy a small volume yet command premium pricing, capturing 18% of vendor revenue on just 8% of shipments. Photonic crystal and polarization-maintaining fibers used in defense, quantum, and laser systems drive this niche, and vendors differentiate through programmable arc profiles and extended warranties that align with mission-critical reliability standards.
By End-User:
Data Centers Outpace Telecom GrowthTelecom carriers generated 43.4% of fusion splicer market demand in 2025, anchored by 5G backhaul and fiber-to-the-home initiatives. The fusion splicer market size related to telecom will continue to expand, yet its growth rate trails that of hyperscale computing.
Data centers display a 5.98% CAGR through 2031 as cloud operators roll out multi-availability-zone regions and deploy edge facilities for AI inference workloads. Contractors servicing these builds now average more than three splicers per crew, versus barely two units just two years earlier, reflecting the intensity of ribbon work in dense rack environments.

By Application:
Premises Growth Reflects Hybrid WorkTelecommunications networks still dominate equipment shipments, holding 56.4% of 2025 use cases. The fusion splicer market size for telecom remains anchored by long-haul capacity upgrades, yet enterprise premises networks are outpacing it, fueled by hybrid work and private 5G adoption.
Premises applications will grow at a 6.32% CAGR, encompassing campus backbones, colocation cross-connects, and cable operators migrating from coax to fiber-deep. Each corporate site typically needs multiple splice points for dual-path redundancy, driving demand for compact units that balance mobility with automated alignment.
Geography Analysis
APAC Fusion Splicer Market
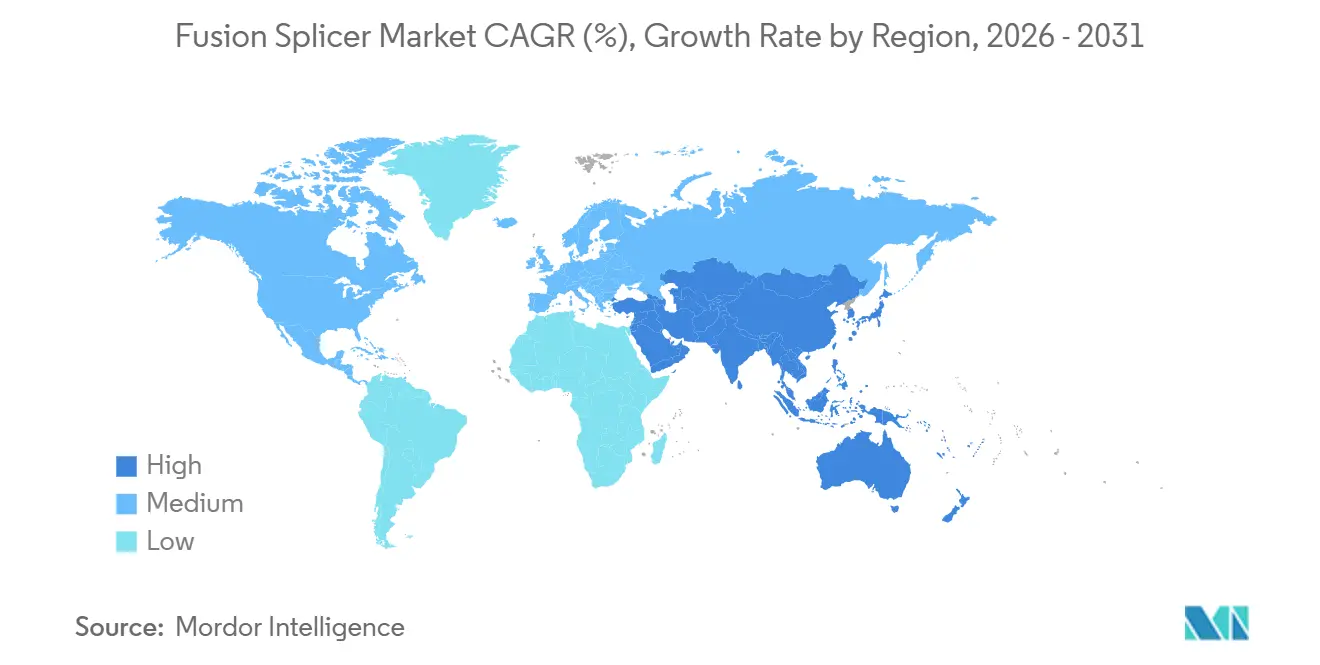
the Asia-Pacific accounted for 42.1% of 2025 revenue. China’s operators added 65 million new fiber-to-the-home lines in 2024, while India’s BharatNet targets village-level connectivity by 2026. Japan, South Korea, and Singapore focus on 10-gigabit passive optical network upgrades that require low-loss re-splicing at distribution hubs. Emerging Southeast Asian economies such as Indonesia and Vietnam are scaling mobile backhaul, favoring ruggedized portable units for aerial and underground cable runs.
North America Fusion Splicer Market
North America is the largest regional market, coupling rural buildouts with relentless data-center additions. BEAD funding ensures multi-year equipment orders from contractors expanding fiber to unserved communities, and hyperscale operators keep ribbon splicer demand elevated around Ashburn, Phoenix, and Columbus clusters. Canada’s Universal Broadband Fund mirrors this pattern, especially in provinces with harsh winters that require durable field hardware.
EMEA Fusion Splicer Market
Europe presents a patchwork. Scandinavia approaches universal fiber penetration, shifting vendor focus to replacement cycles and ribbon upgrades in data centers. Southern and Eastern European markets lag, but EU Digital Decade targets gigabit coverage for all households by 2030, translating into accelerated purchases as national programs unlock grants. The Middle East and Africa trail in absolute volume yet post one of the steepest growth slopes, propelled by smart-city mega-projects in the Gulf and 5G backhaul across select African metros where operators migrate traffic from congested microwave links to fiber.
Regulatory Landscape
Fusion splicer deployment is shaped by standards that define acceptable splice loss and test procedures, which feed into procurement specifications and field acceptance testing. ITU-T Recommendation L.400 (L.12) anchors international guidance on optical fibre splice practices, while related measurement frameworks such as ITU-T G.650.3 and TIA-455-239 set how splice performance is characterized and documented for telecom and data-center builds.
On the policy side, fiber build acceleration and infrastructure streamlining measures translate into faster, larger work orders that require compliant installation practices and documentation. In the European Union, the Gigabit Infrastructure Act (Regulation (EU) 2024/1309) pushes member states toward standardized, fiber-ready in-building infrastructure requirements. In the United States, the FCC has moved to reduce friction in fiber deployment, including FCC 25-38 on pole attachment processes and make-ready timelines, a March 2026 technology transitions Report and Order (FCC 26-19) that facilitates retirement of legacy copper in favor of fiber, and a June 2026 NPRM proposing a 120-day shot clock for rights-of-way approvals for wireline infrastructure (proposed rule).
Value Chain Analysis
The fusion splicer value chain begins with upstream precision components and consumables, including optical imaging systems (lenses and sensors), arc or electrode assemblies and electrode materials, precision mechanics and clamps, batteries, and embedded electronics or software. OEMs integrate these into single-fiber, ribbon, and specialty splicing platforms with alignment algorithms and user-interface software, then calibrate and certify performance to customer requirements and standard-driven acceptance criteria, including loss measurement methods tied to ITU-T and TIA frameworks. Component availability and pricing for electronics and optical subsystems can affect lead times, while electrode replacement and periodic calibration support a recurring aftermarket for consumables and service.
Downstream, the market is supplied through direct OEM sales to tier-1 carriers and hyperscale contractors, plus regional distributors and tool-rental or leasing channels serving local installers. Service networks, including repair depots, calibration centers, loaner fleets, and training, are a key differentiator for vendors such as Fujikura, Sumitomo Electric, and Furukawa Electric, particularly as fleets expand under rural broadband programs such as the USD 42.5 billion BEAD initiative and as data-center builds shift demand toward higher-throughput ribbon platforms. System integrators and contractors complete deployments by bundling splicers with cleavers, inspection microscopes, OTDR or test equipment workflows, and the project documentation required by operators and public-funding compliance regimes.
Competitive Landscape
Global supply is moderately concentrated: Fujikura, Sumitomo Electric, and Furukawa Electric control roughly 55-60% of revenue by pairing optical fiber expertise with broad service footprints. Chinese challengers such as INNO Instrument and Signal Fire disrupt on price and marketing, offering core-alignment models at 30-40% discounts that resonate in budget-sensitive regions. Korean firms Ilsintech and UCL Swift compete on mid-tier pricing and respectable performance metrics, winning share among buyers seeking a balance between cost and reliability.
Software and data increasingly differentiate offers. Leading vendors embed cloud dashboards that capture splice imagery, electrode-wear indicators, and technician performance statistics, turning each device into a service node within a wider ecosystem. Patent activity underscores this shift; Fujikura’s 2024 filing covers machine-learning algorithms that predict electrode fatigue days before failure, enabling scheduled maintenance that minimizes field interruptions. Ribbon splicer innovation continues, with roadmaps calling for sub-60-second, 24-fiber cycles aimed squarely at hyperscale sites.
Barriers to entry persist around optical-component quality control, ISO 9001 certification, and long-term supply agreements with tier-1 carriers. Nonetheless, integrators remain open to multi-vendor fleets when price gaps widen, maintaining competitive tension that puts pressure on incumbents' margins.
Fusion Splicer Industry Leaders
-
Fujikura Ltd.
-
Sumitomo Electric Industries, Ltd.
-
Furukawa Electric Co., Ltd.
-
INNO Instrument Inc.
-
Darkhorsechina (Beijing) Telecom Technology Co., Ltd.
- *Disclaimer: Major Players sorted in no particular order

Fusion Splicer Market Companies Covered in this Report
- Fujikura Ltd.
- Sumitomo Electric Industries, Ltd.
- Furukawa Electric Co., Ltd.
- INNO Instrument Inc.
- Ilsintech Co., Ltd.
- AFL Telecommunications LLC
- Corning Incorporated
- 3SAE Technologies, Inc.
- UCL Swift Co., Ltd.
- Darkhorsechina (Beijing) Telecom Technology Co., Ltd.
- Nanjing Jilong Optical Communication Co., Ltd.
- Shenzhen Ruiyan Communication Equipment Co., Ltd.
- Signal Fire Technology Co., Ltd.
- Shanghai Xianghe Optical Communication Co., Ltd.
- COMWAY Technology LLC
- Skycom Fibre Ltd.
- GAO Tek Inc.
- Thorlabs, Inc.
- Viavi Solutions Inc.
- EXFO Inc.
Market Opportunities and Future Outlook
Opportunities center on throughput gains and labor substitution in environments where splice counts are rising faster than the availability of certified technicians. Hyperscale build intensity, including the shift to 400G to 800G optics and parallel fiber architectures, increases the value of ribbon and mass-fusion platforms that reduce per-fiber handling time and standardize results across large crews. Vendor roadmaps in the market emphasize automation, including self-alignment, automated fiber handling, and diagnostics, along with higher-fiber-count ribbon cycles, which aligns with contractor goals to control cost per termination while meeting tighter insertion-loss budgets.
A second whitespace is standards-led installation quality and documentation tooling for publicly funded broadband and enterprise premises deployments. The FOA Installation Standard 2025 identifies fusion splicing as the required method for continuous long-distance runs and intermediate drops, reinforcing demand for compliant field practices, training, and workflow capture. Product activity provides near-term evidence of this direction, including AFL Global highlighting new mass fusion splicing technology with smarter alignment and a hand-held design (May 2026), along with the market-wide push toward cloud-linked splice imagery and maintenance indicators described by leading OEMs. These needs support bundling splicers with training, certification support, calibration services, and fleet analytics to help contractors meet operator acceptance criteria and program audit requirements.
Recent Industry Developments in Fusion Splicer Market
- May 2026: AFL (Fujikura Group) introduced the Fujikura 100R mass fusion splicer to the North American market, positioning it around automated placement correction for high-density ribbon work. The update widens access to mass-fusion capability for contractors serving hyperscale data centers and large FTTH builds, where productivity per crew drives tool selection.
- December 2025: Fujikura rolled out an AI-enhanced fusion splicer platform that auto-detects fiber type and optimizes arc parameters, cutting setup time by 60%. The release reinforces the shift toward automation features that reduce dependence on scarce experienced splicers while improving consistency across multi-crew deployments.
- June 2025: Furukawa Electric and Lightera announced development work on fusion splicing technology aimed at advanced fibers such as multi-core and hollow-core designs. This extends addressable use cases beyond mainstream telecom access and into specialty and next-generation optical fiber ecosystems that require new alignment and arc-control approaches.
Fusion Splicer Market Report Scope and Research Methodology
Market Definition and Coverage
This market covers revenue generated from fusion splicing equipment used to join optical fibers, along with the related accessories typically bought with the splicer for field or lab use. It is sized globally in value terms and reflects demand from fiber network build, maintenance, and specialty fiber work.
Scope exclusions: We exclude upstream fiber manufacturing and passive cable components that are not part of the fusion splicing equipment purchase.
Segments Covered in This Report
- By Alignment Type
- Core Alignment
- Cladding Alignment
- By Product Type
- Single-Fiber Fusion Splicer
- Ribbon-Fiber Fusion Splicer
- Specialty-Fiber Fusion Splicer
- By End-User
- Telecom Operators
- Data Centers
- Contractors and System Integrators
- Aerospace and Defense
- By Application
- Telecommunications
- Cable TV
- Premises and Enterprise
- Research and Specialty Applications
- By Geography
- North America
- United States
- Canada
- Mexico
- South America
- Brazil
- Rest of South America
- Europe
- Germany
- France
- United Kingdom
- Rest of Europe
- Asia-Pacific
- China
- Japan
- India
- Rest of Asia-Pacific
- Middle East
- Gulf Cooperation Council
- Rest of Middle East
- Africa
- South Africa
- Rest of Africa
- North America
Data Sources, Market Sizing, and Validation
Desk Research
Desk work was used to set the demand context and to avoid building the model on assumptions that do not match real network activity. We reviewed public indicators such as International Telecommunication Union (ITU) broadband and fiber connectivity statistics, World Bank infrastructure and telecom series, OECD communications data, and national telecom regulator releases where available.
To ground supply and trade signals, we also checked customs and trade portals that publish import and export statistics, along with patent databases and peer reviewed papers on fiber splicing performance and field practices. Company annual reports, investor decks, and product catalogs were used to understand typical price bands and replacement cycles, and a paid subscription for company financials and news was used selectively to cross check revenue disclosures and major contract announcements. The sources listed here are illustrative only, and many other public references were also used for data collection, validation, and clarification.
Primary Interviews and Surveys
Primary work centered on interviews and short surveys with equipment suppliers, distributors, fiber installation contractors, telecom and data center teams, and technical users in research and specialty fiber settings. Because this is a global market, we ensured the input covered APAC, EMEA, and the Americas, so pricing moves, lead times, and buying triggers could be captured and then used to validate our desk based assumptions.
Distribution of primary research fieldwork respondents
| Company type | Respondent position | Region |
|---|---|---|
| Top tier: 32% | CXOs: 17% | APAC: 45% |
| Mid tier: 49% | Functional/Unit leaders: 40% | EMEA: 34% |
| Smaller Players: 19% | Managers: 43% | Americas: 21% |
Market-Sizing & Forecasting
Sizing starts with a top-down demand reconstruction tied to fiber deployment and maintenance activity, since most buying is driven by new build intensity and repair workloads rather than discretionary upgrades. The model uses practical inputs such as fiber cable rollout and FTTH momentum signals, data center interconnect build trends, estimated technician counts and productivity, typical splicer replacement cycles, and average selling price ranges by alignment type and usage setting.
Those totals are then checked with selective bottom-up approximations, where sampled unit volumes from key channels are multiplied by price bands and adjusted for mix (single fiber, ribbon, and specialty fiber). When gaps show up, they are handled through conservative interpolation using adjacent country patterns and known project pipelines, and then corrected using interview based checks on shipment timing and discounting.
For forecasting, we apply scenario analysis supported by simple multivariate relationships between fiber build indicators and equipment demand, and the final outlook is aligned to what experts expect for network capex pacing, pricing erosion, and adoption of higher precision core alignment tools in demanding applications.
Data Validation & Update Cycle
Validation is done through several passes so the numbers stay consistent with real world signals. We compare outputs against independent metrics like fiber deployment activity, telecom capex direction, and trade flow trends, and then review any sharp jumps that do not match field feedback.
Before sign off, assumptions and calculations are peer reviewed, and follow up calls are triggered when price ranges, mix shares, or regional splits look out of line with what installers and distributors report. Reports are refreshed annually, and interim updates are made when material events occur, after which a final pre delivery check is completed so clients receive the latest view.
Mordor Intelligence's Fusion Splicer Market Size Compared With Other Published Estimates
Published market values for fusion splicers can vary more than buyers expect, even when the same end use industries are being discussed. The differences usually come from what is counted as part of the market, what year is treated as the current baseline, and how prices and unit demand are projected forward.
A common gap is scope expansion into software, service, and training revenue, which pushes totals higher even if hardware unit demand is similar. Some estimates also anchor to older base years or use a slower fiber deployment and replacement cycle assumption, and then carry that forward without re checking against trade signals, tender activity, and channel pricing updates.
Benchmark comparison
| Source | Market Size | Gaps in Research Methodology |
|---|---|---|
| Mordor Intelligence | USD 735.45 M (2025) | |
| Global Publisher A | USD 876.30 M (2025) | Includes software and services as a formal offering layer, which can add recurring and project based revenue beyond the equipment sale. |
| Industry Publisher B | USD 558.00 M (2024) | Uses an earlier base year and a sales value framing that tends to track only the equipment revenue realized in-year, which can understate demand when project timing shifts. |
The spread in the table is mainly explained by what is bundled with the splicer purchase and how the base year is set. Some estimates fold in software and service lines or broader fiber work tools, and then the market total rises. For Mordor Intelligence, the count is limited to fusion splicing equipment and its typical purchase linked accessories, and service type revenue is not treated as part of the market value.
Key Questions Answered in the Report
What is the projected value of the fusion splicer market in 2031?
The market is forecast to reach USD 993.12 million by 2031 based on a 5.11% CAGR.
Which segment is growing fastest within the fusion splicer space?
Ribbon splicers are expanding at a 6.12% CAGR as hyperscale data centers adopt parallel fiber architectures.
Why are AI-enabled fusion splicers gaining traction now?
AI models automate fiber identification and arc optimization, cutting setup time and lowering the skill threshold amid a technician shortage.
How does 5G roll-out influence fusion splicer demand?
Dense small-cell backhaul requires substantially more splice points than legacy macro networks, increasing orders for portable, ruggedized units.
Which region currently leads global fusion splicer revenue?
Asia-Pacific currently leads global fusion splicer revenue, captured 42.1% of 2025 revenue, propelled by China's FTTH scale and India's BharatNet program.
What factor most constrains near-term deployment velocity?
A shortage of certified fiber-splicing technicians, particularly in North America and Europe, prolongs project timelines and raises labor costs.