
Furniture And Home Furnishing Market Size and Share
Market Overview
| Study Period | 2021 - 2031 |
|---|---|
| Market Size (2026) | USD 1 Trillion |
| Market Size (2031) | USD 1.43 Trillion |
| Growth Rate (2026 - 2031) | 7.39 % |
| Fastest Growing Market | Asia Pacific |
| Largest Market | North America |
| Market Concentration | Low |
Major Players *Disclaimer: Major Players sorted in no particular order Image © Mordor Intelligence. Reuse requires attribution under CC BY 4.0. | |
Furniture And Home Furnishing Market Analysis by Mordor Intelligence
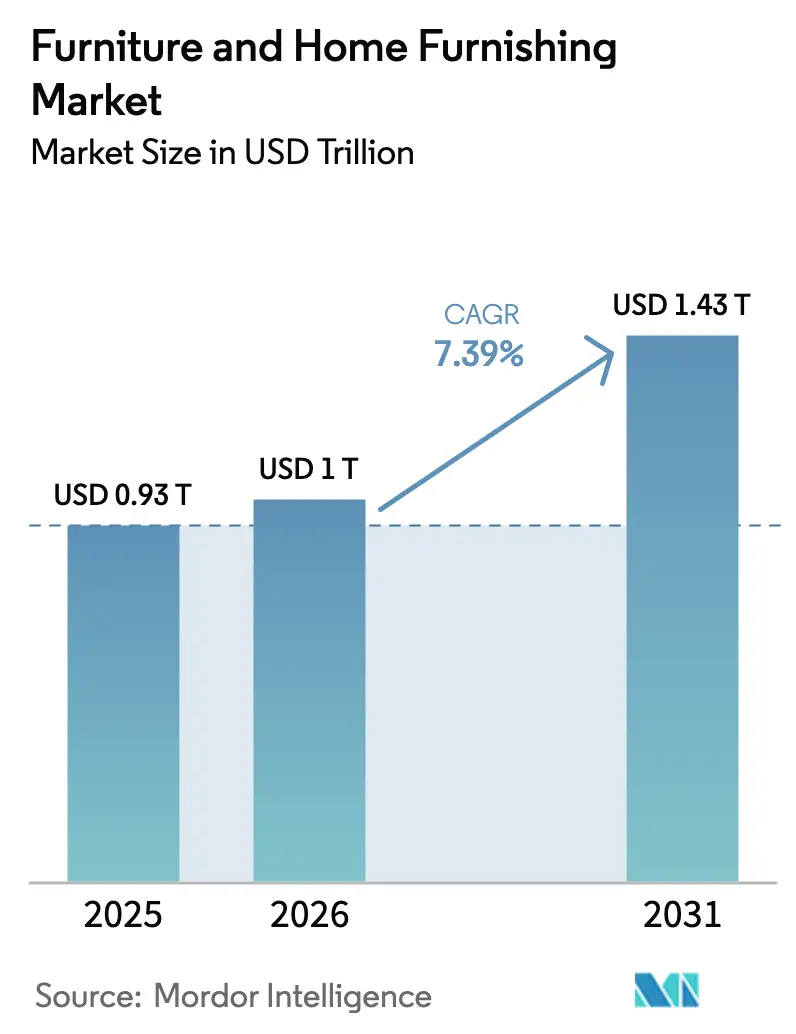
The Furniture And Home Furnishing Market size was valued at USD 0.93 trillion in 2025 and is estimated to grow from USD 1 trillion in 2026 to reach USD 1.43 trillion by 2031, at a CAGR of 7.39% during the forecast period (2026-2031).
The shift follows normalization of post-pandemic demand patterns, a durable pivot to hybrid work, and sustained investment in omnichannel capabilities that lift reach and conversion across formats. Leading manufacturers and retailers are scaling smaller format stores, deepening in-store planning services, and expanding last-mile capacity to reduce returns and delivery costs in categories with bulky logistics. Procurement strategies are adapting to tariff exposure and supply volatility across wood, steel, aluminum, and critical components, with some companies nearshoring or dual sourcing to maintain service levels. Select operators are balancing these pressures with pricing actions and disciplined capital allocation to fund expansion where digital and physical channels reinforce one another.
Key Report Takeaways
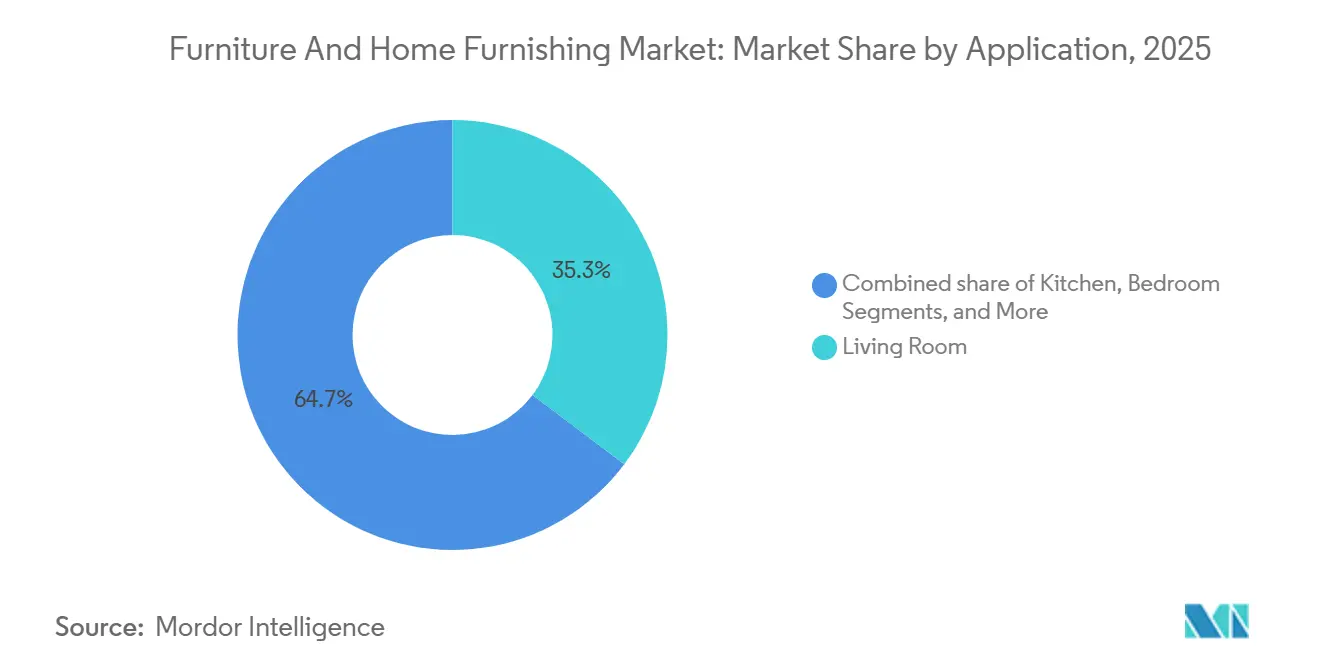
- By application, Living Room led with 35.26% of the furniture and home furnishing market share in 2025, while Outdoor is projected to expand at an 8.12% CAGR through 2031, emphasizing the resilience of indoor anchors and the durability of post-pandemic outdoor living upgrades.
- By material, Wood held a dominant 46.61% of the furniture and home furnishing market share in 2025, while Plastic is forecast to post the fastest 8.36% CAGR to 2031 as recycled-content mandates and weather-resistant outdoor use cases gather momentum.
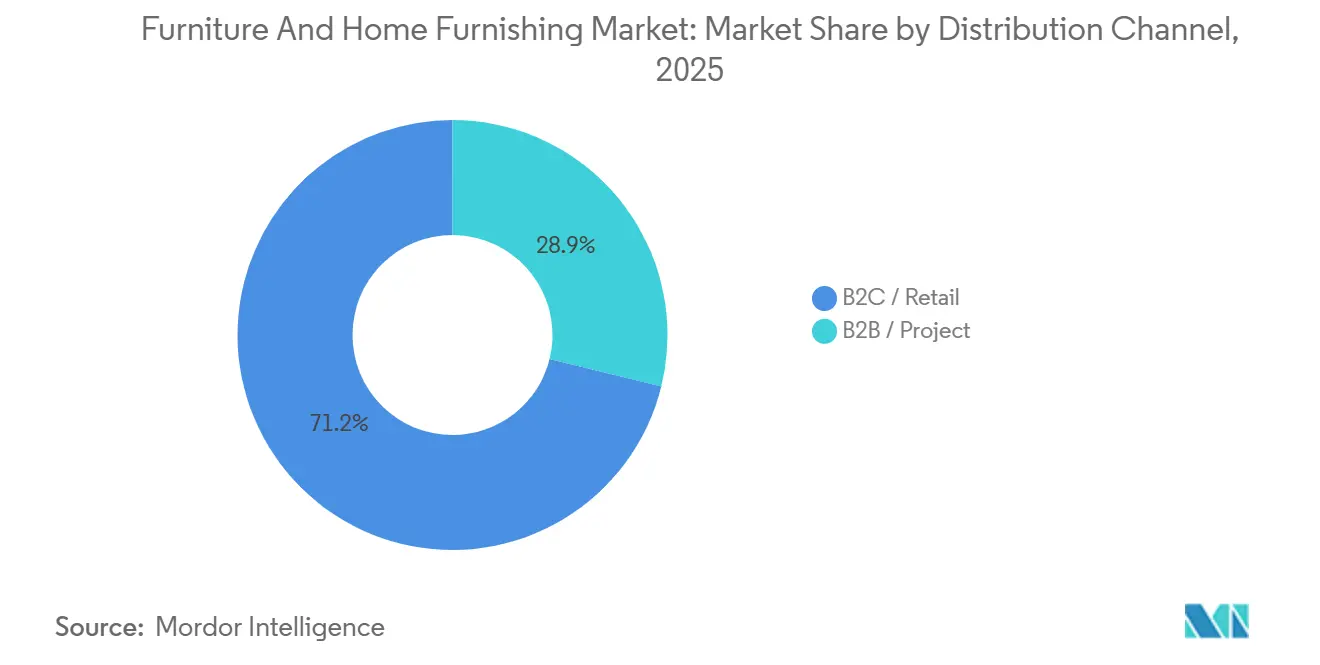
- By distribution channel, B2C/Retail captured 71.15% of the furniture and home furnishing market share in 2025 sales, while B2B/Project is the fastest-growing at a 7.25% CAGR, aligned to hybrid office retrofits and institutional purchasing cycles.
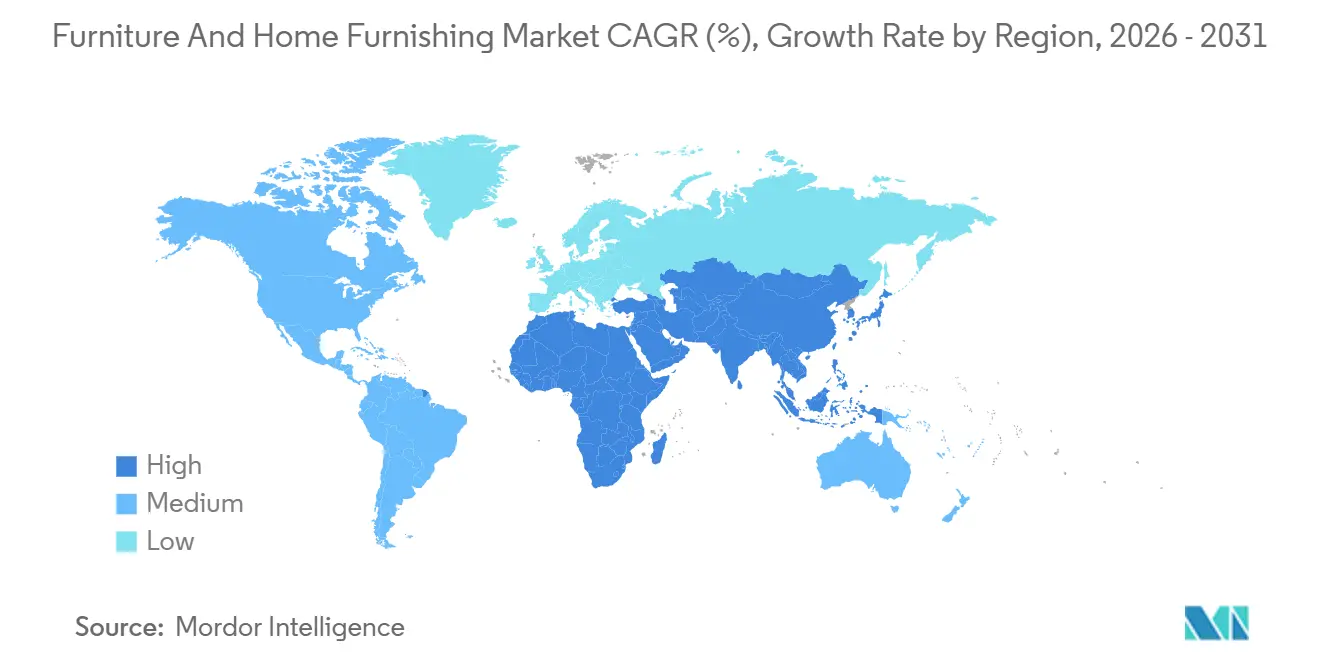
- By geography, North America accounted for 28.41% of the furniture and home furnishing market share in 2025, while Asia-Pacific is the fastest-expanding region at an 8.01% CAGR through 2031, underscoring long-run urbanization and demographic tailwinds in core markets.
Note: Market size and forecast figures in this report are generated using Mordor Intelligence’s proprietary estimation framework, updated with the latest available data and insights as of January 2026.
Market Trends and Insights
Drivers Impact Analysis of Furniture And Home Furnishing Market*
| Driver | (~) % Impact on CAGR Forecast | Geographic Relevance | Impact Timeline |
|---|---|---|---|
| Rapid Urbanization & Shrinking Living Spaces | +1.8% | Global, peak in India, China, Asia-Pacific | Long term (≥ 4 years) |
| Rising Disposable Income in Emerging Economies | +1.5% | Asia-Pacific core, spill-over to Middle East & Africa, South America | Long term (≥ 4 years) |
| Growth of E-Commerce & Omnichannel Furniture Retailing | +1.2% | Global, early gains in North America, Europe | Medium term (2-4 years) |
| Post-Pandemic Work-From-Home Furniture Demand Spike | +2.1% | North America, Western Europe, select Asia-Pacific metros | Medium term (2-4 years) |
| Surge in Demand for Modular, Space-Saving Designs | +1.3% | Global, concentrated in urban centers | Medium term (2-4 years) |
| Circular-Economy Mandates Driving Recycled Material Adoption | +0.8% | Europe leadership, regulatory influence spreading globally | Long term (≥ 4 years) |
| Source: Mordor Intelligence | |||
Rapid Urbanization and Shrinking Living Spaces Propel Space-Efficient Furniture Demand
Rising urban density is compressing residential footprints in major metro areas, which heightens the appeal of modular and multifunctional designs that can reconfigure across daily routines. Government statistics show that in the Netherlands, the average living space per person in major cities like Amsterdam is about 49 square metres, compared with a national average of 65 square metres, reflecting smaller residential footprints in urban areas [1]. This trend is most visible in compact floor plans where convertible sofas, folding desks, and vertical storage systems deliver real space utility. Product development cycles increasingly focus on knock-down designs that cut packaging volume and streamline last-mile handling while supporting lower-emission logistics. Global brands are adapting assortments and packaging to small-space living and urban delivery constraints, with compact series and room-by-room planning tools embedded into store formats. As more households prioritize adaptability and ease of assembly, the furniture and home furnishing market benefits from design innovations that meet the constraints of modern city housing while reducing waste in shipping and storage.
Rising Disposable Income in Emerging Economies Unlocks Premium Segment Growth
A larger middle class in high-growth Asian markets is supporting steady trading-up behaviour from basic to premium finishes, especially in living room and bedroom categories. In India, category expansion aligns with broad-based home formation and residential upgrades, where organized retail and online channels have widened access to branded offerings for urban households. Pradhan Mantri Awas Yojana – Urban (PMAY-U) 2.0 covers 5,206 towns, with 995 thousand houses sanctioned and 5.616 million households registered, across implementation verticals such as Beneficiary-Led Construction (BLC), Affordable Housing in Partnership (AHP), and In-Situ Slum Redevelopment (ISS). The scheme targets Economically Weaker Sections (EWS), Low-Income Groups (LIG), and Middle-Income Groups (MIG), with total central government assistance of USD 29.3 billion[2]. This large-scale urban housing expansion is a key driver of increased demand for furniture and home furnishings. Certifications such as FSC and GREENGUARD have become buying criteria for upwardly mobile consumers, which directs demand toward cleaner materials and low-emission finishes that meet recognized ecolabel benchmarks. This preference is visible in both residential and project-driven purchases, as procurement teams standardize on third-party standards in corporate, hospitality, and education settings. As premiumization advances, the furniture and home furnishing market captures higher ticket sizes through better materials, curated collections, and services that reinforce perceived value.
Growth of E-Commerce and Omnichannel Retailing Revolutionizes Furniture Purchasing Journeys
Omnichannel expansion continues to remove friction from a historically tactile and high-involvement category as retailers merge visualization tools with physical planning support. New store concepts emphasize smaller footprints for design consultations alongside Click and Collect services that lower delivery costs and shorten lead times for priority ranges. Flagship digital tools now allow room scanning and 3D placement to improve the fit of scale-sensitive items, which reduces return rates in bulky categories and improves confidence at checkout. Investment programs focus on additional small-format locations, distribution nodes, and end-to-end planning services that are critical to conversion in urban corridors. This combination lifts the reach of the furniture and home furnishing market by aligning digital discovery with reliable fulfillment and in-store support that simplifies complex decisions. According to the United States Census Bureau, quarterly retail e-commerce sales in the United States reached USD 310.3 billion in the third quarter of 2025, representing a 1.9 % increase from the previous quarter and a 5.1 % increase year-over-year. During the same period, total United States retail sales amounted to USD 1,893.6 billion, with e-commerce accounting for 16.4 % of the total. On a non-adjusted basis, e-commerce sales were USD 299.6 billion, making up 15.8 % of all retail sales and continuing a consistent growth trend over recent years, underscoring the increasing comfort of consumers with digital discovery and online purchasing, even for high-involvement items like furniture [3].
Post-Pandemic Work-From-Home Demand Spike Sustains Ergonomic and Home-Office Furniture Growth
Remote and hybrid work patterns have become part of normal workforce design, which sustains demand for ergonomic desks, task seating, and storage that fit in smaller home offices. According to the United States Census Bureau’s American Community Survey, 13.8 % of United States workers usually worked from home in 2023, more than double the share in 2019, reflecting a structurally higher base of home-based work even as some employees return to traditional offices [4]. Category leaders are refining home-focused lines that bring commercial ergonomics into residential settings with lighter footprints, quiet motors, and simplified controls. Product launches advanced sustainable material options and comfort features, complementing adjustable seating that aligns with recognized office performance standards. Corporate buyers and dealer networks are also standardizing residential-grade packages for distributed teams and project-based deployments across regions. This shift keeps home-office demand relevant in the furniture and home furnishing market, with new seating and desk lines anchored in ergonomics and materials innovation.
Restraints Impact Analysis of Furniture And Home Furnishing Market*
| Restraint | (~) % Impact on CAGR Forecast | Geographic Relevance | Impact Timeline |
|---|---|---|---|
| Volatility In Raw-Material Prices (Wood, Metals, Fabrics) | -1.3% | Global, acute in import-dependent markets | Short to Medium term (≤ 4 years) |
| Trade-Policy Uncertainties & Tariff Fluctuations | -1.1% | United States-China trade axis, Canada softwood lumber | Short to Medium term (≤ 4 years) |
| Supply-Chain Bottlenecks For Specialty Hardware | -0.6% | Global, regional variations by component type | Short term (≤ 2 years) |
| Rising Reverse-Logistics Costs From E-Commerce Returns | -0.9% | North America, Europe, high-penetration markets | Medium term (2-4 years) |
| Source: Mordor Intelligence | |||
Volatility in Raw-Material Prices Pressures Margins and Supply-Chain Stability
Lumber price volatility, duty changes, and supply curtailments have kept input costs unpredictable for wood-based categories and upstream suppliers. Framing lumber market movements since 2024 have challenged purchasing plans in sequential quarters, which complicates pricing and promotions for wood-heavy lines. In parallel, governments have tightened import protections on steel and derivative products, which elevates costs for metal frames, fittings, and components in seating and storage. These forces raise material-to-revenue ratios and require more focused cost control in freight, packaging, and returns to hold margins. As a result, brands are working earlier with suppliers on substitutions and design-to-value choices that stabilize lead times and costs in the furniture and home furnishing market.
Trade-Policy Uncertainties and Tariff Fluctuations Disrupt Sourcing Strategies
Shifts in tariff schedules and scope force companies to rebalance sourcing across China, Southeast Asia, North America, and Europe to manage delivered costs and duty exposure. Changes to softwood lumber regimes and steel import protections alter the relative economics of domestic versus imported inputs, which affects category-level pricing decisions and promotional calendars. Currency movements compound planning risk in tariff-sensitive lanes, which can affect the timing of purchase orders and inventory positioning near quarter-ends. To counter these pressures, companies are resizing supplier portfolios, mixing nearshore capacity with longstanding vendor relationships, and adjusting value engineering to meet target prices. As these policies evolve, the furniture and home furnishing market faces periodic cost pass-through and mix shifts that test consumer price tolerance and retailer agility.
*Our forecasts treat driver/restraint impacts as directional, not additive. The impact forecasts reflect baseline growth, mix effects, and variable interactions.
Furniture And Home Furnishing Market Segment Analysis
By Application:
Outdoor Furniture Captures Post-Pandemic Lifestyle Shift While Living Room DominatesLiving Room furniture commanded 35.26% of applications in 2025 within the furniture and home furnishing market, supported by staples such as sectionals, entertainment units, and coordinated tables that anchor daily use in homes. The Outdoor category is the fastest-moving application with an 8.12% CAGR through 2031, which reflects the lasting adoption of backyard and balcony settings as extensions of indoor living. This mix underscores how households now balance core indoor replacements with exterior upgrades that emphasize weather-proof materials and easy care. The furniture and home furnishing market benefits from brands that align indoor aesthetics with outdoor durability, improving cross-category basket sizes and coordinated looks for patios and decks. Stronger materials performance and modular sets also aid retail execution by simplifying selection and reducing service calls after installation.
The acceleration in outdoor specifications continues in hospitality and multifamily settings as project buyers add terraces, rooftop lounges, and shared courtyards to amenity programs. These installations favor products with recycled content and certifications alongside UV-resistant finishes that retain color and structural strength over multiple seasons. As outdoor assortments mature, retailers integrate visualization and space-planning tools to support set selection by size, seating count, and storage for covers and cushions. Living room still anchors the furniture and home furnishing market with consistent replacement cycles and style-driven updates that lift upholstery, case goods, and soft furnishings together. This balance between durable indoor staples and growing outdoor use supports steady revenue across applications in both residential and commercial channels.

By Material:
Plastic Surges on Recycled-Content Mandates While Wood Maintains DominanceWood held 46.61% material share in 2025 within the furniture and home furnishing market size, reflecting its durability, repairability, and strong consumer preference in visible case goods and premium seating. Engineered-wood variants help optimize resource use and cost while meeting emissions and performance thresholds required by institutional buyers. Compliance frameworks influence adhesive choices, finishes, and recycled-content claims, reinforcing supply-chain transparency and design-for-disassembly practices. As policy and buyer standards evolve, wood-based products with clear chain-of-custody and low-emission finishes continue to command strong demand. This positioning helps sustain the long-term role of wood in the furniture and home furnishing market across both residential and contract buyers.
Plastic is the fastest-growing material at an 8.36% CAGR through 2031, with the strongest momentum in outdoor lines where recycled HDPE and UV-stable polymers deliver multi-season performance. Mandates and procurement preferences for recycled content support innovations in blends and recyclability features that reduce waste and extend life. Metal remains critical to office and hospitality applications, with frames and hardware selected for strength, longevity, and ease of refurbishment. New standards and labeling programs guide buyers toward verified performance and sustainability tiers that align with rebates or green-building targets. Together, these developments align the furniture and home furnishing market with circularity goals and customer expectations on durability and end-of-life pathways.
By Distribution Channel:
B2C/Retail Leads with Omnichannel Pivot, While B2B/Project Accelerates on Hybrid WorkB2C/Retail captured 71.15% of the 2025 furniture and home furnishing market share, reflecting the category’s high involvement purchases, where in-store planning and tactile evaluation remain influential. The channel is integrating smaller design-led stores with pick-up points and service desks that improve the end-to-end path to purchase and reduce delivery friction. Retailers are using store remodeling and new formats to offer room-planning services and curated vignettes that speed decision-making on bigger-ticket sets. Parallel investments in microfulfillment and flexible delivery windows improve throughput on bulky shipments that require careful scheduling and site readiness. As these changes take hold, the furniture and home furnishing market sees more consistent conversion across online and store environments that complement each other.
B2B/Project accounted for the remaining share in 2025 and is the fastest-growing at a 7.25% CAGR as employers and institutions fit out activity-based spaces and refresh hybrid collaboration zones. Dealer networks and contract specialists are pairing ergonomic seating, height-adjustable work points, and mobile storage into standard packages for speed and scalability. Category leaders continue to release lines tailored for distributed teams and flexible spaces, supported by service programs for installation and reconfiguration. Corporate demand also drives adherence to labeling standards and indoor air quality criteria that qualify for procurement preferences or sustainability reporting. This broadening of project demand helps the furniture and home furnishing market capture recurring programs across workplace, education, healthcare, and hospitality.
Geography Analysis
North America Furniture and Home Furnishing Market
North America held 28.41 % of the global furniture and home furnishing market in 2025, with price sensitivity rising due to input cost fluctuations and tariff-related adjustments. Retailers are responding by refining assortments and investing in value-engineered solutions to maintain competitiveness. Volatility in lumber and import protections for steel and wood components has increased production costs for metal-framed and wood-based items. To counter logistics complexity, many operators are relying on smaller-format planning stores and micro-fulfillment centers to reduce delivery times for priority lines. These strategies help improve service levels and protect market share despite ongoing price pressures.
APAC Furniture and Home Furnishing Market
Asia-Pacific is the fastest-growing region, projected to expand at an 8.01 % CAGR through 2031, driven by urbanization, home formation, and a growing middle class. Rising incomes are fueling demand for premium and durable furniture, with buyers showing stronger preferences for certified materials and long-lasting finishes. The expansion of organized retail and e-commerce is improving access to branded collections and planned spaces with reliable after-sales support. Companies with strong local supplier networks and design localization are scaling faster across diverse housing types and climatic zones. These dynamics support steady growth for both residential and contract furniture markets throughout the region.
EMEA Furniture and Home Furnishing Market
Europe and the Middle East & Africa are also shaping the global market through regulatory and project-driven dynamics. In Europe, sustainability and circular economy regulations are influencing product design, sourcing, and material choices, while Digital Product Passports will simplify verification of compliance and end-of-life tracking. The UK shows steady replacement cycles for home-office and contract furniture, aided by hybrid work patterns and aligned procurement standards. In the Middle East and Africa, particularly the GCC, hospitality, residential, and mixed-use developments are driving demand for durable, high-performance contract furniture. Regional e-commerce growth and modular, specialty assortments are expanding consumer access, while aligning with project timelines and standards remains critical for scaling operations.
Regulatory Landscape
Regulation affecting the furniture and home furnishing market is tightening around product safety, trade measures, and material traceability, with direct implications for design, sourcing, and landed costs. In the United States, the STURDY Act (aligned to ASTM F2057-23) introduces mandatory stability testing requirements for clothing storage units effective March 2026, raising compliance and testing discipline for case goods sold through B2C and project channels.
Trade and sustainability policy are also reshaping procurement. Section 232 tariff mechanics changed effective April 6, 2026, shifting certain metal-related tariff calculations to the full customs value for products with metal components, while additional duty layers remain relevant for China-linked sourcing under Section 301. In Europe, wood-based categories face higher documentation and due diligence needs under the EU Deforestation Regulation (EUDR), including geo-location requirements for relevant inputs, while the Ecodesign for Sustainable Products Regulation (ESPR) is advancing preparatory work for furniture rules that push durability, repairability, and product information readiness across the value chain.
Value Chain Analysis
The global furniture and home furnishing value chain covers raw materials (timber, panels, metals, plastics, fabrics, adhesives and finishes), component and sub-assembly supply (hardware, mechanisms, foam, textiles), manufacturing and finishing, international and domestic logistics, distribution (B2C retail, online marketplaces, specialty stores, and B2B dealers), and downstream services such as delivery, installation, and returns processing. Compliance and quality gates increasingly sit upstream (chain-of-custody, emissions and chemical compliance) and downstream (product safety testing such as stability requirements for storage units), adding documentation and testing cost to categories that already face bulky logistics.
Supply and logistics conditions are also creating bottlenecks and incentives to regionalize. U.S. sourcing is more multi-origin, with 2025 import share split across Vietnam (22.5%), China (20.6%), and Mexico (20.0%) within total U.S. furniture imports of USD 61.1 billion, supporting dual-sourcing strategies and nearshore options for faster replenishment. At the same time, congestion risk remains visible, with Q1 2026 container dwell times at major European ports (Rotterdam, Hamburg, Antwerp) averaging 11.4 days (up 68% from Q4 2025), which increases the importance of inventory positioning, packaging optimization, and last-mile capability to reduce damage, missed deliveries, and reverse-logistics costs.
Competitive Landscape
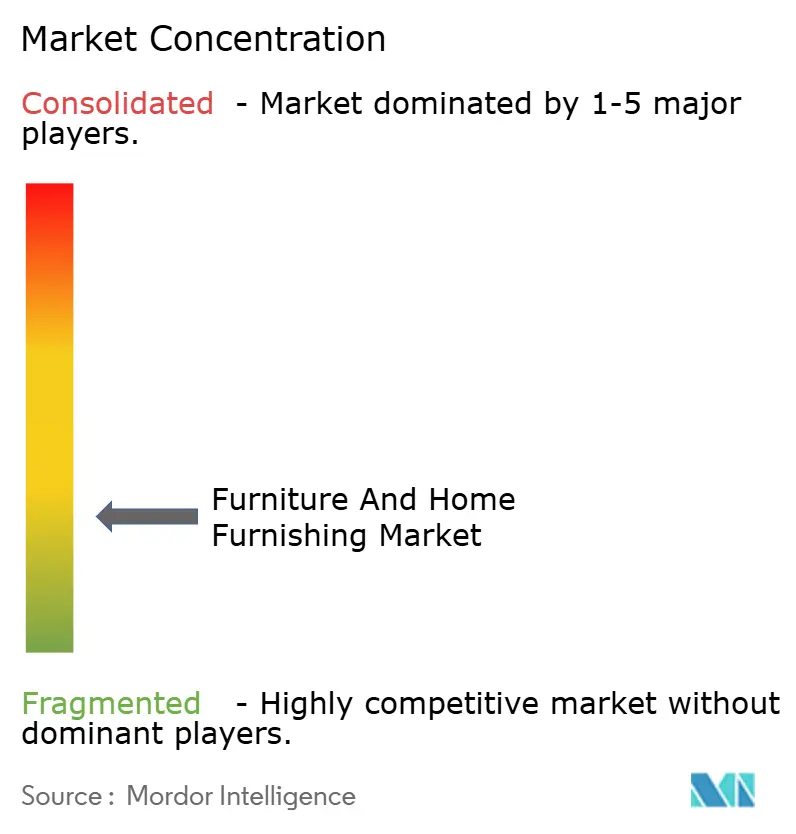
The furniture and home furnishing market remains highly fragmented, with the largest players holding a relatively small share of overall revenue. Leading companies include Inter IKEA Group, Ashley Furniture Industries, MillerKnoll, Steelcase, and Williams-Sonoma, while regional specialists, nimble pure-play retailers, and contract-focused suppliers continue to capture significant portions of the market. Retailers are investing in store format innovation, omnichannel integration, and planning services that blend digital discovery with in-store experiences. Premium-focused brands are emphasizing ergonomic design, verified sustainability, and workplace solutions that support hybrid and flexible office layouts. Together, these strategies maintain a diverse and competitive market landscape.
Major companies are focusing on vertical integration, logistics improvements, and expanding store networks to speed up delivery and reduce damage for bulky products. Inter IKEA Group is adding smaller-format planning points and enhancing fulfillment capacity to support omnichannel growth, while Ashley Furniture Industries is expanding United States manufacturing with new facilities aimed at boosting operational efficiency. Contract-focused brands are launching product lines that combine home-office ergonomics with residential aesthetics for hybrid work environments. These initiatives strengthen visibility and availability across regions and support a consistent market presence.
Product standards, sustainability goals, and evolving procurement rules are shaping innovation and compliance among market leaders. MillerKnoll continues to scale core product lines and expand retail operations to meet enterprise buyer expectations, while Steelcase integrates workplace solutions with brand collaborations designed for hybrid and modern office environments. Ecolabels and material reporting standards are increasingly influencing design, emissions, and end-of-life management, favoring companies with strong compliance infrastructure. Williams-Sonoma balances pricing actions, shareholder returns, and selective growth to manage cost pressures from tariffs. Retailers are also optimizing sourcing strategies, including nearshoring and dual sourcing, to stabilize costs while maintaining product quality, ensuring steady execution in a complex market.
Furniture And Home Furnishing Industry Leaders
-
Inter IKEA Group
-
Ashley Furniture Industries
-
Herman Miller (MillerKnoll)
-
Steelcase
-
Williams-Sonoma
- *Disclaimer: Major Players sorted in no particular order
Furniture And Home Furnishing Market Companies Covered in this Report
- Inter IKEA Group
- Ashley Furniture Industries
- Herman Miller (MillerKnoll)
- Steelcase
- Williams-Sonoma
- La-Z-Boy
- Kimball International
- HNI Corporation
- Wayfair
- Ikea Systems BV (Franchisor)
- Mohawk Industries
- Shaw Industries Group
- Haworth
- Duresta Upholstery
- Cisco Brothers
- Greenington
- Vermont Woods Studios
- Tempur-Sealy International
- Haverty Furniture
- Godrej Interio
Market Opportunities and Future Outlook
A whitespace exists in compliance-ready, traceable materials and product information systems as regulations and buyer procurement rules tighten across regions. EU sustainability initiatives, including EUDR documentation requirements for relevant wood inputs and the ongoing ESPR preparatory work for furniture, support demand for chain-of-custody wood, verified recycled content (notably in outdoor plastics), and supplier verification workflows that can be presented at checkout and in project tenders. Companies that industrialize product data, testing documentation, and supplier due diligence can reduce friction for both B2C and B2B purchases, while improving assortment agility when tariffs or input availability shift.
Operationally, the opportunity is converting omnichannel growth into lower delivery and returns cost through better visualization, planning services, and last-mile execution for bulky goods. Digital purchasing is structurally embedded in key markets, with U.S. retail e-commerce at USD 310.3 billion in Q3 2025 (16.4% of total retail sales), supporting continued investment in room planning tools, click-and-collect, and smaller planning-led store formats that de-risk fit and reduce reverse logistics. On the supply side, the April 6, 2026 Section 232 tariff calculation change and ongoing Section 301 exposure increase the payoff from multi-country sourcing, nearshoring where feasible, and tighter bill-of-materials engineering for metal components to protect delivered-price competitiveness.
Recent Industry Developments in Furniture And Home Furnishing Market
- June 2026: MillerKnoll reports fourth quarter and full fiscal year 2026 results. The release highlights strength in premium office and home furnishings, pointing to sustained demand in premium segments. The results inform channel strategies and product mix decisions that support premiumization.
- June 2026: Inter IKEA Group launched the global Rainforest Restoration Lab. The launch advances sustainability linked to the furniture supply chain. It also demonstrates risk management and ESG alignment that affect supplier resilience and product sourcing.
- April 2026: Williams-Sonoma, Inc. partnered with Kelly Wearstler to launch Breville Mixed Metals Collection. The collaboration expands premium kitchen appliance categories through design-led collections. The partnership supports brand differentiation and designer-driven product strategies in premium retail.
Furniture And Home Furnishing Market Report Scope and Research Methodology
Market Definition and Coverage
This market covers the value of finished furniture and home furnishing products sold for residential and contract use, across offline and online channels, and counted at the point of sale in each country.
Scope exclusions: We exclude building fixtures and installed interiors (such as fixed cabinetry that is part of construction) and also exclude services like interior design and logistics when they are billed separately.
Segments Covered in This Report
- By Application
- Kitchen
- Living Room
- Bedroom
- Bathroom
- Outdoor
- Other Furniture
- By Material
- Wood
- Metal
- Plastic
- Fabric
- Others
- By Distribution Channel
- B2C / Retail
- Home Centers
- Specialty Furniture Stores
- Online
- Other Distribution Channels
- B2B / Project
- B2C / Retail
- By Geography
- North America
- Canada
- United States
- Mexico
- South America
- Brazil
- Peru
- Chile
- Argentina
- Rest of South America
- Europe
- United Kingdom
- Germany
- France
- Spain
- Italy
- BENELUX (Belgium, Netherlands, Luxembourg)
- NORDICS (Denmark, Finland, Iceland, Norway, Sweden)
- Rest of Europe
- Asia-Pacific
- India
- China
- Japan
- Australia
- South Korea
- South East Asia (Singapore, Malaysia, Thailand, Indonesia, Vietnam, Philippines)
- Rest of Asia-Pacific
- Middle East and Africa
- United Arab Emirates
- Saudi Arabia
- South Africa
- Nigeria
- Rest of Middle East and Africa
- North America
Data Sources, Market Sizing, and Validation
Desk Research
Desk research is used to set the outer guardrails for the model and to keep category boundaries consistent across regions. We use public sources such as UN Comtrade, national statistical offices (for household expenditure and retail sales), the US Census Bureau and Bureau of Economic Analysis, Eurostat, and World Bank macro series for housing, income, and inflation context.
This is complemented with supplier and retailer filings, investor presentations, earnings call transcripts, and reputable trade press to understand price movement, channel shifts, and product mix changes. Select paid subscriptions are used only to speed up tasks such as company financial capture, patent lookups for material and design trends, and shipment-level import-export checks in major trade corridors. The sources listed here are illustrative, and other references were also used to collect, clarify, and cross-check inputs.
Primary Interviews and Surveys
Primary work focuses on validating demand and pricing assumptions that are not consistently visible in public datasets, especially for category mix and channel margins. We spoke with manufacturers, distributors, retailers, sourcing teams, and large buyers (including project and institutional purchasers) across major regions to confirm volumes, average selling price movement, and the timing of demand swings linked to housing and renovation cycles.
Distribution of primary research fieldwork respondents
| Company type | Respondent position | Region |
|---|---|---|
| Top tier: 25% | CXOs: 19% | APAC: 41% |
| Mid tier: 56% | Functional/Unit leaders: 36% | EMEA: 36% |
| Smaller Players: 19% | Managers: 45% | Americas: 23% |
Market-Sizing & Forecasting
The main build uses a top-down and bottom-up approach, where production, trade, and category retail spending are reconstructed by country and then allocated into furniture and home furnishing lines using consistent classification rules. To keep the totals realistic, we corroborate them with selective bottom-up approximations, such as sampled average selling prices multiplied by shipment or sales volumes for key categories, and channel checks on online versus store-based share.
We track several market fingerprints because they explain most year-to-year swings. These include housing starts and permits, home price and renovation activity indicators, furniture and household goods CPI trends, import dependency by major furniture HS codes, and e-commerce penetration for bulky home goods. When country detail is thin, we handle gaps through proxy ratios built from similar markets (income bands, urbanization, and import share) and then correct them using interview feedback.
For forecasting, we use scenario analysis with short variable-driven adjustments, since housing cycles, discretionary spending, and freight and material costs can shift quickly. The forward path is anchored on consensus expectations gathered from primary respondents on pricing pass-through, channel mix, and the speed of demand normalization after major macro shocks.
Data Validation & Update Cycle
Model outputs are triangulated against independent signals, including trade totals, inflation-adjusted retail value trends, and major company revenue direction, and then reviewed for outliers at country and region level. When a variance looks unusual, we recheck classification drift, currency timing, and double counting between furniture and adjacent home categories, then apply a second analyst review before sign-off.
Reports are refreshed annually, and interim updates are triggered if there is a material event such as a major trade disruption, a sharp input cost move, or a demand shock visible in housing and retail indicators. Before delivery, we run a fresh pass on the most recent public datapoints and interview notes so the final numbers reflect the latest available view.
Mordor Intelligence's Furniture and Home Furnishing Market Estimate Compared With Other Published Estimates
Published market values for furniture and home furnishing rarely match perfectly because authors do not always count the same products, and they may use different years, currency timing, and inflation handling. Some estimates also lean more on production or trade, while others lean more on consumer spending, which can shift the totals even when the direction is similar.
Some published figures widen the basket to include parts of the broader furniture ecosystem, including services and enabling activities around the product sale. Mordor Intelligence counts only finished furniture and home furnishing product value, and it keeps services like interior design and separately billed logistics outside the market to prevent scope inflation.
Benchmark comparison
| Source | Market Size | Gaps in Research Methodology |
|---|---|---|
| Mordor Intelligence | USD 1.00 T (2026) | |
| Trade Journal A | USD 1.00 T (2026) | This figure is presented as an approximate size for the broader furniture ecosystem, which can blend product revenue with adjacent services and value chain activities, and it is not always explicit on pricing basis and exclusions. |
| Industry Publication B | USD 0.44 T (2025) | This estimate focuses on the furniture market and is commonly framed around furniture consumption tracking, which can leave out parts of home furnishing and may differ on trade versus retail value treatment and on country coverage depth. |
The spread in the table is mainly explained by how wide the product basket is, and whether the number is closer to retail value of finished goods or a narrower consumption measure for furniture only. By keeping the inputs tied to repeatable indicators such as trade flows, retail value context, and price movement checks from interviews, we produce a practical number that can be traced back to clear steps.
Key Questions Answered in the Report
What is the current size and growth outlook for the furniture and home furnishing market?
The furniture and home furnishing market size is USD 1.00 trillion in 2026 and is projected to reach USD 1.43 trillion by 2031 at a 7.39% CAGR, reflecting sustained demand across residential and project channels.
Which product applications are leading and which are growing the fastest in this space?
Living Room leads with 35.26% of 2025 revenue, while Outdoor is projected to grow the fastest at an 8.12% CAGR through 2031 as exterior spaces become extensions of indoor living.
How do materials trends shape the competitive outlook?
Wood retains a 46.61% share in 2025 due to consumer preference and durability, while Plastic is the fastest-growing material at an 8.36% CAGR, supported by recycled-content mandates and outdoor use cases.
Which regions are most important for near-term growth?
North America holds 28.41% of 2025 revenue, while Asia-Pacific is the fastest-growing region at an 8.01% CAGR based on urbanization and rising household incomes across key markets.
How are regulations influencing product and sourcing decisions?
EU circularity rules and procurement standards prioritize durability, repairability, recycled content, and verified ecolabels, which shape materials choices and supply-chain documentation for products sold in Europe.
What strategic moves are leaders making to strengthen positioning?
Leading companies are investing in smaller format planning stores, fulfillment capacity, and standards alignment while executing pricing and capital actions to offset input volatility and tariff exposure.