
Market Overview
| Study Period | 2020 - 2031 |
|---|---|
| Market Size (2026) | USD 1.64 Billion |
| Market Size (2031) | USD 6.16 Billion |
| Growth Rate (2026 - 2031) | 30.27 % |
| Fastest Growing Market | North America |
| Largest Market | Asia-Pacific |
| Market Concentration | High |
Major Players *Disclaimer: Major Players sorted in no particular order Image © Mordor Intelligence. Reuse requires attribution under CC BY 4.0. | |
Fuel Cell Vehicle Market Analysis by Mordor Intelligence
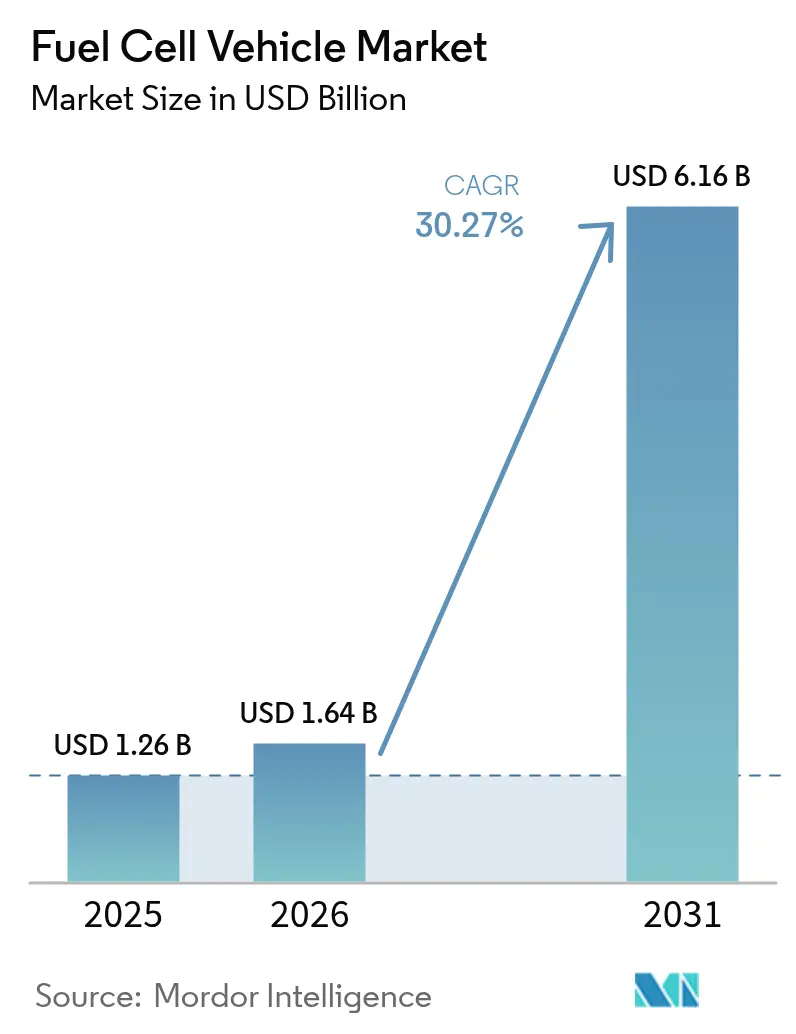
The fuel cell vehicle market size in 2026 is estimated at USD 1.64 billion, growing from 2025 value of USD 1.26 billion with 2031 projections showing USD 6.16 billion, growing at 30.27% CAGR over 2026-2031. This acceleration reflects a fundamental shift from experimental deployments to commercial viability, driven by heavy-duty applications where hydrogen's energy density advantages over battery-electric alternatives become economically compelling. The market's momentum stems from converging policy frameworks, particularly the US Inflation Reduction Act's USD 3 billion in hydrogen production tax credits and the EU's Net-Zero Industry Act targeting 10 million tonnes of renewable hydrogen by 2030.[1]“Hydrogen Shot and Regional Clean Hydrogen Hubs,” US Department of Energy, energy.gov .
Key Report Takeaways
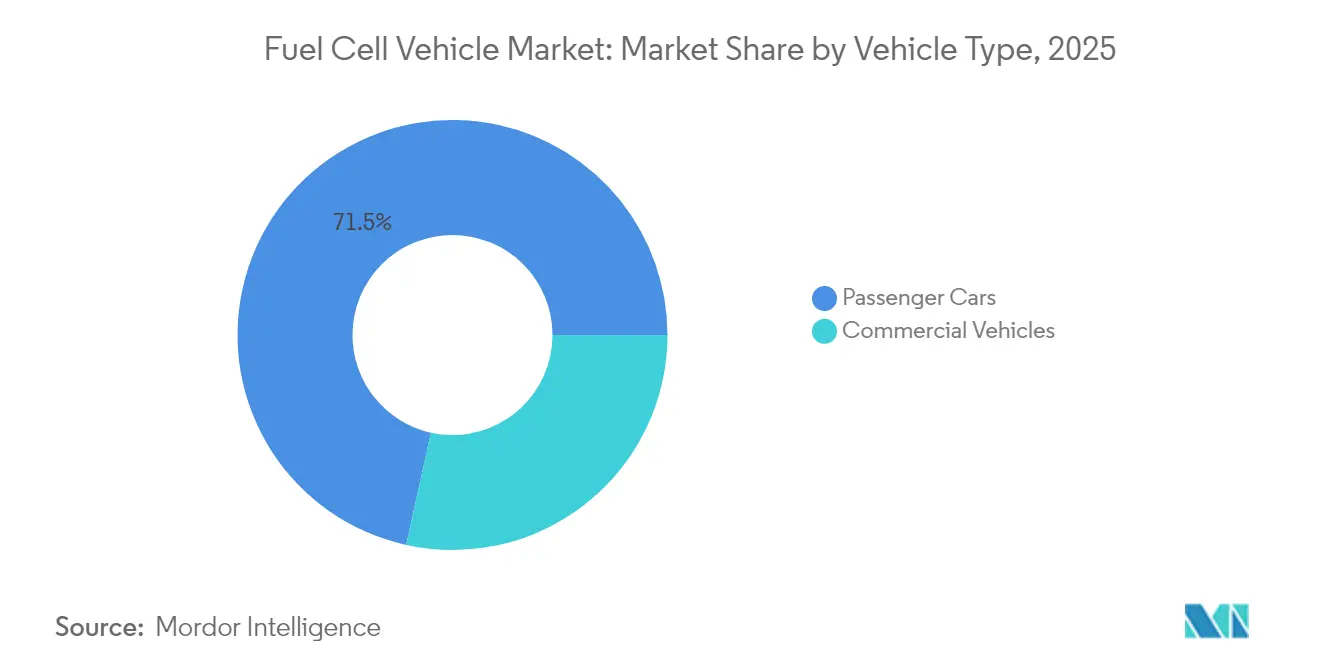
- By vehicle type, passenger cars held 71.54% of the fuel cell vehicle market share in 2025, while commercial vehicles recording the highest 47.10% CAGR through 2031.
- By fuel-cell type, PEM dominated with 90.85% 2025 revenue share; SOFC range-extenders are set to grow at 42.10% CAGR to 2031.
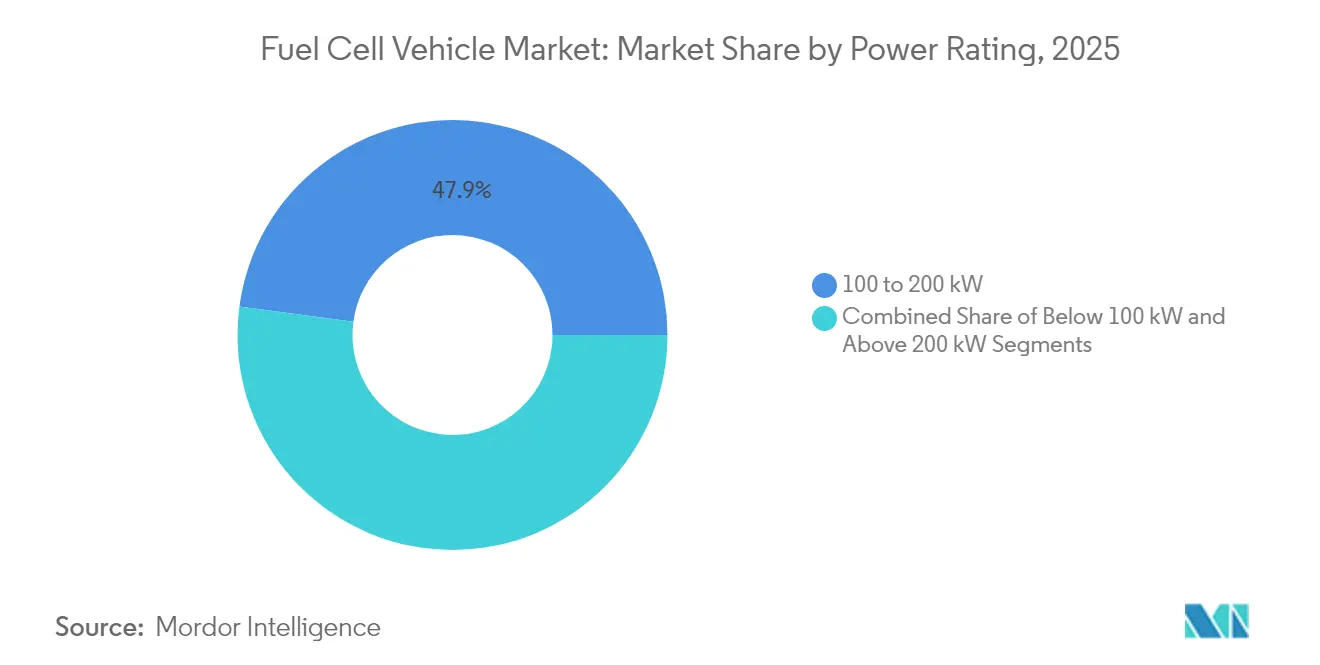
- By power rating, the More than 200 kW segment captured 49.40% CAGR leadership, whereas the 100 to 200 kW segment retained the largest 47.88% 2025 share.
- By component, Stack modules held the largest 43.70%, hydrogen storage systems is growing at 41.95% CAGR to 2031.
- By geography, Asia-Pacific accounted for 52.60% of the 2025 fuel cell vehicle market share; North America is forecast to post a 46.85% CAGR to 2031.
Note: Market size and forecast figures in this report are generated using Mordor Intelligence’s proprietary estimation framework, updated with the latest available data and insights as of 2026.
Market Trends and Insights
Drivers Impact Analysis of Fuel Cell Vehicle Market*
| Driver | (~) % Impact on Market CAGR | Geographic Relevance | Impact Timeline |
|---|---|---|---|
| National ZEV and Hydrogen Road-Maps | +8.5% | Global, with strongest impact in US, EU, China, South Korea | Medium term (2-4 years) |
| Rising Heavy-Duty Fuel-Cell Truck | +6.2% | North America & EU, expanding to APAC | Short term (≤ 2 years) |
| China's "hydrogen port" Clusters | +4.8% | APAC core, spill-over to MEA ports | Medium term (2-4 years) |
| IRA & EU Net-Zero Industry Tax Credits | +7.1% | North America & EU | Short term (≤ 2 years) |
| Ammonia-to-Hydrogen Advances | +3.4% | Global, early adoption in maritime corridors | Long term (≥ 4 years) |
| OEM Shift to Methanol | +2.8% | EU & North America, expanding globally | Medium term (2-4 years) |
| Source: Mordor Intelligence | |||
National Zero-Emission-Vehicle and Hydrogen Road-maps Drive Market Transformation
Government mandates are reshaping fuel cell vehicle adoption through coordinated policy frameworks that simultaneously address supply and demand constraints. South Korea leads with 14,500 fuel cell electric vehicles, representing 33% of global deployment, supported by incentives reducing vehicle costs by approximately 50% and targets for 6.2 million hydrogen vehicles by 2040. The US Department of Energy's hydrogen strategy allocates USD 9.5 billion through the Bipartisan Infrastructure Law, targeting 10 million metric tons of annual production by 2030, while projecting 10-15% of trucks will utilize fuel cells by 2050. Japan's Hydrogen Society Promotion Act establishes 15-year price support programs and production hub development, aiming for a 12-million-ton hydrogen supply by 2040. These coordinated approaches create self-reinforcing cycles where infrastructure investment enables vehicle deployment, which justifies expanded refueling networks. China's allocation of USD 321 million for regional hydrogen fuel cell vehicle deployment demonstrates how targeted funding accelerates market formation beyond organic growth patterns.
Heavy-Duty Fuel Cell Truck Pilots Establish Commercial Viability
Freight corridor demonstrations prove fuel cell trucks' operational superiority in specific use cases, creating replicable business models for broader deployment. Nikola leads deployment with 90 trucks shipped in Q3 2024, representing 3,000% year-over-year growth, while establishing hydrogen refueling partnerships across key freight routes. Daimler Truck's liquid hydrogen system achieves a 650-mile range with a 45,000-pound payload, demonstrating a competitive advantage over battery-electric alternatives in long-haul applications where weight and refueling time directly impact profitability. Hyundai's XCIENT trucks logged over 13 million kilometers across 13 countries, providing real-world validation of 180 kW fuel cell systems' durability and 450-mile operational range. The National Renewable Energy Laboratory projects zero-emission trucks achieving total cost of ownership parity with diesel by 2035, with fuel cell vehicles particularly advantaged in applications requiring rapid refueling and high daily utilization. These demonstrations establish proof points fleet operators can reference when justifying capital investments, accelerating adoption beyond early-adopter segments.
China's Hydrogen Port Clusters Create Industrial Ecosystem
China's integration of fuel cell forklifts and yard tractors in port operations demonstrates how concentrated industrial applications can achieve economies of scale while building hydrogen infrastructure for broader vehicle deployment. Port operations provide ideal conditions for fuel cell adoption due to predictable duty cycles, centralized refueling infrastructure, and stringent emission regulations in coastal urban areas. The approach leverages existing industrial hydrogen supply chains while creating anchor demand that justifies infrastructure investments for other vehicle types. China's leadership in fuel cell installations, with 506 MW cumulative capacity primarily for trucks and buses, reflects systematic deployment strategies that prioritize high-utilization applications. This model enables port authorities to meet decarbonization targets while demonstrating fuel cell technology's commercial viability to other industrial operators.
IRA & EU Net-Zero Industry Act Accelerate Manufacturing Scale
Manufacturing incentives are shifting fuel cell production economics by reducing capital costs and enabling domestic supply chain development. The US Inflation Reduction Act provides production tax credits for fuel cell manufacturing alongside hydrogen production incentives, creating integrated value chain support that reduces technology costs. EU investments exceed USD 60 billion for battery and fuel cell manufacturing from 2022-2023, with the Net-Zero Industry Act targeting domestic production capacity to reduce import dependence. These policies address the chicken-and-egg problem where high costs prevent scale, which prevents cost reduction, by providing temporary support during the transition to commercial viability. BMW's partnership with Toyota for 2028 fuel cell vehicle production reflects confidence that manufacturing incentives will enable cost-competitive systems.
Restraints Impact Analysis of Fuel Cell Vehicle Market*
| Restraint | (~) % Impact on Market CAGR | Geographic Relevance | Impact Timeline |
|---|---|---|---|
| Slow Roll-Out of Public Stations | -5.8% | Global, Most Severe in Emerging Markets | Medium term (2-4 years) |
| Battery-Price Plunge Tilting TCO in Favor of BEVs | -4.2% | Global, Strongest Impact in Light-Duty Segments | Short term (≤ 2 years) |
| Persistent On-Board Hydrogen Tank Delays | -2.1% | EU, with Spillover to Other Regulatory Regions | Short term (≤ 2 years) |
| Nickel-based Catalyst Supply Risk Management | -1.9% | Global, Concentrated in High-Volume Applications | Long term (≥ 4 years) |
| Source: Mordor Intelligence | |||
Slow Roll-out of Public 700-bar Stations Constrains Market Expansion
Infrastructure deployment lags vehicle availability, creating geographic constraints that limit fuel cell vehicle adoption to specific corridors and metropolitan areas. Global hydrogen refueling stations reached only 1,369 by end-2024, with 79% concentrated in China, South Korea, Japan, France, and Germany, leaving vast regions without access. California's hydrogen network decreased to 62 operational stations in 2024 due to supply and reliability issues, forcing automakers to revise FCEV sales projections to only 20,500 vehicles by 2030.[2] “Hydrogen Station Network Update 2024,” California Air Resources Board, arb.ca.gov. The hydrogen fueling station market requires USD 6.17 billion investment by 2034 to support projected vehicle deployment, yet current funding mechanisms remain insufficient for rapid expansion. Station development timelines average 1.6 years compared to 4.9 years for earlier projects, indicating improving processes, yet the absolute number of new stations remains below requirements for mass market adoption.
Battery-Price Plunge Tilts TCO Toward BEVs in Short-Range Applications
Rapidly declining battery costs are expanding the range of applications where battery-electric vehicles achieve total cost of ownership advantages over fuel cell alternatives. Battery system costs may decrease 64-75% by 2050 while fuel cell costs drop 65-85%, yet battery cost reductions are occurring faster and from a lower baseline. The total cost of ownership analysis shows that battery-electric trucks will become competitive with diesel by 2030 in most applications, while fuel cell trucks will face higher hydrogen costs, currently ranging from USD 30-40 per kilogram. The crossover point where fuel cells maintain an advantage occurs primarily in heavy-duty, long-haul applications requiring rapid refueling and high daily utilization, narrowing the addressable market compared to earlier projections. This dynamic forces fuel cell manufacturers to focus on specific niches rather than broad market adoption, potentially limiting scale economies needed for further cost reduction.
*Our forecasts treat driver/restraint impacts as directional, not additive. The impact forecasts reflect baseline growth, mix effects, and variable interactions.
Fuel Cell Vehicle Market Segment Analysis
By Vehicle Type:
Commercial Applications Drive Market TransformationPassenger Cars had a 71.54% of the 2025 share of the fuel cell vehicle market. Heavy-duty trucks benefit from 650-mile ranges and 10-minute refuels that preserve freight utilization metrics. Transit buses are scaling quickly in China—more than 1,000 units—as municipal authorities integrate hydrogen depots with depot-charging hubs. Delivery vans employing methanol-reforming range-extenders circumvent hydrogen station shortages, advancing zero-emission compliance for urban logistics fleets. The structural tilt toward fleet segments underpins long-term resilience of the fuel cell vehicle market.
Commercial vehicles lead growth with a 47.10% CAGR to 2031. Conversely, passenger cars’ share falls despite unit growth as price-sensitive consumers gravitate to battery EVs for short-distance use cases.


By Fuel-Cell Type:
SOFC Range-Extenders Challenge PEM DominancePEM units supplied 90.85% of fuel cell stacks in 2025, but SOFC range-extenders are forecast to deliver 42.10% CAGR through 2031, exceeding PEM’s. High-temperature SOFCs operate at 500–700 °C, enabling 60–72% system efficiency and tolerance for methanol or ammonia, which eases fuel logistics in infrastructure-poor regions. BMW’s pilot vans with Ceres Power SOFC modules illustrate automaker interest in a platform that can piggyback existing liquid-fuel supply chains.
SOFC solutions now commanded less than 2.80% of the 2025 fuel cell vehicle market size, yet could capture above 8.60% by 2031 if supply chains scale. PEM is expected to keep the majority share but face progressive erosion as multi-fuel flexibility becomes a competitive differentiator.
By Power Rating:
High-Power Systems Enable Heavy-Duty ApplicationsThe 100–200 kW bracket held 47.88% of 2025 revenue, balancing power and cost for regional distribution trucks and premium passenger vehicles. Below 100 kW stacks continue serving forklifts and compact cars, but their share declines as automotive OEMs scale higher-output platforms. Systems rated more than 200 kW booked a 49.40% CAGR, buoyed by Class 8 truck roll-outs that prioritize payload retention and hill-climb performance.
Total revenue for the More than 200 kW class is set to rise from 2025 to 2031, representing second largest share of the projected fuel cell vehicle market size. Hyundai’s 180 kW XCIENT platform and Daimler Truck’s 230 kW GenH2 prototype underscore the industry pivot toward high-power architecture.
By Component:
Hydrogen Storage Innovation Drives System IntegrationStack modules held the largest 43.70% share but decelerated as learning curves flattened, hydrogen storage rises fastest at 41.95% CAGR as Type-IV carbon-fiber tanks and cryo-compressed systems enhance volumetric density. Plant support systems—including compressors, humidifiers, and thermal loops—contributed 24%, while e-drive components added 13% to the total bill-of-materials. Daimler Truck’s liquid hydrogen system shows how advanced storage can unlock a 650-mile range without increasing chassis weight, underpinning competitive advantage in the fuel cell vehicle market.
Geography Analysis
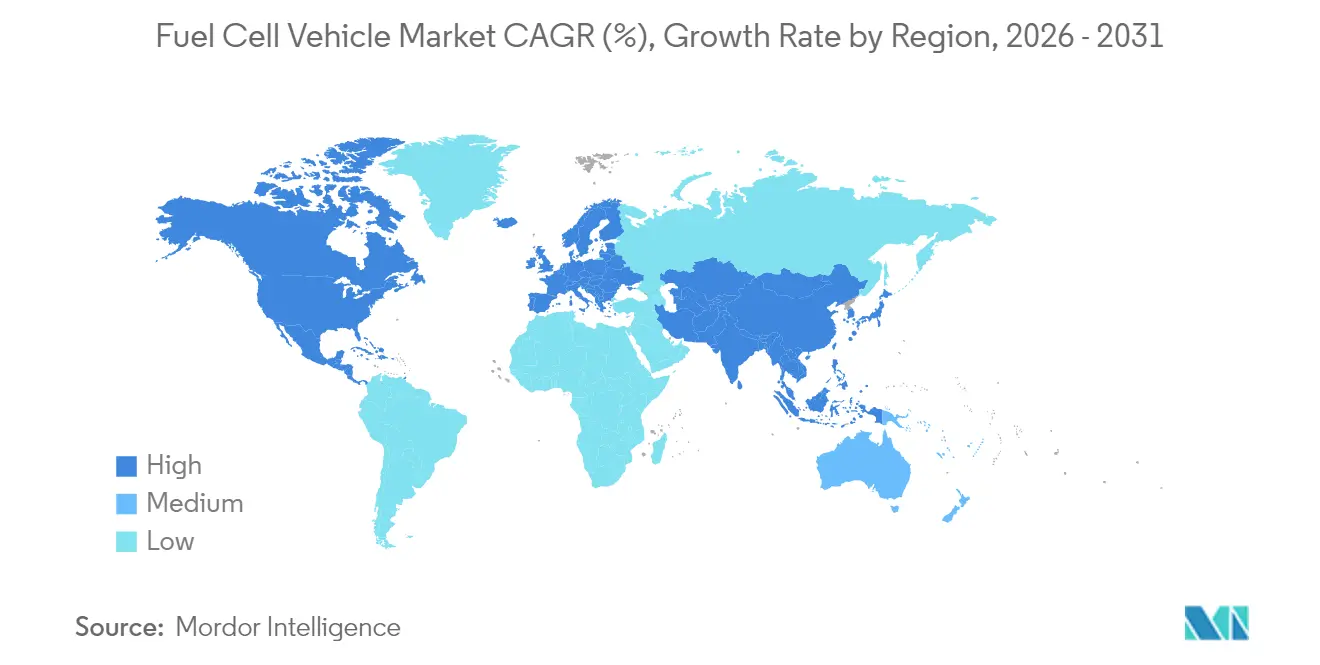
APAC Fuel Cell Vehicle Market
Asia-Pacific retained a 52.60% 2025 share because China, Japan, and South Korea built integrated hydrogen ecosystems spanning production, distribution, and vehicle incentives. China installed 506 MW of fuel cell capacity and is targeting 100,000 fuel cell trucks by 2030, leveraging port and steel-plant hydrogen by-products. South Korea’s 14,500 vehicles ride on subsidies that cut sticker prices by 50%, while the national roadmap calls for 6.2 million units by 2040. Japan remains the global leader in stationary deployments, but transportation uptake is accelerating under 15-year price guarantees.
North America Fuel Cell Vehicle Market
North America leading 46.85% CAGR through 2031 thanks to the Inflation Reduction Act’s hydrogen provisions and California’s zero-emission mandates. The US Department of Energy funds seven regional hydrogen hubs, each required to serve mobility loads, ensuring a pipeline of demand for the fuel cell vehicle market. Hyundai’s USD 21 billion plan for US fuel cell truck production and infrastructure exemplifies foreign OEM confidence in policy stability.
Europe Fuel Cell Vehicle Market
Western and Central Europe is growing, spearheaded by Germany’s 113 public stations and the EU’s 10-million-ton hydrogen target. Daimler Truck secured EUR 226 million to field 100 liquid-hydrogen trucks. At the same time, the Clean Hydrogen Joint Undertaking injects EUR 113.5 million into R&D. BMW’s Toyota alliance signals broader European OEM alignment behind hydrogen as a complement to battery EVs.

Regulatory Landscape
Fuel cell vehicles are governed by increasingly harmonized hydrogen safety rules, alongside hydrogen production and infrastructure programs that indirectly shape demand. In the United States, NHTSA published FMVSS No. 307 (Fuel system integrity of hydrogen vehicles) and FMVSS No. 308 (Compressed hydrogen storage system integrity) in January 2025. The updates align requirements with GTR No. 13 Phase 2 and set an effective compliance date of September 2028 for vehicles equipped with compressed hydrogen storage systems.
In June 2026, UN WP.29/GRSP adopted a new UN Regulation covering liquefied hydrogen storage systems (LHSS) for categories M2, M3, N2, and N3. This establishes a type-approval pathway for liquid-hydrogen vehicle configurations that are central to heavy-duty use cases. In Europe, hydrogen mobility policy continues to track transport decarbonization targets, including Renewable Energy Directive (RED) transposition progress in member states and European Commission actions such as the automotive Industrial Action Plan (March 2025), which includes AFIF support for alternative-fuels infrastructure across 2025-2026.
Value Chain Analysis
The FCV value chain extends from raw materials (platinum group metals for catalysts and carbon fiber for Type-IV tanks) to MEA and stack production. It also covers balance-of-plant subsystems (air supply, humidification, thermal management, and power electronics), hydrogen storage systems (700 bar gaseous or liquid hydrogen), vehicle integration, and downstream hydrogen supply and retail dispensing. Automotive-grade qualification and serial production readiness remain gating factors, and safety-critical parts require stringent validation and Production Part Approval Process (PPAP)-style sign-offs before scale shipments.
Recent partnership activity points to a more mature upstream stack-and-system supply base and a growing ecosystem approach in trucks. Daimler Truck, Volvo Group, cellcentric, and Toyota Motor Corporation signed an MoU in March 2026 for Toyota to join cellcentric as an equal shareholder, improving access to fuel cell system scale for heavy-duty platforms. In April 2026, Isuzu and Toyota agreed to jointly develop a mass-produced light-duty fuel cell electric truck (targeting production start in fiscal year 2027), while Toyota Motor North America and Hyroad Energy (May 2026) paired truck deployments with hydrogen supply and station planning, showing how OEMs, energy suppliers, and fleet operators are bundling vehicles, fuel, and refueling to reduce adoption friction.
Competitive Landscape
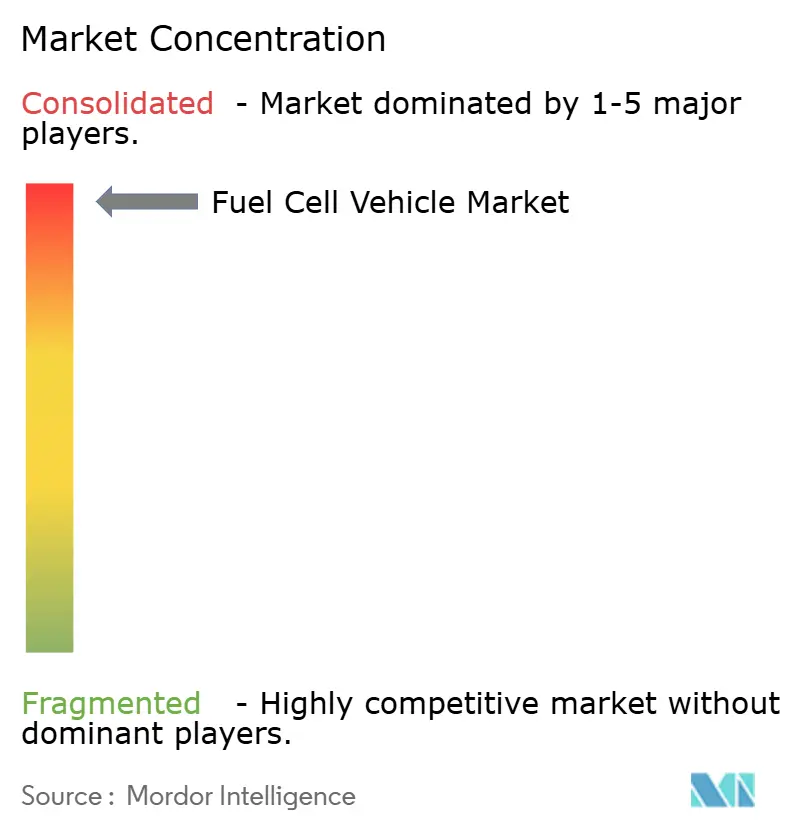
Competition is highly concentrated, featuring diversified strategies among legacy OEMs and pure-play fuel cell firms. Toyota leads passenger cars with Mirai sales and is refining a third-generation stack that cuts platinum loading. Hyundai’s ecosystem approach covers trucks, buses, and forklifts delivered under its Hydrogen Vision 2040 roadmap. BMW plans series production in 2028 through its partnership with Toyota, leveraging PEM maturity while co-developing SOFC range-extenders with Ceres Power.
Ballard Power Systems supplied 130 MW to global bus fleets, focusing on module standardization for faster OEM integration. Nikola delivered 90 fuel cell trucks in one quarter, underlining a first-mover push in North America with bundled vehicle-and-fuel contracts. Chinese OEMs SAIC and FAW are scaling stack production to serve domestic mandates, sharpening price competition worldwide.
Strategic patterns emphasize vertical integration and ecosystem development rather than component-level competition, reflecting fuel cell vehicles' dependence on hydrogen infrastructure and supply chains. Technology differentiation centers on power density improvements, fuel flexibility through SOFC systems, and manufacturing cost reduction through automotive-scale production. White-space opportunities emerge in medium-duty delivery vehicles where methanol-reforming fuel cells enable zero-emission operation without hydrogen infrastructure, and in industrial applications like port equipment where centralized refueling justifies infrastructure investments. The US Department of Energy's National Electric Vehicle Infrastructure program standards create opportunities for companies developing integrated charging and hydrogen refueling facilities, while BMW's filing for hydrogen vehicle safety systems demonstrates ongoing patent activity in critical enabling technologies .[3] “FMVSS 307 & 308 Hydrogen Fuel Systems,” Federal Register, federalregister.gov.
Fuel Cell Vehicle Industry Leaders
Volkswagen AG
Mercedes-Benz Group
Honda Motor Company Limited
Hyundai Motor Company
Toyota Motor Corporation
- *Disclaimer: Major Players sorted in no particular order
Fuel Cell Vehicle Market Companies Covered in this Report
- Toyota Motor Corporation
- Hyundai Motor Company
- Honda Motor Co., Ltd.
- BMW Group
- Mercedes-Benz Group AG
- General Motors Company
- Volkswagen AG
- SAIC Motor Corporation
- FAW Group
- Stellantis N.V.
- Daimler Truck AG
- Volvo Group
- MAN Truck & Bus SE
- Ballard Power Systems
- Plug Power Inc.
- Nikola Corporation
- Great Wall Motor Co., Ltd.
- Foton Motor Co., Ltd.
- Doosan Fuel Cell Co., Ltd.
- Horizon Fuel Cell Technologies

Market Opportunities and Future Outlook
Commercial fleets and corridor-based deployments are the most actionable whitespace, since they concentrate utilization and refueling demand and improve infrastructure economics versus dispersed retail passenger-car use. In May 2026, Toyota Motor North America signed an agreement with Hyroad Energy to deploy 40 Class 8 fuel cell trucks in Southern California. The deal also includes steps to develop hydrogen supply at the North American Parts Center California campus, illustrating integrated fleet-plus-fuel models that logistics operators and drayage fleets can replicate. Cross-border and emerging-market fleet deployments broaden addressable demand beyond the most mature hydrogen regions, including Hyundai (March 2026) announcing deployment of eight XCIENT Fuel Cell Class-8 trucks in Uruguay for timber logistics.
Public funding programs and clearer safety rules support near-term buildout of refueling and vehicle programs when station reliability limits adoption. In April 2026, the California Energy Commission released GFO-25-607 to fund hydrogen refueling infrastructure for on-road fuel cell electric vehicles. This creates procurement opportunities for station developers, hydrogen suppliers, compression and dispensing OEMs, and EPC contractors. On the technology and supply side, heavy-duty system scaling remains a major lever, supported by German public funding for Daimler Truck's NextGenH2 program and industry bodies such as FCHEA prioritizing US DOE hydrogen and fuel cell RDD&D budgets in FY2026, which indicates continued activity across stacks, storage, and integrated vehicle platforms.
Recent Industry Developments in Fuel Cell Vehicle Market
- May 2026: Toyota Motor North America announced a definitive agreement with Hyroad Energy to deploy 40 hydrogen fuel cell Class 8 commercial trucks in Southern California. The package links vehicle rollout to hydrogen supply development and refueling access, reinforcing an ecosystem-led deployment model centered on high-utilization freight operations.
- April 2026: Isuzu Motors and Toyota Motor Corporation signed a joint development agreement for a mass-produced light-duty fuel cell electric truck based on Isuzu's ELF EV platform, targeting production start in fiscal year 2027. The program strengthens the supply base for automotive-grade fuel cell integration beyond pilots, with a pathway toward higher-volume components and standardized architectures.
- September 2024: BMW and Toyota reiterated plans to advance next-generation fuel cell powertrains, with BMW targeting series production of its first fuel cell electric vehicle in 2028. The collaboration concentrates stack and system development resources and supports broader supplier investment confidence across key subsystems such as stacks and high-pressure hydrogen storage.


Fuel Cell Vehicle Market Report Scope and Research Methodology
Market Definition and Coverage
For this study, we define the market as revenue generated from factory-built, on-road fuel cell electric vehicles that use a hydrogen fuel cell stack to produce electricity for vehicle propulsion, covering passenger and commercial vehicles sold to end users.
Scope exclusions: We exclude stationary fuel-cell systems, off-road industrial equipment, and aftermarket retrofit kits from this market sizing.
Segments Covered in This Report
- By Vehicle Type
- Passenger Cars
- Commercial Vehicles
- By Fuel-cell Type
- Proton-Exchange-Membrane (PEM)
- Solid-Oxide (SOFC) Range-Extenders
- By Power Rating
- Less than 100 kW
- 100 to 200 kW
- More than 200 kW
- By Component
- Fuel-cell Stack
- Balance-of-Plant
- Hydrogen Storage
- Power-Electronics & E-Drive
- Geography
- North America
- United States
- Canada
- Rest of North America
- South America
- Brazil
- Argentina
- Rest of South America
- Europe
- Germany
- United Kingdom
- France
- Spain
- Russia
- Rest of Europe
- Asia-Pacific
- China
- Japan
- South Korea
- India
- Rest of Asia-Pacific
- Middle East and Africa
- United Arab Emirates
- Saudi Arabia
- Turkey
- Egypt
- South Africa
- Rest of Middle East and Africa
- North America
Data Sources, Market Sizing, and Validation
Desk Research
Desk research starts by mapping the real-world demand pool for on-road fuel cell vehicles before any modeling is done. We rely on public and official sources such as the International Energy Agency for hydrogen and transport indicators, the US Department of Energy and NREL publications for technology and cost benchmarks, UNECE regulations for vehicle type approval references, and national transport and energy ministries for policy timelines and incentive programs.
We also track hydrogen station rollout signals using government and municipal infrastructure portals, and we use customs and trade statistics where available to spot movements in fuel cell stacks and related components. Company annual reports, SEC filings, investor presentations, and reputable press coverage are reviewed to understand launch schedules, production plans, and pricing direction. Paid subscriptions are used selectively to speed up company financials and intelligence screening, and to run patent landscaping checks for technology activity. The sources listed here are illustrative, and many other public references were used to collect inputs, validate assumptions, and clarify unclear data points.
Primary Interviews and Surveys
Primary work is used to pressure test desk inputs and close gaps that usually show up around rollout timing, fleet demand, and transaction pricing. We speak with stakeholders such as vehicle OEM teams, component suppliers, hydrogen ecosystem participants, fleet operators, and distributors, and we cover APAC, EMEA, and the Americas so regional policy and infrastructure differences are reflected.
Distribution of primary research fieldwork respondents
| Company type | Respondent position | Region |
|---|---|---|
| Top tier: 32% | CXOs: 12% | APAC: 43% |
| Mid tier: 52% | Functional/Unit leaders: 38% | EMEA: 34% |
| Smaller Players: 16% | Managers: 50% | Americas: 23% |
Market-Sizing & Forecasting
The core model is built using a top-down approach where registrations, fleet deployments, and policy driven rollout targets are translated into annual sales by vehicle category, and then converted into market value using realistic price ranges. To keep totals grounded, we corroborate results with selective bottom-up approximations, such as sampled ASP times volume checks in priority countries, channel discussions on fleet order sizing, and limited supplier revenue references where disclosures are available.
Key inputs used in the sizing include annual fuel cell vehicle sales and parc trends (where available), hydrogen refueling station count and expected commissioning pace, zero-emission mandates and subsidy timelines, typical stack power ratings by vehicle category, and observed vehicle price movements as programs scale. When a country-level series is missing, we use proxies from similar policy and infrastructure conditions and then adjust through primary feedback on station availability, procurement cycles, and delivery lead times.
For forecasting, scenario analysis is used so the outlook can reflect different infrastructure build-out speeds and policy continuity, and the scenarios are anchored to expert consensus from interviews. The resulting trajectory is then checked with simple time-series smoothing so year-to-year moves remain consistent with known ramp patterns for vehicle programs and station coverage.
Data Validation & Update Cycle
We validate the model by triangulating across independent signals, and then running variance checks at the region and country level so outliers are surfaced early. If market value moves in a way that conflicts with unit deployments, station additions, or policy timing, assumptions are revisited and the related expert inputs are reconfirmed.
Before sign-off, the work is reviewed in multiple steps, including a secondary analyst review of calculation logic and a final consistency pass across all tables. Reports are refreshed annually, with interim updates triggered by material events such as policy changes, large fleet orders, or production shifts. Right before delivery, we complete a fresh update pass so clients receive the most current view available at that time.
Mordor Intelligence's Fuel Cell Vehicle Market Size Compared Against Other Published Estimates
Published market sizes for fuel cell vehicles often differ because the reported number depends on what is counted as a vehicle sale, which regions are included, and whether the estimate is anchored to unit deployments, price, or a blended pool. When program ramps are assumed earlier or later, the current-year value can shift a lot even if the long-term direction looks similar.
Hydrogen refueling stations and related fuel supply services sit outside Mordor Intelligence's scope, which keeps the number tied to factory-built, on-road vehicle revenue rather than infrastructure build-out spending. Differences also come from how passenger cars versus commercial vehicles are treated, whether pricing uses list prices or negotiated fleet pricing, and how currency timing is handled when values are converted across regions.
Benchmark comparison
| Source | Market Size | Gaps in Research Methodology |
|---|---|---|
| Mordor Intelligence | USD 1.64 B (2026) | |
| Trade Journal B | USD 1.52 B (2024) | Often uses an earlier base year and relies on announced program plans more than delivered vehicles, and it does not always normalize ASP assumptions to a consistent currency year across regions. |
| Regional Consultancy A | USD 0.20 B (2024) | Typically counts hydrogen passenger cars only and excludes commercial deployments, and it commonly applies list prices rather than a pricing range that reflects fleet procurement and incentives. |
Overall, most variance comes from scope spillover into infrastructure, differences in commercial vehicle inclusion, and how pricing is handled when volumes are still small. Our approach keeps the steps easy to trace back to unit deployment signals and realistic price ranges, and then it is cross-checked against policy timing and station rollout progress.


Key Questions Answered in the Report
What is the current size of the fuel cell vehicle market and its growth projections?
The fuel cell vehicle market is valued at USD 1.64 billion in 2026 and is projected to reach USD 6.16 billion by 2031, exhibiting a compound annual growth rate of 30.27% during the forecast period 2026-2031.
Which vehicle segment is driving the fastest growth in the fuel cell vehicle market?
Commercial vehicles represent the fastest-growing segment with a 47.10% CAGR through 2031, despite holding only 28.46% of current market share.
Which power rating segment is experiencing the strongest growth?
Power ratings above 200 kW demonstrate the fastest growth at 49.40% CAGR through 2031
Which region leads the fuel cell vehicle market?
Asia-Pacific dominates with 52.60% market share in 2025.
Page last updated on:


 Your data is secure and never sold or shared.


