
Fuel Cell Electric Bus Market Size and Share
Market Overview
| Study Period | 2020 - 2031 |
|---|---|
| Market Size (2026) | USD 1.36 Billion |
| Market Size (2031) | USD 3.52 Billion |
| Growth Rate (2026 - 2031) | 21.03 % |
| Fastest Growing Market | Middle East and Africa |
| Largest Market | Asia Pacific |
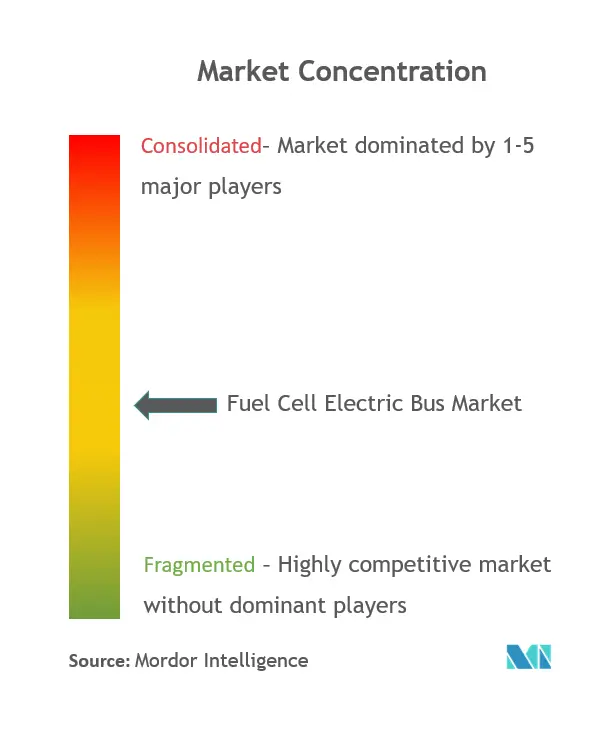
| Market Concentration | Medium |
Major Players *Disclaimer: Major Players sorted in no particular order Image © Mordor Intelligence. Reuse requires attribution under CC BY 4.0. | |
Fuel Cell Electric Bus Market Analysis by Mordor Intelligence
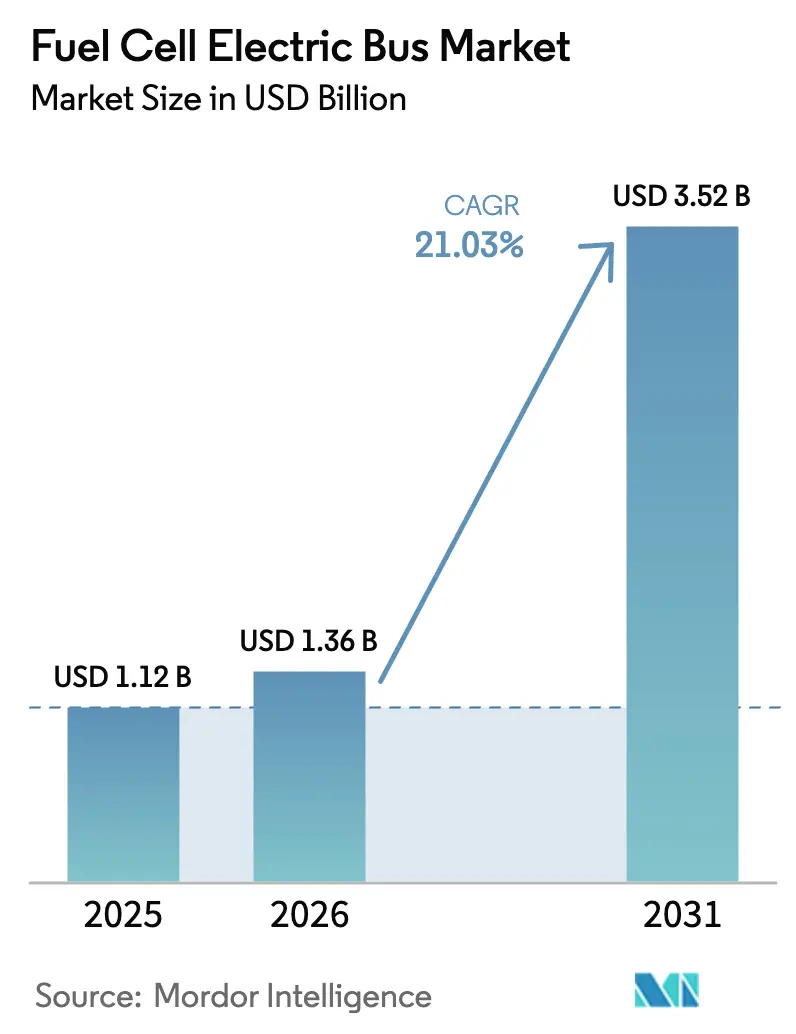
The fuel cell electric bus market size was valued at USD 1.12 billion in 2025 and estimated to grow from USD 1.36 billion in 2026 to reach USD 3.52 billion by 2031, at a CAGR of 21.03% during the forecast period (2026-2031). Policy mandates, falling green-hydrogen costs, and purpose-built bus platforms are converging to create dependable multi-year order books for OEMs. Transit agencies value the long-range, rapid refueling, and cold-weather resilience of hydrogen buses, especially on duty cycles where battery-electric alternatives would require mid-shift charging.
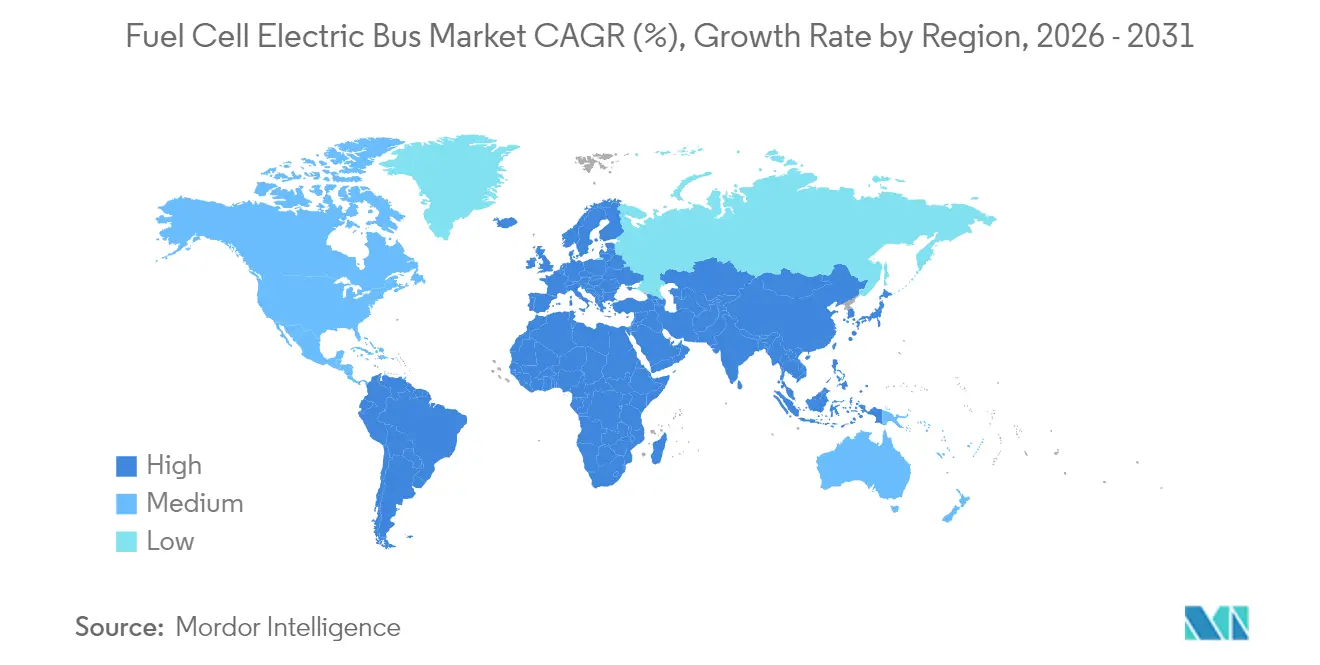
Asia-Pacific leads current volumes on the back of China’s build-out of 1,200 hydrogen stations by 2025, while federal grant programs are accelerating early deployments in North America. At the same time, the Middle East is emerging as the fastest-growing region, supported by national diversification agendas that frame hydrogen mobility as a strategic industry. Competitive intensity is rising as fuel-cell specialists, vertically integrated vehicle makers, and retrofit kit suppliers vie for municipal tenders, each betting on scale to compress unit costs.
Key Report Takeaways
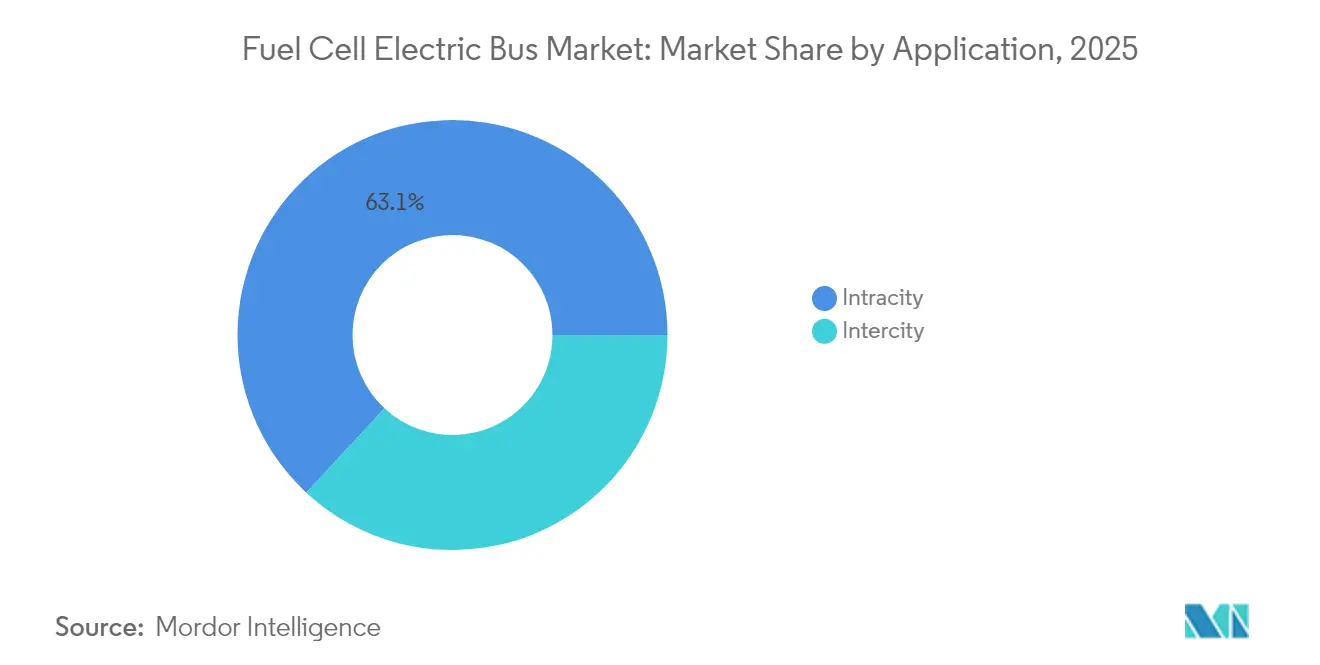
- By application, intracity buses held the largest share at 63.10% in 2025, whereas intercity buses are the fastest-growing segment with a CAGR of 24.74% from 2026 to 2031.
- By bus type, new hydrogen buses dominated with a 71.10% share in 2025, while retrofitted hydrogen buses are expected to grow the fastest at a CAGR of 31.97% during 2026-2031.
- By fuel-cell type, PEMFC led the market with an 83.95% share in 2025, whereas SOFC is the fastest-growing type with a CAGR of 28.95% from 2026 to 2031.
- By power rating, the 150–250 kW category accounted for the largest share at 47.10% in 2025, while the above 250 kW segment is growing fastest at a 28.92% CAGR.
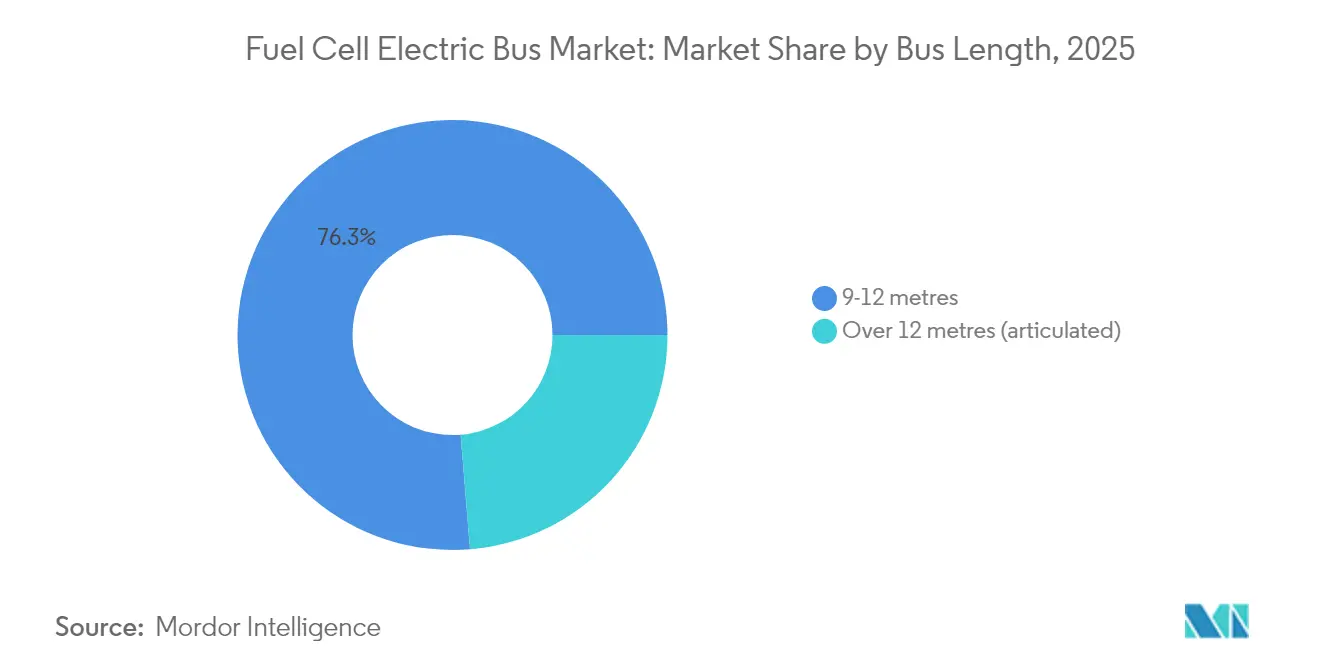
- By bus length, buses sized 9–12 metres had the largest share at 76.30% in 2025, whereas over 12 metres is the fastest-growing length segment with a CAGR of 27.93%.
- By driving range, the 300–500 km range dominated with a 56.15% share in 2025, while buses with above 500 km range are growing fastest at a CAGR of 30.86%.
- By geography, Asia-Pacific led the market with a 43.26% share in 2025, whereas the Middle East and Africa is the fastest-growing region with a CAGR of 30.64% from 2026 to 2031.
Note: Market size and forecast figures in this report are generated using Mordor Intelligence’s proprietary estimation framework, updated with the latest available data and insights as of 2026.
Market Trends and Insights
Drivers Impact Analysis of Fuel Cell Electric Bus Market*
| Driver | (~) % Impact on CAGR Forecast | Geographic Relevance | Impact Timeline |
|---|---|---|---|
| Zero-Emission Mandates for Transit Fleets | +4.2% | Global, with strongest impact in North America & EU | Medium term (2-4 years) |
| Green Hydrogen Price Drop Post-2025 | +3.8% | Global, with early gains in Asia-Pacific & Europe | Long term (≥ 4 years) |
| Government Bulk Procurement Support | +3.5% | Asia-Pacific core, expanding to North America & EU | Short term (≤ 2 years) |
| Liquid Hydrogen Corridor Expansion | +2.9% | North America & EU core, spill-over to APAC | Medium term (2-4 years) |
| OEM Platform Standardisation Reduces TCO | +2.1% | Global | Short term (≤ 2 years) |
| FCEBs Chosen for Autonomous Shuttle Pilots | +1.2% | North America & EU, pilot programs in APAC | Long term (≥ 4 years) |
| Source: Mordor Intelligence | |||
Growing Zero-Emission Mandates for Public Transit Fleets
Many transit agencies now face statutory deadlines to eliminate diesel, prompting multi-year framework agreements for hydrogen buses. California requires full zero-emission fleets by 2040, triggering near-term orders under its Innovative Clean Transit rule. European Union’s Clean Vehicles Directive pushed zero-emission buses to 49% of new deliveries in 2024, with fuel-cell models already taking 3% of the total. Emerging markets follow a similar path—Abu Dhabi targets a 20% green fleet share by 2030, providing clear procurement visibility for OEMs. Binding mandates, therefore, underpin the long-term demand curve of the fuel cell electric bus market.
Sharp Decline in Green Hydrogen Prices Post-2025
Electrolyzer scale-up and cheaper renewables are expected to cut average production costs to EUR 2.7 per kg by 2050, with Asia projected to hit EUR 1.8 per kg, altering the operating-cost parity versus diesel. China’s hydrogen sector nearly doubled revenue to CNY 3.93 billion in 2023, demonstrating the deflationary trajectory of equipment and supply chains. Newly funded hubs such as the Pacific Northwest Hydrogen Hub in the United States add regional cost advantages that lower fuel bills for transit fleets.
Government-Backed Bulk Procurement Programmes
Large, centrally funded orders compress up-front prices by offering manufacturers predictable volumes. Hyundai’s deal to supply 1,000 hydrogen buses to Seoul by 2027 typifies how city-level commitments de-risk capacity investments for OEMs. China couples similar purchase guarantees with toll waivers and accelerated station rollouts, accelerating the fuel cell electric bus market adoption curve.
Rapid Expansion of Liquid-Hydrogen Refuelling Corridors
Investors are moving beyond single stations toward high-throughput corridors that support intercity operations. Canada’s Infrastructure Bank committed USD 337 million to Western corridors, while Germany’s North Rhine-Westphalia region plans hubs to serve 3,800 buses by 2030. The US intends nationwide coverage from 2027, enabling long-haul routes to switch away from diesel.
Restraints Impact Analysis of Fuel Cell Electric Bus Market*
| Restraint | (~) % Impact on CAGR Forecast | Geographic Relevance | Impact Timeline |
|---|---|---|---|
| Competition From Fast-Charging BE Buses | -4.1% | Urban markets globally, strongest in Europe & North America | Short term (≤ 2 years) |
| Grey Hydrogen Remains Cheaper | -3.2% | Global, particularly in regions without renewable energy subsidies | Short term (≤ 2 years) |
| Shortage of Trained Maintenance Staff | -2.8% | Global, most acute in emerging markets | Medium term (2-4 years) |
| High Cost of Cryogenic Storage Systems | -2.3% | Global | Medium term (2-4 years) |
| Source: Mordor Intelligence | |||
Competition From Fast-Charging Battery-Electric Buses
Battery-electric buses outsold diesel in EU city segments for the first time in 2024, buoyed by falling battery costs and abundant depot chargers. The International Energy Agency counted over 70,000 new e-buses worldwide in 2024, a 30% jump from the year[1]. On routes below 200 km daily, TCO modelling still favors batteries, forcing hydrogen proponents to emphasise longer-range and high-utilisation niches.
Grey-Hydrogen Supply Still Cheaper Than Green
Absent carbon pricing, grey hydrogen from natural-gas reforming remains meaningfully cheaper, constraining fleet operators in price-sensitive jurisdictions. Until renewable-powered electrolysis achieves parity, agencies rely on subsidies or contractual green-fuel guarantees to meet sustainability pledges. Cost disparities are widest in markets lacking large-scale offshore wind or solar resources, limiting near-term uptake and tempering the growth rate of the fuel cell electric bus market.
*Our forecasts treat driver/restraint impacts as directional, not additive. The impact forecasts reflect baseline growth, mix effects, and variable interactions.
Fuel Cell Electric Bus Market Segment Analysis
By Application:
Intracity Dominance Drives Current VolumesIntracity services generated 63.10% of 2025 revenue, equal to USD 0.71 billion of fuel cell electric bus market size, because city routes favour centralized refueling and predictable duty cycles. Intercity lines, while nascent, promise the steepest 24.74% CAGR as operators exploit hydrogen’s 300-500 km sweet spot to avoid en-route charging. The fuel cell electric bus market benefits when depot footprints are tight and grid upgrades for megawatt-scale chargers prove costly. Demonstrations such as Chile’s 600 km-range fleet underscore hydrogen’s suitability for long-haul corridors.
Urban agencies also appreciate 10-minute refueling that keeps schedule recovery buffers thin. Intercity networks look to hydrogen to power overnight express links where battery packs would erode passenger capacity. Autonomous shuttle pilots increasingly specify fuel cells to support 20-hour daily duty without downtime, sharpening the performance edge for the fuel cell electric bus market.

By Bus Type:
New Deployments Lead Market TransformationNew bus models represented 71.10% of 2025 deliveries, reflecting OEM focus on optimized chassis that integrate tanks within the roofline and free floor space. Retrofits, although smaller, are sprinting at a 31.97% CAGR as kit providers enable agencies to convert younger diesel stock instead of scrapping it early. Transit authorities with capped capital budgets view conversions as a bridge to 2030 emission targets, especially where policy offers purchase vouchers.
Still, builders like Solaris and Hyundai embed stacks, inverters, and cooling loops directly into new frames, delivering lower curb weight and simpler maintenance. As economies of scale sharpen, the fuel cell electric bus market is expected to pivot toward fresh builds because total lifecycle cost favors factory-integrated systems beyond year five of operation.
By Fuel-Cell Type:
PEMFC Dominance Faces SOFC ChallengePEMFC units held 83.95% revenue share in 2025, supplying most intracity fleets thanks to rapid start and low operating temperature. SOFC products, however, are logging a 28.95% CAGR, appealing to operators that need continuous power and the option to run on reformed gas during hydrogen outages. NA Clean Energy notes the higher efficiency of SOFC stacks, lowering hydrogen consumption per kilometre.
PEMFC costs have dropped as Ballard engines pass 35,000 service hours in field trials. Still, resilience to fuel purity swings and hotter climates positions SOFC as a credible second technology pillar, injecting fresh competition into the fuel cell electric bus market.
By Power Rating:
Mid-Range Systems Dominate Current DeploymentsUnits rated 150-250 kW supplied 47.10% of buses in 2025, a band that balances acceleration with stack cost. Orders for 300 kW plus configurations are accelerating at 28.92% CAGR as agencies adopt articulated 18-metre vehicles such as Solaris Urbino 18 Hydrogen, Bus of the Year 2025. These higher outputs allow longer routes and hill climbs without sacrificing heating loads in winter.
Conversely, sub-150 kW systems power shuttles and paratransit services where lighter frameworks reduce operating expense. As refueling corridors mature, the demand mix will tilt toward high-power setups that extend range beyond 500 km and widen the addressable scope of the fuel cell electric bus market.
By Bus Length:
Standard Configurations Lead Market AdoptionThe 9-12 m bracket dominated with 76.30% of 2025 deployments as agencies standardize on one-route-fits-all vehicles that fit existing depot bays. Articulated formats above 12 m post a 27.93% CAGR outlook, lifted by BRT corridors that prize passenger throughput over maneuverability. Brighton & Hove’s 34 double-deck hydrogen units exhibit a local appetite for specialised configurations when municipal density demands high capacity.
Standard-length models will remain the bedrock of the fuel cell electric bus market because of their flexible duty conversions and easier maintenance access. That said, articulated growth signals a widening application envelope as the cost per seat falls with larger vehicles.
By Driving Range:
Extended-Range Capabilities Drive Premium Segment GrowthBuses offering 300-500 km covered 56.15% of the 2025 turnover, providing enough autonomy for two intracity shifts without refueling. Units exceeding 500 km are forecast to grow 30.86% CAGR, carving out the premium long-distance niche. Agencies adopting country-wide intercity routes prefer these models to avoid building multiple truck-stop-style stations.
Short-range (Less than 300 km) buses suit feeder loops that return to the depot frequently, but large compressed-hydrogen tanks penalise curb weight. As liquid-storage technology advances, the extended-range segment will deepen its lead, solidifying hydrogen’s distinctive value proposition within the fuel cell electric bus market.
Geography Analysis
APAC, North America and EMEA Fuel Cell Electric Bus Market
Asia-Pacific commanded 43.26% of global revenue in 2025, equal to USD 0.48 billion of fuel cell electric bus market size, owing to China’s infrastructure blitz and Korean bulk orders. The region’s 30.12% CAGR to 2031 rests on 1,200 new hydrogen stations, national toll exemptions, and integrated industrial strategies that align energy, vehicle, and component value chains. North America follows, expanding at a 27.26% CAGR on the strength of USD 623 million federal funding and state mandates that force fleet turnovers by 2035. Projects like the Pacific Northwest Hydrogen Hub bring USD 1 billion into the upstream supply, lowering delivered fuel prices for agencies along Interstate corridors. Canada’s Zero Emission Transit Fund also kick-starts municipal pilots, evidenced by Mississauga’s first hydrogen fleet. Europe shows a 23.42% CAGR outlook, powered by the Clean Vehicles Directive and local manufacturing dominance. Germany alone targets 3,800 fuel-cell buses by 2030 with heavy co-investment in stations. The Middle East & Africa represents the fastest-growing territory at 30.64% CAGR, even if it starts from a lower base, spurred by UAE and Saudi sustainability programs that reposition hydrocarbons majors into hydrogen mobility. Pilot deployments in Abu Dhabi and Riyadh validate climatic performance and seed local supply chains, broadening the geographic reach of the fuel cell electric bus market.
Regulatory Landscape
Regulation for fuel cell electric buses is tightening around both fleet decarbonization and hydrogen-system safety. In the United States, the National Highway Traffic Safety Administration (NHTSA) finalized hydrogen vehicle safety requirements through FMVSS No. 307 (hydrogen fuel system integrity) and FMVSS No. 308 (compressed hydrogen storage system integrity), effective in 2025, which clarifies compliance benchmarks for onboard tanks, lines, and crash performance.
On the demand side, California Air Resources Board (CARB) Innovative Clean Transit (ICT) requirements continue to shape procurement, including mandated Zero-Emission Bus Rollout Plans that cover infrastructure and technology deployment schedules. From January 1, 2026, ICT purchase requirements step up to 50% zero-emission bus purchases for large transit agencies (and 25% for small agencies). California Department of General Services (DGS) procurement specifications also reference recognized standards such as SAE J2579 and SAE J2578 and HGV 2-2014, which influences bid requirements and supplier qualification for hydrogen bus programs.
Value Chain Analysis
The fuel cell electric bus value chain spans hydrogen production and delivery, refueling infrastructure, propulsion integration, and fleet operations. Upstream, electrolyzer-based supply and merchant hydrogen producers feed either gaseous or liquid distribution. Midstream players provide station development or interim fueling, including mobile fueling models that help agencies start service before permanent depots are commissioned. Standards and procurement specifications (for example, California DGS references to SAE J2579/J2578 and HGV 2-2014) also act as enabling nodes by narrowing acceptable component and system configurations across tenders.
On the vehicle side, major stack and module suppliers work with bus OEMs through platform-level agreements that stabilize volumes and component roadmaps. Ballard Power Systems supplying FCmove modules and engines into OEM platforms is one example. This includes a commercial agreement with New Flyer covering 500 fuel cell engines (50 MW) for Xcelsior CHARGE FC buses, highlighting the role of long-term supply contracts for stacks, balance-of-plant, and controls. Downstream, transit agencies and contractors support aftersales through training, maintenance tooling, and parts provisioning, while ecosystem partners (such as Hyundai-linked entities providing maintenance training and consulting in Seoul) address technician readiness and depot safety practices that affect uptime and total cost of ownership.
Competitive Landscape
Ballard Power Systems led 2024 shipments, leveraging its engine-only model to supply multiple OEMs under long-term frameworks that anchor revenue visibility. New Flyer followed, blending in-house bus engineering with external stacks, while Hyundai scaled vertically from cells to complete vehicles, underpinned by a forthcoming Ulsan fuel-cell plant. commands Europe via its Urbino family, and Yutong capitalizes on domestic incentives in China.
Strategic alliances dominate. Hexagon Purus struck a long-term tank agreement with GILLIG to harmonize US designs. Karsan teamed with Toyota to integrate Mirai stacks into midibus platforms, shortening validation cycles. Retrofit specialists also carve niches, offering conversion packages that undercut new-bus capex by 35%.
Technology roadmaps focus on higher stack durability, modular tank layouts, and digital twins that predict degradation, lowering lifetime cost. Safety recalls, such as Hyundai’s 2025 action covering 1,269 domestic units, underline maturing quality processes vital for trust in the fuel cell electric bus market. Over the mid-term, platform standardisation and cross-industry supply pacts are expected to narrow cost gaps with diesel and electric peers, sustaining the momentum of the fuel cell electric bus industry.
Fuel Cell Electric Bus Industry Leaders
-
Ballard Power Systems
-
New Flyer Industries
-
Hyundai Motor Company
-
Toyota Motor Corporation
-
Van Hool NV
- *Disclaimer: Major Players sorted in no particular order
Fuel Cell Electric Bus Market Companies Covered in this Report
- Ballard Power Systems Inc.
- New Flyer Industries
- Toyota Motor Corporation
- Hyundai Motor Company
- Tata Motors Ltd.
- Van Hool NV
- IVECO Group
- SAFRA
- Wrightbus (Bamford Bus Company Holdings Limited)
- CaetanoBus
- Foton International
- Yutong Bus Co., Ltd.
- ZhongTong Bus Holding Co., Ltd.
- CRRC Zhuzhou Electric Co., Ltd.
- Nuvera Fuel Cells LLC
- Nikola Corporation
Market Opportunities and Future Outlook
Policy-tied replacement cycles and procurement rules are creating near-term whitespace for suppliers that can package buses with fueling and compliance support. California ICT is a concrete example: the January 1, 2026 step-up to 50% zero-emission bus purchases for large agencies (25% for small agencies) increases the number of tenders where fuel cell platforms can compete alongside battery-electric options. This is especially relevant on high-utilization duty cycles where fast refueling and longer range reduce scheduling constraints. Vendors that align vehicle offerings to California procurement specifications, including DGS-referenced hydrogen safety and system standards, and can manage interim fueling constraints through transitional solutions should have an edge in framework agreements.
A second opportunity is ecosystem-led deployment models that combine vehicles, station conversions, and operating support, which reduces the coordination burden on transit agencies. In South Korea, Hyundai and partners announced plans tied to deploying 400 hydrogen electric buses on Seoul metropolitan-area routes within five years, paired with conversion of CNG hubs into hydrogen refueling. This points to a pathway where infrastructure and fleet rollout are contracted in parallel rather than sequentially. In Europe, projects such as SASA Bolzano’s Hydrogen Adige Valley concept (local solar, a 2 MW electrolyser, and refueling for public transport) show municipal interest in integrating renewable generation with depot fueling, creating room for OEMs, stack suppliers, and station developers to bid as consortia and expand beyond single-city pilots.
Recent Industry Developments in Fuel Cell Electric Bus Market
- May 2026: Solaris Bus & Coach formally selected Ballard as the fuel cell supplier for its next-generation hydrogen bus, incorporating the FCmove-SC engine. The development marks a direct market supplier selection for a major bus platform. Strengthens Ballard’s OEM footprint in Europe and accelerates deployment of FCmove-SC in high-volume chassis.
- May 2026: Wrightbus nominated Ballard as the fuel cell supplier for its StreetDeck Hydroliner Gen 3.0 double-decker hydrogen bus, with series production to begin in 2027. The high-profile tender represents a leading UK bus platform. Expands Ballard’s installed base in double-decker platforms and reinforces multi-year supply arrangements.
- March 2026: Ballard announced a commercial agreement with New Flyer to supply 500 FCmove-HD+ fuel cell engines, totaling 50 MW, for Xcelsior CHARGE FC hydrogen fuel cell buses. The agreement constitutes a significant multi-vehicle, multi-year order with a major North American OEM. Enhances Ballard’s revenue visibility and scales FCmove-HD+ across a large fleet program.
Fuel Cell Electric Bus Market Report Scope and Research Methodology
Market Definition and Coverage
For this study, the market covers the revenue generated from fuel cell electric buses sold for public and private transit use, where hydrogen fuel cells provide the main on-board electricity for traction, and values are reported in USD for the covered geographies.
Scope exclusions: We exclude hydrogen production, refueling station buildout, and standalone fuel cell stacks sold for non-bus end uses.
Segments Covered in This Report
- By Application
- Intercity
- Intracity
- By Bus Type
- New Hydrogen Buses
- Retrofitted Hydrogen Buses
- By Fuel-cell Type
- Proton-Exchange Membrane (PEMFC)
- Phosphoric-Acid (PAFC)
- Solid-Oxide (SOFC)
- Others
- By Power Rating
- Less than 150 kW
- 150 - 250 kW
- Above 250 kW
- By Bus Length
- 9 - 12 metres
- Over 12 metres (articulated)
- By Driving Range
- Less than 300 km
- 300 - 500 km
- Above 500 km
- By Geography
- North America
- United States
- Canada
- Rest of North America
- South America
- Brazil
- Argentina
- Rest of South America
- Europe
- Germany
- United Kingdom
- France
- Italy
- Spain
- Russia
- Rest of Europe
- Asia-Pacific
- China
- Japan
- India
- South Korea
- Australia
- Rest of Asia-Pacific
- Middle East & Africa
- Saudi Arabia
- United Arab Emirates
- Turkey
- South Africa
- Rest of Middle East & Africa
- North America
Data Sources, Market Sizing, and Validation
Desk Research
Desk research was used to set the baseline context on bus fleets, emissions rules, and the pace of zero-emission procurements that can translate into actual orders. We reviewed public sources such as International Energy Agency (IEA) transport and hydrogen coverage, International Council on Clean Transportation (ICCT) city bus transition research, UN Comtrade trade statistics for relevant components, and World Bank macro indicators to normalize comparisons across regions.
We also used annual reports, investor decks, public tender portals, and reputable press to track deployments and program timelines, which later helped stress test the demand build. In a few places, paid subscriptions for company financials and intelligence, patent databases, and shipment-level trade data were used to confirm directional signals on capacity, sourcing, and technology activity. These desk research sources are illustrative, and many other public and paid references were used for data collection, validation, and clarification.
Primary Interviews and Surveys
Primary work focused on validating what gets ordered versus what gets announced, and on understanding the pricing spread by bus size and duty cycle. We spoke with a mix of OEM-side, component-side, transit authority, and operator stakeholders across key regions, and then used those inputs to confirm adoption assumptions, typical tender terms, and realistic delivery timing.
Distribution of primary research fieldwork respondents
| Company type | Respondent position | Region |
|---|---|---|
| Top tier: 30% | CXOs: 22% | APAC: 43% |
| Mid tier: 48% | Functional/Unit leaders: 21% | EMEA: 37% |
| Smaller Players: 22% | Managers: 57% | Americas: 20% |
Market-Sizing & Forecasting
Sizing starts from a market-specific top-down build, where we reconstruct the addressable demand pool using transit fleet replacement cycles, zero-emission bus targets, and tender-linked procurement visibility, and then translate that into expected fuel cell electric bus deliveries. After the demand spine is built, we corroborate totals using selective bottom-up checks, including sampled price-per-bus ranges by size class, known deployment batches, and supplier-side channel checks on whether volumes are feasible.
Key inputs used in the model include bus delivery lead times, hydrogen corridor readiness for depots, average selling price progression by bus length and power rating, the share of routes that require fast refueling and longer range, and policy compliance dates that pull forward orders. Forecasting is run using scenario analysis supported by expert views, since program funding timing and infrastructure readiness can shift year-to-year. Where public information is thin, gaps are handled through conservative adoption curves that are revisited after primary checks confirm whether planned orders are reaching contract and delivery stages.
Data Validation & Update Cycle
Model outputs are cross-checked against independent signals such as announced procurement awards, delivery registrations where available, and supplier capacity commentary, and then unusual jumps are flagged for review. If a region shows a sharp change that is not supported by policy timing or infrastructure rollout, we re-check assumptions and, when needed, re-contact sources to confirm whether timelines slipped.
A multi-step internal review is completed before sign-off so calculation logic, currency conversion timing, and key assumptions are consistent across geographies. Reports are refreshed annually, with interim updates triggered by material events like major subsidy changes, large fleet awards, or supply disruptions. Before delivery, an analyst completes a fresh pass so clients receive the latest updated view.
Mordor Intelligence's Fuel Cell Electric Bus Market Size Measured Against Other Published Estimates
Published market values for fuel cell electric buses often differ because each study draws the boundary around different revenue items, uses different timing for deliveries, and applies its own pricing logic. Some estimates also mix planned deployments with confirmed orders, which can widen the spread in early-stage markets.
Vehicle delivery reality checks and tender-award tracking are the main anchors that keep Mordor Intelligence tied to buses that are actually contracted and delivered within the stated years. It also helps keep pricing aligned to typical transaction ranges rather than brochure values. Differences also come from whether a publisher includes hydrogen infrastructure revenue, counts hybrid configurations the same way, or uses a constant-price approach instead of year-specific currency timing.
Benchmark comparison
| Source | Market Size | Gaps in Research Methodology |
|---|---|---|
| Mordor Intelligence | USD 1.36 B (2026) | |
| Trade Publisher A | USD 2.21 B (2025) | Uses a higher base by counting a wider set of hydrogen bus revenues, and it appears to lean on broad trend extrapolation without separating announcements from deliveries. |
| Regional Consultancy B | USD 0.57 B (2024) | Tends to treat the market as only hydrogen fuel cell buses and may apply narrower geography coverage and conservative procurement assumptions that undercount early ramp programs. |
The table shows that the biggest differences come from what is counted as market revenue and how strictly delivery timing is treated. By keeping the estimate traceable to procurement signals, deployment timing, and practical price ranges, the resulting market size stays explainable and repeatable for planning decisions.
Key Questions Answered in the Report
What is the current size of the fuel cell electric bus market?
It was valued at USD 1.36 billion in 2026 and is forecast to reach USD 3.52 billion by 2031, reflecting a 21.03% CAGR.
Which region leads fuel cell electric bus adoption?
Asia-Pacific holds 43.26% of global revenue, driven by China’s station build-out and Korea’s bulk orders.
How do hydrogen buses compare with battery-electric buses on cost?
Battery models remain cheaper on sub-200 km urban loops, but hydrogen becomes competitive on ranges above 300 km, particularly as green-hydrogen prices fall.
What is the main growth driver for hydrogen buses?
Mandatory zero-emission fleet regulations in North America, Europe, and parts of Asia create assured demand pipelines that de-risk OEM investments.
How quickly can a fuel cell electric bus refuel?
Typical depot systems deliver a full 350-bar fill in 10-20 minutes, enabling continuous multi-shift operation without long dwell times.