
South Africa Fruits And Vegetables Market Analysis by Mordor Intelligence
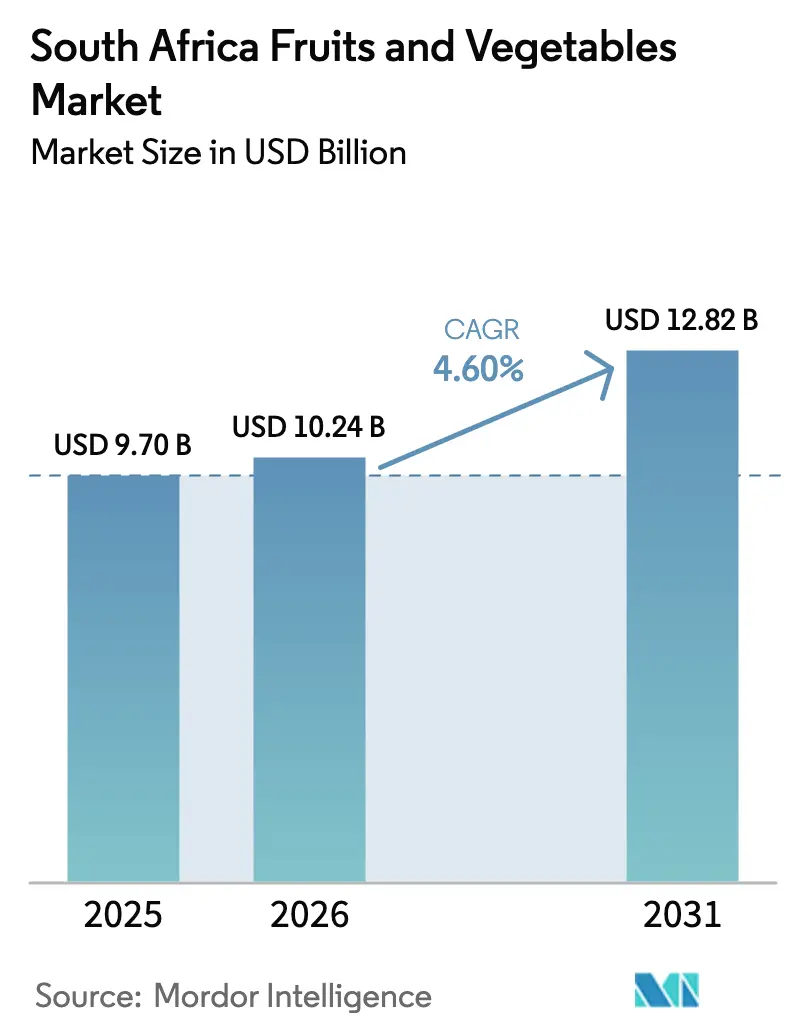
The South Africa fruits and vegetables market size was valued at USD 9.70 billion in 2025 and estimated to grow from USD 10.24 billion in 2026 to reach USD 12.82 billion by 2031, at a CAGR of 4.60% during the forecast period (2026-2031). Vegetables constitute a significant portion of the market, with potatoes, onions, and tomatoes being primary staples in domestic and regional trade. These vegetables play a crucial role in meeting the population's dietary needs and are integral to the agricultural economy. Conversely, the fruit segment is projected to experience growth, supported by the export of premium citrus, avocados, and table grapes to Europe and Asia. This growth is attributed to increasing global demand for high-quality fruits and the expansion of export-oriented farming practices. Profit margins are being bolstered by government-backed agro-processing grants, new bilateral phytosanitary agreements, and the growing use of precision irrigation techniques, which improve water efficiency and crop yields. Challenges such as recurring droughts, water-use license restrictions, and non-tariff sanitary barriers remain obstacles to the agricultural sector's growth potential, requiring strategic interventions to mitigate their impact.
Key Report Takeaways
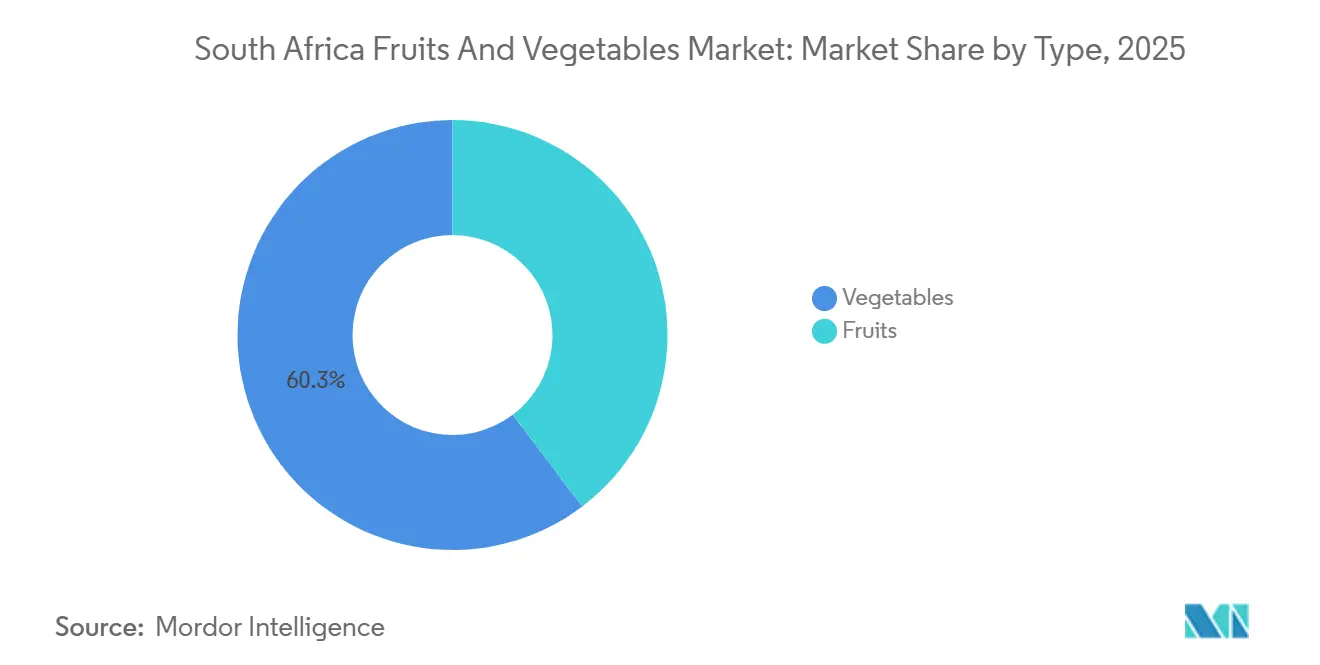
- By type, vegetables led with 60.3% of the South Africa fruits and vegetables market share in 2025. Fruits are forecast to expand at a 3.6% CAGR between 2026 and 2031, the fastest among product categories.
Note: Market size and forecast figures in this report are generated using Mordor Intelligence’s proprietary estimation framework, updated with the latest available data and insights as of January 2026.
Market Trends and Insights
Drivers Impact Analysis of South Africa Fruits And Vegetables Market*
| Driver | (~) % Impact on CAGR Forecast | Geographic Relevance | Impact Timeline |
|---|---|---|---|
| Growing demand for nutrient-dense produce | +0.8% | Europe, United Kingdom, and Middle East | Medium term (2-4 years) |
| Government agro-processing incentives | +0.6% | National focus on Western Cape, Limpopo, and Mpumalanga | Short term (≤ 2 years) |
| Precision agri-tech and smart irrigation uptake | +0.7% | Early adoption in Western Cape and Limpopo | Medium term (2-4 years) |
| Controlled-atmosphere export logistics boost | +0.9% | Port hubs in Cape Town, Durban, and Gqeberha | Short term (≤ 2 years) |
| Cultivar-specific global marketing campaigns | +0.5% | Europe, Asia-Pacific, and Middle East | Long term (≥ 4 years) |
| Expansion of bilateral phytosanitary agreements | +1.0% | Vietnam, Philippines, India, and intra-Africa | Medium term (2-4 years) |
| Source: Mordor Intelligence | |||
Growing Demand for Nutrient-Dense Produce
Soft-citrus exports, including mandarins and clementines, increased by 22% year-on-year, reaching 58.2 million cartons in 2024, as health-conscious European retailers favored easy-peel varieties[1]. According to the ITC Trade Map, avocado exports totaled 82,784 metric tons in 2024, with the European Union accounting for nearly two-thirds of the volume. Domestic urban households followed a similar trend, increasing their purchases of vegetables and berries, which contributed to vegetable consumer inflation rising to 9.3% in August 2025. The high price elasticity enabled growers to offset rising fertilizer and diesel costs, particularly for premium products like blueberries and table grapes, which command price premiums exceeding 30% over conventional varieties. Retailers have aligned their procurement strategies with nutrient claims, establishing longer-term contracts that reduce market risks for large exporters and encourage smallholders to obtain GLOBALG.A.P. certification.
Government Agro-Processing Incentives
The Department of Agriculture, Land Reform, and Rural Development allocated ZAR 2.8 billion (USD 155 million) in 2024 to support cold-storage subsidies, pack-house upgrades, and export certification initiatives[2]. During 2024-2025, twelve new controlled-atmosphere facilities were established in the Western Cape and Limpopo, adding 8 million cubic feet of storage capacity, which extends the shelf life of apples and pears by six months. By mid-2025, the TITAN 2.0 digital traceability platform had achieved 95% adoption among exporters, resulting in an 18-hour reduction in port dwell times. Additionally, in 2023, smallholder-focused loans amounting to ZAR 450 million (USD 25 million) supported 1,769 beneficiaries cultivating 15,610 hectares under majority Black ownership, enabling compliance with stringent European retail standards. The introduction of faster fertilizer-import licensing in January 2025 addressed historical input bottlenecks and helped stabilize planting schedules.
Precision Agri-Tech and Smart Irrigation Uptake
The Council for Scientific and Industrial Research implemented drone-based imaging and soil sensors across 8,500 hectares in Limpopo and Mpumalanga, achieving a 24% reduction in irrigation water usage without compromising crop yields. In February 2025, Telkom’s Smart AgriTech pilot introduced fifth-generation mobile connectivity and Internet of Things (IoT) sensors to vineyards in the Western Cape, with plans to extend the technology to citrus farms by 2027. Aerobotics’ pest-prediction algorithms now safeguard 1.2 million hectares of local orchards, reducing chemical expenses by approximately 20%. Computer-vision graders analyze 26 images per fruit, significantly reducing manual labor requirements in citrus pack-houses by nearly two-thirds. However, cost challenges persist, with installation expenses ranging from ZAR 80,000 to ZAR 120,000 (USD 4,400–6,700) per hectare, while fourth-generation network limitations in rural Limpopo impede the use of real-time analytics.
Cultivar-Specific Global Marketing Campaigns
Industry bodies allocated ZAR 120 million (USD 6.7 million) in 2024 to promote Nadorcott mandarins, Forelle pears, and Hass avocados in Europe and the Middle East. Capespan introduced a blockchain label providing orchard-level carbon data, which premium retailers increasingly value. Premium product lines, such as Orri mandarins, achieved price increases exceeding 25% in European supermarkets during 2024. The South African Table Grape Industry (SATI) launched a R40 million (USD 2.2 million) campaign on Chinese e-commerce platforms in 2025, targeting mid-tier urban consumers. With over 200 export labels competing for shelf space, brand equity continues to lag behind competitors like Chile and Peru. Discussions regarding the adoption of a unified "Brand South Africa" logo remain ongoing.
Restraints Impact Analysis of South Africa Fruits And Vegetables Market*
| Restraint | (~) % Impact on CAGR Forecast | Geographic Relevance | Impact Timeline |
|---|---|---|---|
| Non-tariff phytosanitary barriers | -0.8% | European Union and United States trade corridors | Long term (≥ 4 years) |
| Climate-induced droughts and heatwaves | -0.7% | Western Cape, Northern Cape, and Limpopo | Short term (≤ 2 years) |
| Water-use license constraints | -0.5% | Western Cape and Limpopo | Medium term (2-4 years) |
| Volatile currency exposure on imported inputs | -0.6% | Nationwide | Short term (≤ 2 years) |
| Source: Mordor Intelligence | |||
Non-Tariff Phytosanitary Barriers
The European Union's cold-treatment protocols for citrus black spot increase costs by USD 0.08-0.12 per carton and delay shipments by up to one week, thereby raising working capital requirements. Temporary United States tariffs in 2025 resulted in penalties and contract renegotiations costing exporters ZAR 800 million (USD 44 million) before exemptions for citrus, avocado, and beef were reinstated. In China, avocado regulations exclude 40% of smallholders due to insufficient documentation capacity, leading to supply consolidation among vertically integrated players. Ongoing World Trade Organization arbitration with the European Union regarding citrus black spot creates significant uncertainty and compels exporters to maintain destination-specific pack-lines, increasing fixed overhead costs by up to 20%.
Climate-Induced Droughts and Heatwaves
In December 2024, Western Cape dam levels declined to 62% of their capacity, resulting in a 25% reduction in irrigation and a 9% decrease in apple production, which dropped to 35.8 million cartons[3]. The reduced water availability significantly impacted agricultural operations, forcing farmers to adopt water-saving measures and prioritize high-value crops. Heat events exceeding 40 degrees Celsius in Limpopo and Mpumalanga accelerated citrus maturation, shortening harvest windows by two weeks and increasing labor costs by 15%. This compression of harvest periods created logistical challenges, including the need for additional labor and faster processing to prevent spoilage. The South African Weather Service forecasts a 30%-40% increase in extreme heat events by 2030, driving the need for shade-netting investments estimated at ZAR 150,000-250,000 (USD 8,300-13,900) per hectare.
*Our forecasts treat driver/restraint impacts as directional, not additive. The impact forecasts reflect baseline growth, mix effects, and variable interactions.
South Africa Fruits And Vegetables Market Segment Analysis
By Type:
Vegetables Anchor Domestic DemandVegetables accounted for 60.3% of South Africa's fruits and vegetables market share in 2025, driven by substantial domestic consumption and robust cross-border trade within the Southern African Development Community. According to the North West Department of Agriculture and Rural Development, in 2025, potatoes led certified exports, with 24.45 million kilograms, followed by onions and butternut squash, with Botswana and Namibia being the key importers. Despite drought-related supply challenges and elevated diesel-driven logistics costs, retail inflation of 9.3% in 2025 highlights resilient demand. Hydroponic tomato facilities near Johannesburg and Cape Town ensure a year-round supply to supermarkets, reducing the seasonal dependency on imports.
Fruits are the fastest-growing segment, projected to grow at a 3.6% CAGR through 2031, surpassing staple vegetables and contributing an increasing share to South Africa's fruit and vegetable export earnings. Citrus exports reached 171.5 million cartons in 2024-2025, with mandarins and clementines showing the highest growth. Investments in cold-chain infrastructure and cultivar promotions in Asia aim to regain market momentum. Apples and pears face intensified competition from Latin American suppliers, but the adoption of genetically modified long-storage cultivars could help reclaim premium market positions.

Geography Analysis
The Western Cape accounted for 92% of the national pome-fruit production and 94% of table-grape and stone-fruit volumes in 2024. This was supported by its Mediterranean climate, extensive cold-chain infrastructure, and proximity to the ports of Cape Town and Gqeberha (formerly known as Port Elizabeth). Water-allocation reductions in the Berg and Olifants catchments necessitated the adoption of precision drip irrigation systems, costing between ZAR 80,000 and 120,000 (USD 4,400–6,700) per hectare. These costs were partially offset by increased pack-house automation, which reduced labor costs and improved product quality, enabling premium pricing.
Limpopo and Mpumalanga contributed 52% of the national citrus production in 2025, with 101,624 hectares of citrus orchards supplying the Durban port corridors for exports to Europe and the Middle East. The region's subtropical climate allows for staggered harvesting over eight months, optimizing packhouse utilization. Delays in license renewals and rising water tariffs have created investment uncertainties. As a result, some growers are diversifying into macadamia and mango orchards to mitigate risks if regulatory clarity does not improve.
The Eastern Cape and KwaZulu-Natal regions offer significant growth potential. In 2024, government grants totaling ZAR 450 million (USD 25 million) financed the construction of four new cold storage facilities and the refurbishment of eight packhouses, aiming to reduce spoilage by 20% by 2027. The African Continental Free Trade Area facilitated exports worth ZAR 1.386 billion (USD 77 million) from South Africa's fruit and vegetable market to Ghana and Kenya between January and July 2025. This suggests that coastal provinces could serve African markets more competitively compared to Western Cape exporters, who face higher costs due to longer road transport distances.
Regulatory Landscape
South Africa's fresh fruits and vegetables market is regulated mainly by the Department of Agriculture, Land Reform and Rural Development (DALRRD) under the Agricultural Product Standards Act (Act 119 of 1990), which governs grading, packing, labeling, and export conformity for agricultural products. This is supported by food safety and quality assurance requirements and codes of hygiene for fresh produce. In practice, compliance is anchored in Good Agricultural Practices and packhouse controls that reflect export market access requirements, particularly for premium fruit exports.
Recent reforms are also expanding the role of audited management systems and cost-recovery instruments. The Agricultural Product Standards Amendment Act, 2023 introduced explicit provision for auditing management control systems and enabled assignees to set levies on a cost-recovery basis, and in August 2025 DALRRD commenced key sections of this amendment through a government proclamation. A statutory levy on fresh citrus fruit intended for export runs through December 31, 2028, with the levy set at R1.67 per 15 kg carton for 2026, creating a citrus-specific regulatory-linked cost line and underscoring the need for compliant documentation alongside industry-administered measures.
Value Chain Analysis
The value chain runs from input supply (seed, fertilizer, crop protection, irrigation systems) to on-farm production (open-field vegetables and orchard fruit). It then moves into post-harvest handling (grading, packing, cold storage, and controlled-atmosphere facilities) and distribution through domestic wholesale and retail, as well as export logistics via the port corridors of Cape Town, Durban, and Gqeberha. Export-oriented players typically integrate packhouses, cold chain, and certification workflows, while smaller growers often rely on aggregators, packhouse service providers, and cooperative models to access GLOBALG.A.P.-aligned supply chains and formal retail procurement.
Logistics performance is a binding constraint and a key export cost driver for fruit. Industry evidence cited R5.2 billion in direct and indirect logistical costs to the citrus industry during the 2024 season, linked to port throughput and rail infrastructure challenges, with knock-on effects for reefer availability, dwell times, and working capital. Value chain responses include greater reliance on road freight where rail reliability is weak, corridor diversification discussions (including alternatives such as the N4 route toward Maputo), and upstream steps to derisk imported inputs, such as SUISO signing a Basic Engineering Design contract in August 2025 for a R31.5 billion coal-to-fertiliser complex in Kriel, Mpumalanga intended to reduce fertilizer imports. Downstream, buyer-led programs also influence cropping choices and compliance readiness, including Unilever South Africa's April 2025 launch of the Jozini Smallholder Farmer Programme in KwaZulu-Natal, which combines training with an uptake agreement that links production support to assured offtake.
Competitive Landscape
Companies such as Westfalia Fruit, Capespan Group, and Dutoit Group collectively managed over 45% of certified export cartons in 2025. These firms leverage multi-country orchard portfolios, advanced pack-house robotics, and exclusive European retail contracts to maintain their market positions. The integration of advanced technologies and strategic partnerships has been pivotal in shaping the market's competitive landscape.
Technology scale serves as a significant competitive advantage in the market. Westfalia Fruit secured a USD 300 million revolving credit facility in 2023 to fund orchard upgrades across five continents. Additionally, the acquisition of Belgian processor Syros in January 2025 has enabled the company to expand into higher-margin guacamole and frozen product formats. Capespan Group, on the other hand, has implemented blockchain-enabled labeling to meet retailer provenance requirements. This initiative aims to recover market share after an 8-10% volume decline during a period of restructuring.
Emerging competitors include cooperative smallholders supported by ZAR 450 million (USD 25 million) in blended capital. This funding facilitates GLOBALG.A.P. certification and provides direct access to supermarket supply chains. Aerobotics' pest-analytical tools, which now cover 1.2 million hectares nationally, offer cost advantages to users. The potential consolidation around a unified "Brand South Africa" export mark could enhance collective bargaining power in international markets, provided industry consensus is achieved.
Market Opportunities and Future Outlook
Export market access expansion and tighter chain-of-custody requirements are creating room for investment aimed at reducing port dwell time and strengthening traceability, cold chain, and packhouse quality assurance. There are operational proof points already in motion, including 95% adoption of the TITAN 2.0 digital traceability platform among exporters by mid-2025 and the build-out of controlled-atmosphere infrastructure during 2024-2025 (twelve new facilities in the Western Cape and Limpopo adding 8 million cubic feet of storage). Newly secured protocols such as South Africa's stone-fruit access to China, signed in 2025 with the General Administration of Customs of China, also widen the export mix and raise the need for destination-specific compliance, packaging formats, and temperature-managed logistics.
On the farm productivity side, opportunity is concentrated around water efficiency, heat stress mitigation, and decision-support tools that can be scaled across growers and packhouses. Precision agriculture use has already shown measurable outcomes, including CSIR deployments across 8,500 hectares in Limpopo and Mpumalanga delivering a 24% reduction in irrigation water use, and Aerobotics coverage across 1.2 million hectares of orchards supporting lower chemical spend. In 2026, government programs provided additional context for smallholder commercialization and extension modernization, including the Department of Agriculture's 2026/27 budget envelope (R7.84 billion, with R3.28 billion for food security and farmer support) and the rollout of mobile and web-based technologies for extension officers and researchers. Land and tenure actions, including planned title deed handovers and land acquisition and allocation budgets from the Department of Land Reform and Rural Development, also support the financeability of emerging growers, creating scope for packhouse-linked contracting and lender-aligned compliance packages rather than spot-market selling.
Recent Industry Developments in South Africa Fruits And Vegetables Market
- July 2026: Ceres Fruit Growers completed packhouse infrastructure upgrades, including mobile racking for about 4,000 pallets and automated pallet-movement systems. The changes improve cold handling efficiency and throughput, supporting higher service levels for export programs that depend on tight grading and dispatch windows.
- October 2025: Maersk inaugurated the Belcon Cold Store in Cape Town as part of a broader investment program exceeding USD 100 million in South Africa's cold chain infrastructure. Expanded cold storage capacity strengthens export readiness for premium fruit by reducing temperature breaks and supporting longer holding times during port and vessel schedule disruptions.
- February 2024: The Department of Agriculture, Land Reform and Rural Development allocated ZAR 2.8 billion (USD 155 million) to cold-storage subsidies, packhouse upgrades, and export certification initiatives under the Agriculture and Agro-processing Master Plan implementation. This funding accelerated post-harvest modernization and compliance capacity, directly supporting higher-value export channels for fruits and vegetables.
South Africa Fruits And Vegetables Market Report Scope and Research Methodology
Market Definition and Coverage
For this methodology, the market means the value of fruits and vegetables traded in South Africa during the year, counted at the first fresh sale across formal wholesale, retail, and export channels, and limited to whole produce that has been picked, graded, and sold.
Scope exclusions: Excludes further processed derivatives after the first fresh sale (for example, juices, jams, and canned products) and it does not force in informal trade where it cannot be validated consistently.
Segments Covered in This Report
- By Type
- Vegetables
- Potatoes
- Production Analysis
- Production Volume
- Area Harvested and Yield
- Consumption Analysis (Value and Volume)
- Trade Analysis (Value and Volume)
- Import Market Analysis
- Import Value and Volume
- Key Supplying Markets
- Export Market Analysis
- Export Value and Volume
- Key Destination Markets
- Import Market Analysis
- Wholesale Price Trend Analysis and Forecast
- Seasonality Analysis
- Production Analysis
- Onions
- Production Analysis
- Production Volume
- Area Harvested and Yield
- Consumption Analysis (Value and Volume)
- Trade Analysis (Value and Volume)
- Import Market Analysis
- Import Value and Volume
- Key Supplying Markets
- Export Market Analysis
- Export Value and Volume
- Key Destination Markets
- Import Market Analysis
- Wholesale Price Trend Analysis and Forecast
- Seasonality Analysis
- Production Analysis
- Tomatoes
- Production Analysis
- Production Volume
- Area Harvested and Yield
- Consumption Analysis (Value and Volume)
- Trade Analysis (Value and Volume)
- Import Market Analysis
- Import Value and Volume
- Key Supplying Markets
- Export Market Analysis
- Export Value and Volume
- Key Destination Markets
- Import Market Analysis
- Wholesale Price Trend Analysis and Forecast
- Seasonality Analysis
- Production Analysis
- Carrots
- Production Analysis
- Production Volume
- Area Harvested and Yield
- Consumption Analysis (Value and Volume)
- Trade Analysis (Value and Volume)
- Import Market Analysis
- Import Value and Volume
- Key Supplying Markets
- Export Market Analysis
- Export Value and Volume
- Key Destination Markets
- Import Market Analysis
- Wholesale Price Trend Analysis and Forecast
- Seasonality Analysis
- Production Analysis
- Cabbage and Brassicas
- Production Analysis
- Production Volume
- Area Harvested and Yield
- Consumption Analysis (Value and Volume)
- Trade Analysis (Value and Volume)
- Import Market Analysis
- Import Value and Volume
- Key Supplying Markets
- Export Market Analysis
- Export Value and Volume
- Key Destination Markets
- Import Market Analysis
- Wholesale Price Trend Analysis and Forecast
- Seasonality Analysis
- Production Analysis
- Pumpkins and Squash
- Production Analysis
- Production Volume
- Area Harvested and Yield
- Consumption Analysis (Value and Volume)
- Trade Analysis (Value and Volume)
- Import Market Analysis
- Import Value and Volume
- Key Supplying Markets
- Export Market Analysis
- Export Value and Volume
- Key Destination Markets
- Import Market Analysis
- Wholesale Price Trend Analysis and Forecast
- Seasonality Analysis
- Production Analysis
- Others (Spinach, Sweet Corn, etc.)
- Production Analysis
- Production Volume
- Area Harvested and Yield
- Consumption Analysis (Value and Volume)
- Trade Analysis (Value and Volume)
- Import Market Analysis
- Import Value and Volume
- Key Supplying Markets
- Export Market Analysis
- Export Value and Volume
- Key Destination Markets
- Import Market Analysis
- Wholesale Price Trend Analysis and Forecast
- Seasonality Analysis
- Production Analysis
- Potatoes
- Fruits
- Citrus (Oranges, Lemons/Limes, Grapefruit)
- Production Analysis
- Production Volume
- Area Harvested and Yield
- Consumption Analysis (Value and Volume)
- Trade Analysis (Value and Volume)
- Import Market Analysis
- Import Value and Volume
- Key Supplying Markets
- Export Market Analysis
- Export Value and Volume
- Key Destination Markets
- Import Market Analysis
- Wholesale Price Trend Analysis and Forecast
- Seasonality Analysis
- Production Analysis
- Apples and Pears
- Production Analysis
- Production Volume
- Area Harvested and Yield
- Consumption Analysis (Value and Volume)
- Trade Analysis (Value and Volume)
- Import Market Analysis
- Import Value and Volume
- Key Supplying Markets
- Export Market Analysis
- Export Value and Volume
- Key Destination Markets
- Import Market Analysis
- Wholesale Price Trend Analysis and Forecast
- Seasonality Analysis
- Production Analysis
- Grapes
- Production Analysis
- Production Volume
- Area Harvested and Yield
- Consumption Analysis (Value and Volume)
- Trade Analysis (Value and Volume)
- Import Market Analysis
- Import Value and Volume
- Key Supplying Markets
- Export Market Analysis
- Export Value and Volume
- Key Destination Markets
- Import Market Analysis
- Wholesale Price Trend Analysis and Forecast
- Seasonality Analysis
- Production Analysis
- Avocados
- Production Analysis
- Production Volume
- Area Harvested and Yield
- Consumption Analysis (Value and Volume)
- Trade Analysis (Value and Volume)
- Import Market Analysis
- Import Value and Volume
- Key Supplying Markets
- Export Market Analysis
- Export Value and Volume
- Key Destination Markets
- Import Market Analysis
- Wholesale Price Trend Analysis and Forecast
- Seasonality Analysis
- Production Analysis
- Bananas
- Production Analysis
- Production Volume
- Area Harvested and Yield
- Consumption Analysis (Value and Volume)
- Trade Analysis (Value and Volume)
- Import Market Analysis
- Import Value and Volume
- Key Supplying Markets
- Export Market Analysis
- Export Value and Volume
- Key Destination Markets
- Import Market Analysis
- Wholesale Price Trend Analysis and Forecast
- Seasonality Analysis
- Production Analysis
- Stone Fruits
- Production Analysis
- Production Volume
- Area Harvested and Yield
- Consumption Analysis (Value and Volume)
- Trade Analysis (Value and Volume)
- Import Market Analysis
- Import Value and Volume
- Key Supplying Markets
- Export Market Analysis
- Export Value and Volume
- Key Destination Markets
- Import Market Analysis
- Wholesale Price Trend Analysis and Forecast
- Seasonality Analysis
- Production Analysis
- Exotic and Other Fruits (Dragon Fruit, Passion Fruit, etc.)
- Production Analysis
- Production Volume
- Area Harvested and Yield
- Consumption Analysis (Value and Volume)
- Trade Analysis (Value and Volume)
- Import Market Analysis
- Import Value and Volume
- Key Supplying Markets
- Export Market Analysis
- Export Value and Volume
- Key Destination Markets
- Import Market Analysis
- Wholesale Price Trend Analysis and Forecast
- Seasonality Analysis
- Production Analysis
- Citrus (Oranges, Lemons/Limes, Grapefruit)
- Vegetables
Data Sources, Market Sizing, and Validation
Desk Research
Desk work was used to set the market boundaries, map the value chain, and anchor volumes, pricing signals, and trade direction before model building. We relied on public references such as Statistics South Africa releases, FAOSTAT crop and production series, ITC Trade Map style customs trade statistics, and South African Department of Agriculture publications, which helped keep assumptions tied to observable data.
To stress test pricing and flow assumptions, we also checked signals such as major fresh produce market and auction updates, industry association pages for horticulture, and reputable press coverage on weather shocks and logistics constraints. For company context, annual reports and investor presentations were reviewed, and a paid subscription for company financials and news helped track operating footprint changes and major capacity or route announcements. This list is illustrative only, and many other sources were also reviewed to collect data, validate assumptions, and clarify gaps.
Primary Interviews and Surveys
Primary work focused on cross-checking what drives real traded value in South Africa, including how volumes move between wholesale markets, modern retail, and export packs, and how prices change by season and grade. We spoke with supply chain participants, produce traders, distributors, organized retailers, and sector specialists, and then used follow-ups to resolve mismatches found in desk assumptions and to align the final model with current market behavior.
Distribution of primary research fieldwork respondents
| Company type | Respondent position |
|---|---|
| Top tier: 31% | CXOs: 16% |
| Mid tier: 49% | Functional/Unit leaders: 41% |
| Smaller Players: 20% | Managers: 43% |
Market-Sizing & Forecasting
Sizing starts with a top-down reconstruction where production, net trade, and channel allocation are converted into a traded fresh value pool at the first sale point. To keep the logic practical, the model is built around a small set of drivers that can be tracked year to year, and then the totals are corroborated with selective bottom-up checks like sampled price per kilogram by category and grade, plus channel level volume splits validated through interviews.
Key inputs used in the model include harvested output trends and yield swings (weather sensitivity shows up quickly here), import and export momentum by broad produce group, wholesale market throughput patterns, retail price movement and seasonal spreads, and the share of produce routed to export packhouses versus domestic trade. Forecasts were shaped using scenario analysis supported by expert views on rainfall and load-shedding risk, logistics constraints, and expected export demand conditions, which are then translated into volume and pricing paths. Where granular price or volume series were missing, gaps were handled through conservative interpolation and by keeping any implied unit prices within observed seasonal bands.
Data Validation & Update Cycle
Outputs are checked in several passes so totals make sense against independent signals like export receipts direction, wholesale market activity cues, and known seasonal inflection points. Any large step changes are flagged, rechecked for unit and currency consistency, and then traced back to the exact assumption that created the variance before it can remain in the model.
A second analyst review is completed before sign-off so calculation logic and scope rules are applied consistently across history and forecast years. The report is refreshed annually, and interim updates are made when material events occur such as major weather disruptions, sharp currency moves, or policy and trade changes that can shift volumes or realized prices. Before delivery, the model is re-opened for a fresh pass so clients receive the latest updated view based on the newest validated inputs.
Mordor Intelligence's South Africa Fruits and Vegetables Market Estimate Compared With Other Published Estimates
Published market sizes for South Africa fruits and vegetables can look far apart even when they refer to the same country, because the counting point and product scope are not always aligned. The spread usually comes from differences in whether values are recorded at farm gate, first trade, or final retail, and whether exports are netted out or treated as additional value.
Some external estimates roll fresh and processed derivatives into one number, and others lean heavily on consumer spend values that can double count margins across steps. Here, the approach stays narrower, Mordor Intelligence counts only whole produce at the first fresh sale across wholesale, retail, and exports, and processed items are kept outside the total even when they appear in the wider market context.
Benchmark comparison
| Source | Market Size | Gaps in Research Methodology |
|---|---|---|
| Mordor Intelligence | USD 9.70 B (2025) | |
| Global Consultancy A | USD 22.18 B (2024) | Uses a revenue lens closer to end-market consumer value for fresh produce, which can embed downstream margins and broader retail price effects that are not part of a first-sale traded value approach. |
| Industry Publisher B | USD 2.38 B (2024) | Appears to apply a tighter value pool that may resemble a subset of formal channel trade or a narrower definition of what is counted as market value, which can understate totals if major routes like export trade are not fully captured. |
The comparison shows how the same country market can swing depending on whether pricing is captured at retail, farm gate, or first trade, and on whether processing and double counting are controlled. By tying the total to observable production and trade direction, and then pressure testing channel splits and seasonal pricing through interviews, the estimate stays traceable to a repeatable set of assumptions.
Key Questions Answered in the Report
How large is the South Africa fruits and vegetables market in 2026 and how fast will it grow?
The market reached USD 10.24 billion in 2026 and is set to grow to USD 12.82 billion by 2031 at a compound annual growth rate of 4.60%.
Which product category currently holds the largest share?
Vegetables lead with 60.3% of South Africa fruits and vegetables market share in 2025, supported by staple demand for potatoes, onions, and tomatoes.
Which category is expanding the fastest?
Fruits, especially citrus, avocados, and table grapes, are projected to expand at a 3.6% CAGR through 2031 due to premium export demand.
Which province contributes most to export-oriented horticulture?
Western Cape dominates pome fruit, table grapes, and stone fruit while Limpopo and Mpumalanga lead in citrus, reflecting distinct regional specialization.
What are the main risks facing growers?
Key risks include European Union and United States sanitary barriers, drought-related water restrictions, rising irrigation tariffs, and exchange-rate volatility on imported inputs.
Which companies command the largest infrastructure footprint?
Vertically integrated groups such as Westfalia Fruit, Capespan Group, and Dutoit Group collectively process about 45% of certified export cartons and possess extensive pack-house and cold-chain capacity.