
Tanzania Fruits And Vegetables Market Analysis by Mordor Intelligence
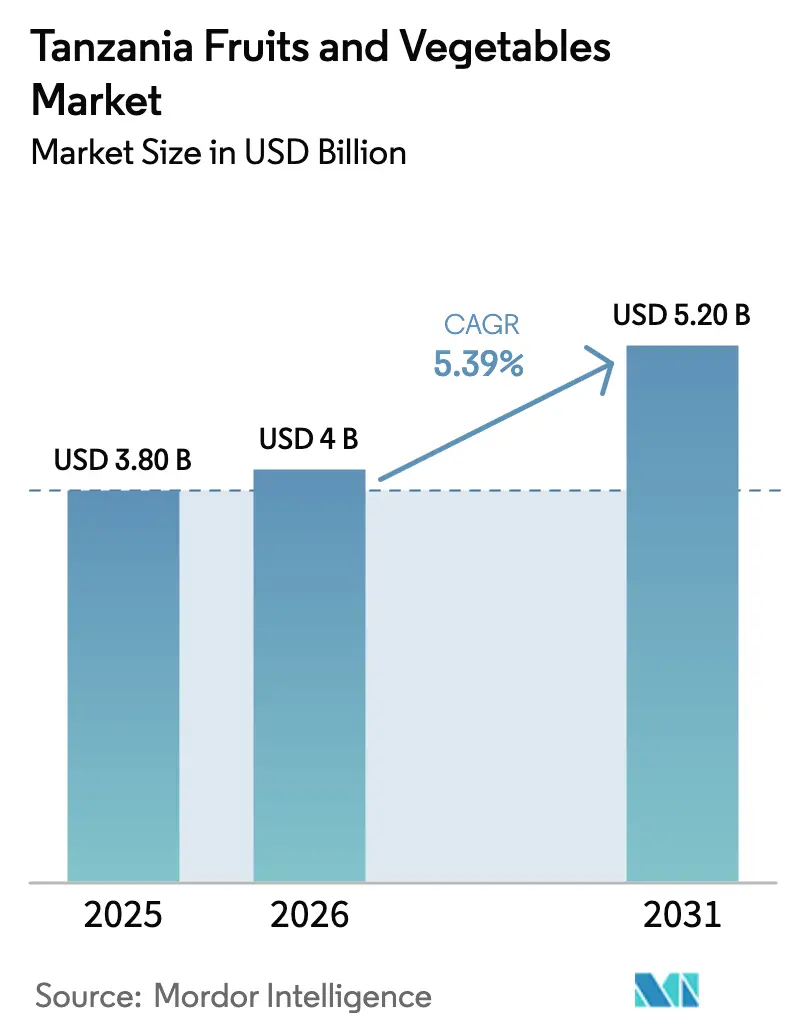
The Tanzania fruits and vegetables market size was valued at USD 3.8 billion in 2025 and estimated to grow from USD 4.0 billion in 2026 to reach USD 5.2 billion by 2031, at a CAGR of 5.39% during the forecast period (2026-2031). Port upgrades, third-party cold-chain investments, and a government push to reach USD 2 billion in annual horticultural exports are accelerating trade flows. Vegetables still anchor domestic consumption, yet the fruits segment is expanding faster as Hass avocado orchards mature and new Chinese market access diversifies export destinations. Modern, GlobalG.A.P–certified packhouses integrate smallholders, while digital agronomy services raise yields and narrow knowledge gaps. Persistent bottlenecks, especially inland refrigerated trucking shortages and post-harvest losses exceeding 30%, remain the primary hindrance to supply-chain efficiency.
Key Report Takeaways
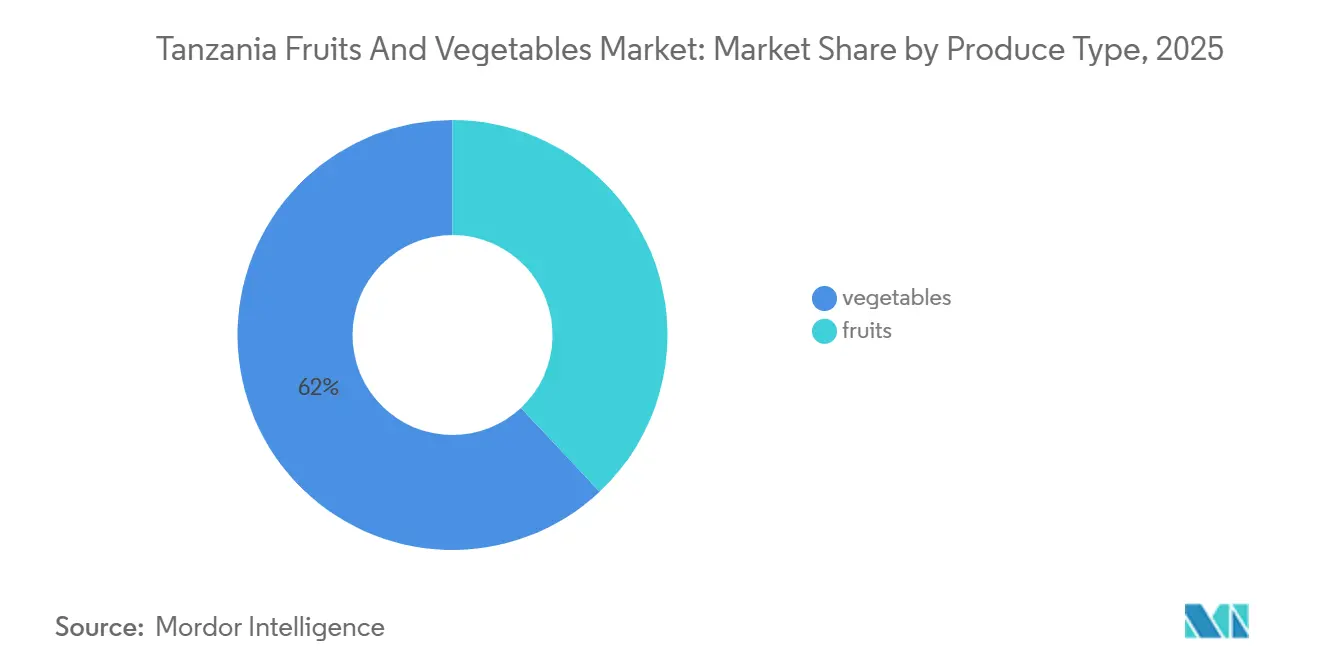
- By produce type, vegetables led with 62% of Tanzania's fruit and Vegetable market value in 2025, while fruits are poised for a 7.5% CAGR through 2031.
Note: Market size and forecast figures in this report are generated using Mordor Intelligence’s proprietary estimation framework, updated with the latest available data and insights as of January 2026.
Tanzania Fruits And Vegetables Market Trends and Insights
Drivers Impact Analysis*
| Driver | (~) % Impact on CAGR Forecast | Geographic Relevance | Impact Timeline |
|---|---|---|---|
| Expanding horticultural export corridors | +0.9% | Coastal, Northern, and Southern zones | Medium term (2–4 years) |
| Cold-chain investments by third-party logistics specialists | +0.8% | Coastal, Northern, and Southern zones | Medium term (2–4 years) |
| Growing domestic demand for ready-to-cook produce | +0.7% | Coastal, Northern, and Lake zones | Short term (≤ 2 years) |
| Contract-farming programs by large supermarket chains | +0.6% | Northern, Coastal, and Lake zones | Short term (≤ 2 years) |
| Digitized extension services (SMS agronomy alerts) | +0.5% | National | Medium term (2–4 years) |
| Rapid growth of avocado orchards in Southern Highlands | +0.8% | Southern and Northern Highlands | Long term (≥ 4 years) |
| Source: Mordor Intelligence | |||
Expanding Horticultural Export Corridors
Port upgrades in Dar es Salaam and Tanga cut export lead times to the European Union by three days, preserving shelf life and enhancing price realization. The Dar es Salaam Maritime Gateway Project trimmed vessel turnaround from 5.2 days in 2023 to 3.8 days in 2025. Tanga’s USD 12 million rehabilitation added a cold-storage terminal that ships directly to Middle Eastern buyers. The Ministry of Agriculture attributes 15% of the targeted USD 2 billion horticultural exports for 2030 to these corridor efficiencies. Faster clearance also lowers demurrage fees, improving exporter cash flow and encouraging reinvestment in orchard expansion. Importantly, shorter transit times reduce rejection rates at European distribution centers, strengthening Tanzania’s reputation for reliability.
Cold-Chain Investments by Third-Party Logistics Specialists
ARCH Cold Chain Fund committed USD 18 million in 2024 to four regional hubs, each with a 3,000-ton capacity. The Food and Agriculture Organization's (FAO) 24 solar cold rooms in Njombe and Mbeya reduced losses from 40% to below 15% [1]Source: Food and Agriculture Organization of the United Nations, “Official Website,” Food and Agriculture Organization, fao.org. Africado’s Kilimanjaro facility integrates training for 2,290 farmers, demonstrating how infrastructure facilitates the inclusion of smallholders. Access to reliable cooling is especially critical because harvests must travel up to 600 kilometers to port. Cold-chain access also enables diversification into higher-value berries and fresh-cut products that demand strict temperature control. As third-party specialists scale, service fees are falling, making chilled logistics accessible to mid-tier aggregators.
Growing Domestic Demand for Ready-to-Cook Produce
Dar es Salaam, now home to 7.4 million residents, is driving demand for pre-washed and chopped vegetables sold by Quality Center and Shoppers Plaza supermarkets. TBS introduced 14 produce quality standards to support retail packaging [2]Source: Tanzania Bureau of Standards, “Official Website,” Tanzania Bureau of Standards, tbs.go.tz. Zanzibar hotels source 63% of produce locally, signaling a rising food-service channel. Margins widen for processors who extend shelf life compared with raw produce wholesalers. Ready-to-cook packs reduce household meal-prep time, a key benefit for dual-income urban families. Processors earn higher margins per kilogram by selling convenience rather than raw bulk produce. Steady domestic demand cushions exporters against international market fluctuations, enhancing revenue stability.
Contract-farming Programs by Large Supermarket Chains
The EAT Fresh partnership guarantees off-take for 4,000 smallholders, reducing weekly price swings of up to 40%. Rikolto’s project enrolled more than 14,000 farmers and launched 489 demo plots to boost export-grade vegetable supply [3]Source: Rikolto, “Official Website,” Rikolto, rikolto.org. Quality Center advances seed and provides extension support in exchange for exclusive supply. Stable contracts incentivize growers to adopt improved seed and irrigation, lifting yields and quality. Supermarkets gain year-round volumes that meet traceability requirements, cutting reliance on volatile spot procurement. The model also fosters youth engagement by offering predictable income streams in horticulture.
Restraints Impact Analysis*
| Restraint | (~) % Impact on CAGR Forecast | Geographic Relevance | Impact Timeline |
|---|---|---|---|
| Post-harvest loss rates exceeding 30 percent | -1.2% | National | Short term (≤ 2 years) |
| Limited refrigerated trucking capacity inland | -0.9% | Southern, Central, and Lake zones | Medium term (2–4 years) |
| Volatile farm-gate pricing due to informal middlemen | -0.7% | National | Short term (≤ 2 years) |
| Outbreaks of Tuta absoluta and fruit flies | -0.6% | Southern and Northern Highlands | Short term (≤ 2 years) |
| Source: Mordor Intelligence | |||
Post-Harvest Loss Rates Above 30 Percent
Tomato losses range from 20% to 40% under normal conditions and can spike to 50% during pest outbreaks. The United States Agency for International Development (USAID) Tuhifadhi Chakula project aims to reduce food waste to 5% by 2030 through training and the development of cooling structures. High loss rates erode farmer incomes and undermine supply reliability for exporters. Wastage inflates consumer prices in urban centers, cutting affordability for low-income households. Excess organic waste also contributes to methane emissions, an emerging sustainability concern for global buyers.
Limited Refrigerated Trucking Capacity Inland
Only 180 certified reefer trucks serve the entire country. The 600-kilometer Mbeya to Dar es Salaam haul often takes 10 hours in 30-degree heat, causing crops to wilt. Some exporters route cargo via Kenya, incurring an additional USD 0.15 per kilogram in costs. Financing hurdles and high diesel prices slow fleet expansion. Limited backhaul opportunities raise per-trip costs, deterring private investment. Without reliable trucking, the economic case for up-country cold rooms weakens, perpetuating the storage deficit.
*Our forecasts treat driver/restraint impacts as directional, not additive. The impact forecasts reflect baseline growth, mix effects, and variable interactions.
Segment Analysis
By Produce Type: Vegetables Anchor Domestic Demand, Fruits Lead Export Upside
Vegetables accounted for 62% of Tanzania's fruit and vegetable market value in 2025, reflecting staple status for tomatoes, onions, and leafy greens. Tomatoes alone represented more than half of the production tonnage. However, Tuta absoluta and high loss rates hindered the development of an effective, marketable supply. Onions and cabbages thrive under Central Zone irrigation, while French beans and snow peas earn premium export revenue through GlobalG.A.P. pack houses.
The fruits segment is projected to grow at a 7.5% CAGR through 2031, outpacing the vegetables segment, driven by the expansion of avocado orchards and new market access in China. Mangoes face 25 to 40% on-farm losses, yet investments in pack houses and pest management aim to unlock Middle East demand. Passion fruit and citrus remain domestically focused but benefit from tourism-led fresh-cut demand in Zanzibar.


Geography Analysis
The Northern Highlands controlled the majority of Tanzania's fruit and vegetable market share in 2025, propelled by volcanic soils, reliable rainfall, and proximity to Kilimanjaro International Airport. Exporters ship more than 8,000 metric tons of French beans and snow peas annually. Long-standing input suppliers and freight forwarders keep transaction costs low. Land scarcity and rising costs, however, are prompting new investments to move southward.
The Southern Highlands are forecast to post the fastest CAGR from 2026 to 2031, led by 4,500 hectares of new Hass avocado plantations. TAHA’s five collection centers and Nundu pack house bind more than 2,000 farmers into export supply chains. Altitudes of 1,800 to 2,400 meters also support Irish potatoes and carrots that supply Dar es Salaam. Nonetheless, only 180 refrigerated trucks nationwide create cooling gaps on the 600-kilometer route to port.
The Coastal Zone revolves around Dar es Salaam, Pwani, and Tanga, serving both domestic distribution and export logistics. The Dar es Salaam Maritime Gateway Project reduced vessel turnaround time to 3.8 days by 2025, thereby enhancing corridor competitiveness. Tanga Port’s new cold terminal enables direct shipments to the Middle East, cutting logistics costs by 20%. Supermarket demand for ready-to-cook packs is rising in Dar es Salaam’s 7.4 million urban market. The Lake and Central zones remain domestically oriented and are subject to volatile pricing due to broker dominance.
Regulatory Landscape
Tanzania Plant Health and Pesticides Authority (TPHPA) oversees phytosanitary compliance for fresh fruit and vegetable trade, while the Tanzania Bureau of Standards (TBS) sets produce conformity and inspection requirements for both marketed and imported foods. Import controls are anchored in the Standards (Imports Registration and Batch Certification) Regulations, 2021 (as amended in 2025), which require product registration and verification routes such as pre-shipment verification of conformity or destination inspection, with residue and contaminant limits aligned to Codex benchmarks.
High-value horticulture is also seeing tighter scrutiny around avocado quality and marketing conduct. In June 2026, the government announced new avocado trade measures that require buyers to register as agents with the Cereals and Other Produce Regulatory Authority (COPRA), restrict direct farm purchases, and introduce grading categories (Grade One, Grade Two, and industrial), along with export-oriented quality guidance such as minimum dry matter thresholds. Separately, market-access dossiers developed under the STREPHIT project for crops including avocado and pineapple support dossier-based phytosanitary alignment for international market entry.
Value Chain Analysis
The value chain begins with input supply (seed, fertilizer, crop protection) and smallholder-dominant production in hubs such as Arusha, Kilimanjaro, Iringa, and Morogoro. It then moves through brokers and aggregators, packhouses, and domestic wholesale and modern retail, with export channels tied to airport and port logistics. TAHA-led coordination with exporters and packhouses (including GlobalG.A.P.-aligned operations) sits alongside government financing and institutional support through bodies such as the Tanzania Agricultural Development Bank (TADB) and the Tanzania Cooperative Development Commission (TCDC), as well as tax exemptions for many imported agricultural inputs and technologies.
Midstream execution is shaped by informality and logistics constraints. Brokers remain a central node for price discovery and aggregation, but this structure contributes to farm-gate volatility in spot markets. Cold-chain gaps and inland transport constraints, including limited certified reefer trucking, increase losses and reduce grade outturn for temperature-sensitive crops traveling long distances to exit points. Programs aimed at export competitiveness and loss reduction, including Agenda 10/30 (USD 569 million to USD 2 billion horticulture-revenue ambition) and the National Horticulture Development Strategy and Action Plan 2021-2031 (production expansion goal), are shifting attention toward packhouse expansion, cargo handling, and more formal contracting between growers and buyers.
Competitive Landscape
The Tanzania fruits and vegetables market is characterized by the involvement of key players overseeing GlobalG.A.P.-certified packing houses, refrigerated transportation fleets, and phytosanitary compliance systems regulated by the Tanzania Plant Health Inspectorate. These leaders grow revenue at roughly the market's CAGR because vertical integration lets them capture margins 15% to 20% higher than spot-market traders without cold-chain access. Export-focused firms are diversifying beyond the European Union by building supply programs for China and Middle Eastern buyers that prioritize counter-seasonal volumes. Their networks span thousands of contracted smallholders, reducing price volatility and raising on-farm quality through seed advances and agronomic support.
Leading exporters are focusing on key priorities to protect and expand their market share. Investments in the development of regional cold-storage hubs have reduced post-harvest losses from 40% to below 15%. The implementation of digital traceability systems, which integrate farm records, grading data, and temperature logs, has enabled these exporters to secure price premiums of 8% to 10% from buyers who emphasize food safety. Geographic diversification into the Southern Highlands avocado belt allows exporters to capitalize on counter-seasonal export opportunities to Europe while positioning themselves to meet China’s annual avocado demand growth of 18%. Additionally, contract-farming programs are being scaled to include up to 5,000 growers, incorporating soil testing, irrigation system installation, and integrated pest management training, which collectively increase yields by over 10%.
Mid-tier and emerging participants pursue alternative growth paths. Mobile aggregation platforms bypass traditional brokers, connecting farmers with urban retailers and hotels, cutting intermediary margins by up to 30%, and giving growers next-day payment visibility. Domestic processors are launching ready-to-cook packs, dried fruit lines, and frozen formats that target Dar es Salaam’s growing middle class and Zanzibar’s tourism sector, where local sourcing already exceeds 60%. Niche players secure organic and fair-trade certifications to reach premium European Union buyers willing to pay mark-ups of 15% to 20% despite certification costs that must be amortized over multiyear contracts. Cooperative models such as public–private partnerships demonstrate that organized farmer groups can raise farm-gate prices by more than 18% through pooled volumes and stronger negotiating power.
Market Opportunities and Future Outlook
Opportunities are concentrated in compliance-led export expansion and in loss-reduction infrastructure where current bottlenecks are most visible. The government export ambition of USD 2 billion for horticulture, alongside output rising to 9.7 million tonnes in 2024/2025 (from 7.5 million tonnes in 2023/2024), creates scope for investment in aggregation, grading, and cold-chain services that translate volume into exportable quality. Programmatic support such as the Horticulture Exports Accelerator Program (HEAP), which enrolls 24 companies, also supports a pipeline for investments in traceability, food-safety systems, and packhouse upgrades that align with buyer audits.
Fruit-focused value chains are also being reshaped through tighter avocado rules, including COPRA agent registration and grading, while market access channels widen through trade facilitation. In May 2026, China-Africa zero-tariff implementation enabled exporters to engage Chinese buyers more directly. Regional market development has also expanded via fresh-banana access to South Africa following a phytosanitary arrangement between TPHPA and South Africa’s plant protection counterpart, creating an additional outlet that can reward improved post-harvest handling. Domestically, rising demand for ready-to-cook and packaged produce in Dar es Salaam and hotel procurement in Zanzibar supports investments in light processing, packaging, and standards-aligned quality assurance built around TBS produce standards.
Recent Industry Developments
- June 2026: Tanzania Plant Health and Pesticides Authority (TPHPA) agreed a phytosanitary pathway with South Africa’s National Plant Protection Organisation for market access for fresh bananas. The development expands regional export options beyond traditional long-haul routes, making cold-chain execution and compliance at the farm and packing stages more valuable for exporters.
- October 2025: Government officials unveiled a digital export-expansion program combining e-certification, mobile quality inspection apps, and blockchain traceability to streamline compliance for smallholder exporters. Pilot use reduced document-processing time by about 40%, supporting faster clearance and payment cycles in export shipments.
- August 2024: ARCH Cold Chain Fund committed USD 18 million to develop four regional cold-chain hubs of around 3,000-ton capacity each, expanding third-party cooling availability beyond individual exporter-owned assets. The build-out supports longer domestic haul distances to ports and airports and lowers quality losses for temperature-sensitive fruits and vegetables moving from upcountry production zones.


Research Methodology Framework and Report Scope
Market Definition and Coverage
For this study, the Tanzania fruits and vegetables market is defined as the value of fruits and vegetables consumed and traded within Tanzania. This includes locally produced supply plus imports, then netting exports through net availability and pricing cross-checks.
Scope exclusions: Packhouse services, cold chain logistics, fertilizers, seeds, and processed foods where produce is no longer the primary item (for example, ready meals) are excluded from the market value.
Segmentation Overview
- By Produce Type
- Vegetables
- Tomatoes
- Production Analysis
- Production Volume
- Area Harvested and Yield
- Consumption Analysis (Value and Volume)
- Trade Analysis (Value and Volume)
- Import Market Analysis
- Import Value and Volume
- Key Supplying Markets
- Export Market Analysis
- Export Value and Volume
- Key Destinations Markets
- Import Market Analysis
- Wholesale Price Trend Analysis and Forecast
- Seasonality Analysis
- Production Analysis
- Onions
- Production Analysis
- Production Volume
- Area Harvested and Yield
- Consumption Analysis (Value and Volume)
- Trade Analysis (Value and Volume)
- Import Market Analysis
- Import Value and Volume
- Key Supplying Markets
- Export Market Analysis
- Export Value and Volume
- Key Destinations Markets
- Import Market Analysis
- Wholesale Price Trend Analysis and Forecast
- Seasonality Analysis
- Production Analysis
- Cabbage
- Production Analysis
- Production Volume
- Area Harvested and Yield
- Consumption Analysis (Value and Volume)
- Trade Analysis (Value and Volume)
- Import Market Analysis
- Import Value and Volume
- Key Supplying Markets
- Export Market Analysis
- Export Value and Volume
- Key Destinations Markets
- Import Market Analysis
- Wholesale Price Trend Analysis and Forecast
- Seasonality Analysis
- Production Analysis
- Beans
- Production Analysis
- Production Volume
- Area Harvested and Yield
- Consumption Analysis (Value and Volume)
- Trade Analysis (Value and Volume)
- Import Market Analysis
- Import Value and Volume
- Key Supplying Markets
- Export Market Analysis
- Export Value and Volume
- Key Destinations Markets
- Import Market Analysis
- Wholesale Price Trend Analysis and Forecast
- Seasonality Analysis
- Production Analysis
- Chilies and Peppers
- Production Analysis
- Production Volume
- Area Harvested and Yield
- Consumption Analysis (Value and Volume)
- Trade Analysis (Value and Volume)
- Import Market Analysis
- Import Value and Volume
- Key Supplying Markets
- Export Market Analysis
- Export Value and Volume
- Key Destinations Markets
- Import Market Analysis
- Wholesale Price Trend Analysis and Forecast
- Seasonality Analysis
- Production Analysis
- Tomatoes
- Fruits
- Mangoes
- Production Analysis
- Production Volume
- Area Harvested and Yield
- Consumption Analysis (Value and Volume)
- Trade Analysis (Value and Volume)
- Import Market Analysis
- Import Value and Volume
- Key Supplying Markets
- Export Market Analysis
- Export Value and Volume
- Key Destinations Markets
- Import Market Analysis
- Wholesale Price Trend Analysis and Forecast
- Seasonality Analysis
- Production Analysis
- Watermelons
- Production Analysis
- Production Volume
- Area Harvested and Yield
- Consumption Analysis (Value and Volume)
- Trade Analysis (Value and Volume)
- Import Market Analysis
- Import Value and Volume
- Key Supplying Markets
- Export Market Analysis
- Export Value and Volume
- Key Destinations Markets
- Import Market Analysis
- Wholesale Price Trend Analysis and Forecast
- Seasonality Analysis
- Production Analysis
- Oranges
- Production Analysis
- Production Volume
- Area Harvested and Yield
- Consumption Analysis (Value and Volume)
- Trade Analysis (Value and Volume)
- Import Market Analysis
- Import Value and Volume
- Key Supplying Markets
- Export Market Analysis
- Export Value and Volume
- Key Destinations Markets
- Import Market Analysis
- Wholesale Price Trend Analysis and Forecast
- Seasonality Analysis
- Production Analysis
- Pineapples
- Production Analysis
- Production Volume
- Area Harvested and Yield
- Consumption Analysis (Value and Volume)
- Trade Analysis (Value and Volume)
- Import Market Analysis
- Import Value and Volume
- Key Supplying Markets
- Export Market Analysis
- Export Value and Volume
- Key Destinations Markets
- Import Market Analysis
- Wholesale Price Trend Analysis and Forecast
- Seasonality Analysis
- Production Analysis
- Avocado
- Production Analysis
- Production Volume
- Area Harvested and Yield
- Consumption Analysis (Value and Volume)
- Trade Analysis (Value and Volume)
- Import Market Analysis
- Import Value and Volume
- Key Supplying Markets
- Export Market Analysis
- Export Value and Volume
- Key Destinations Markets
- Import Market Analysis
- Wholesale Price Trend Analysis and Forecast
- Seasonality Analysis
- Production Analysis
- Mangoes
- Vegetables
Data Sources, Market Sizing, and Validation
Desk Research
Desk work was used to build the base structure for supply, trade, and price references before assumptions were tested. We reviewed public statistics such as Tanzania National Bureau of Statistics releases, FAOSTAT time series, UN Comtrade trade data, and International Trade Centre trade indicators to anchor production and the direction of imports and exports.
To ground pricing and demand context, we also checked materials such as Bank of Tanzania publications, Ministry of Agriculture updates, and selected peer reviewed horticulture and post harvest loss studies. Company filings, investor presentations, and reputable local and international press were used to confirm channel shifts and investment activity, and a paid subscription database for shipment level import export checks was used selectively to validate direction and timing. These examples are not exhaustive, and many other public sources were also referenced for data collection, validation, and clarification.
Primary Interviews and Surveys
We speak with growers, processors, traders, wholesalers, retailers, logistics providers, and agriculture officials in Tanzania. Interviews and surveys clarify production gaps, wholesale pricing, post-harvest loss, import dependence, seasonality, and channel margins. These inputs help adjust secondary assumptions and reconcile the final estimate. Re-contact is used when a reported change lacks support from another local signal.
Distribution of primary research fieldwork respondents
| Company type | Respondent position |
|---|---|
| Top tier: 28% | CXOs: 15% |
| Mid tier: 47% | Functional/Unit leaders: 30% |
| Smaller Players: 25% | Managers: 55% |
Market-Sizing & Forecasting
Sizing was built using a top down logic where production and trade data reconstruct the domestic availability pool, then that pool is converted into value using wholesale and farmgate price references adjusted for typical margins and losses. To keep the totals realistic, we also used selective bottom-up checks, such as sampled crop baskets (volume by key produce groups) multiplied by observed price bands captured in channel discussions.
Key inputs used in the model included fruit and vegetable production volumes (metric tons), import and export volumes and values, seasonal wholesale price movements, estimated post harvest loss rates, and changes in marketed surplus linked to irrigation and improved seed adoption discussed in interviews. Forecasts were developed through scenario analysis, varying yield and planted area trends, trade policy signals, and inflation and currency assumptions within ranges experts said were reasonable. When a product line had limited reporting, gaps were handled by using proxy crops with similar seasonality and price behavior, followed by interview based correction factors.
Data Validation & Update Cycle
Outputs were checked against independent signals such as trade direction consistency, implied per capita availability, and whether modeled prices stayed within observed seasonal ranges. If any variance looked unusual, the assumptions were revisited, and respondents were re contacted when needed to understand whether a change reflected weather shocks, border frictions, or a short term price spike.
Before sign off, a multi step review is done where another analyst traces the arithmetic, units, and conversions, then tests whether the storyline matches the final numbers. Reports are refreshed annually, and interim updates are made when major events change supply, trade, or pricing. Right before delivery, we do a final pass to ensure the latest public releases are reflected.
Mordor Intelligence's Tanzania Fruits and Vegetables Market Size Compared With Other Published Estimates
Published market values for Tanzania fruits and vegetables can differ even when everyone is looking at the same country, because the data building blocks are not identical. Differences usually come from the base year chosen, whether the model values focus on fresh only or includes processed forms, and how trade and price series are translated into a single market value.
Export and import value trends, combined with production and wholesale price checks, are the evidence used to keep Mordor Intelligence's 2025 estimate aligned to Tanzania net availability in USD terms, rather than mixing in processed categories or relying on limited channel pricing snapshots.
Benchmark comparison
| Source | Market Size | Gaps in Research Methodology |
|---|---|---|
| Mordor Intelligence | USD 3.80 B (2025) | |
| Trade Publisher A | USD 2.17 B (2024) | Uses an earlier base year and does not clearly state how farmgate and wholesale price dispersion is handled, which can understate value in high price seasons and urban channels. |
| Global Consultancy B | USD 2.40 B (2024) | Broader scope appears to blend fresh and processed product forms, and the currency and inflation treatment over the 2024 to 2031 window is not transparent, which can shift the stated market value. |
The spread across figures is mainly explained by base year selection, whether fresh only is isolated from processed forms, and how price conversion is handled from volume and trade data. By tying the value build up to observable production and trade flows, then pressure testing price bands with interviews, the estimate stays traceable to clear inputs that can be repeated each refresh.


Key Questions Answered in the Report
What is the current size of the Tanzania fruits and vegetables market?
The market was valued at USD 4.0 billion in 2026.
Which product category is growing fastest?
Fruits, led by Hass avocado, are forecast to advance at a 7.5% CAGR through 2031.
What is the main logistical constraint for exporters?
Limited inland refrigerated trucking, with only 180 certified reefer trucks nationwide, raises spoilage risk and costs.
How significant are post-harvest losses?
Losses exceed 30% nationally, reaching 40% for some crops, but targeted cold-chain investments aim to reduce them below 15%.
Page last updated on:


 Your data is secure and never sold or shared.


