
Qatar Fruit And Vegetable Market Analysis by Mordor Intelligence
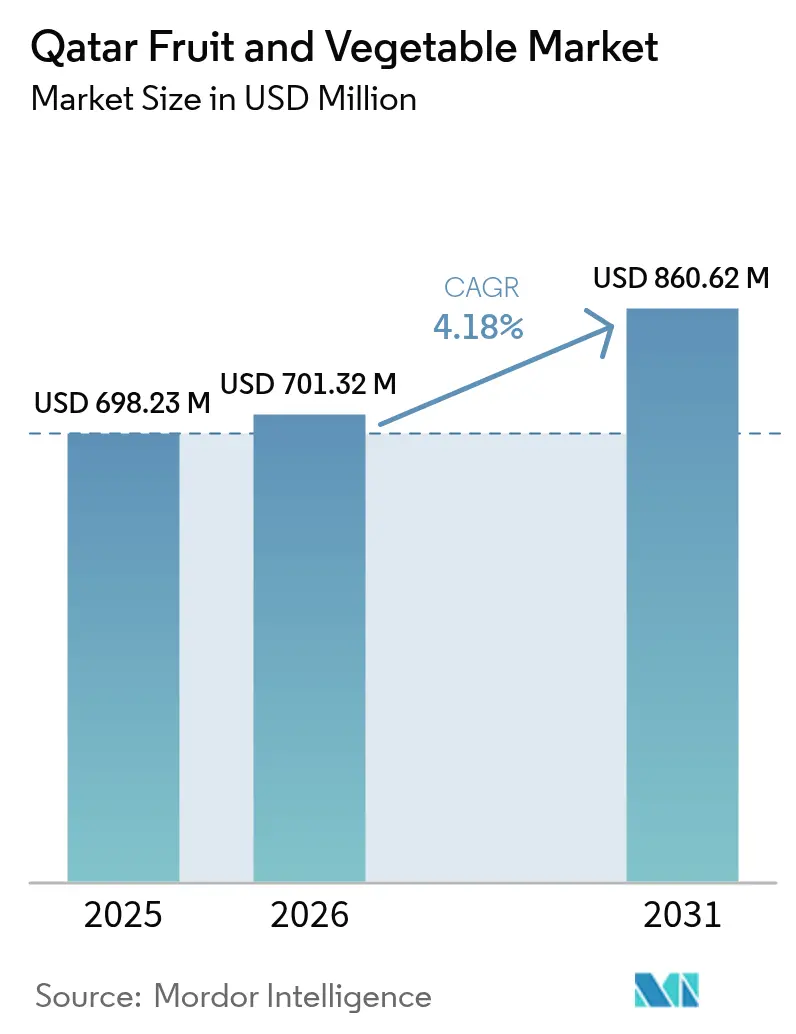
The Qatar fruit and vegetable market size is projected to expand from USD 698.23 million in 2025 and USD 701.32 million in 2026 to USD 860.62 million by 2031, registering a 4.18% CAGR over 2026-2031. Intensive investment in controlled-environment agriculture and diplomatic blockade has shifted production toward cooled and non-cooled greenhouses, reducing import exposure during the hot season. Government procurement through Mahaseel, energy price reforms that reward efficiency, and rapid technology adoption by firms such as Agrico and Pure Harvest Smart Farms are reshaping cost structures and competitive behavior. Demand is buoyed by rising health awareness among expatriates and locals, who are responding to the Ministry of Public Health's dietary campaigns to increase fresh produce intake by 20% by 2030. Meanwhile, groundwater depletion and volatile electricity tariffs remain structural headwinds that encourage investments in hydroponics, solar cooling, and water-reuse systems.
Key Report Takeaways
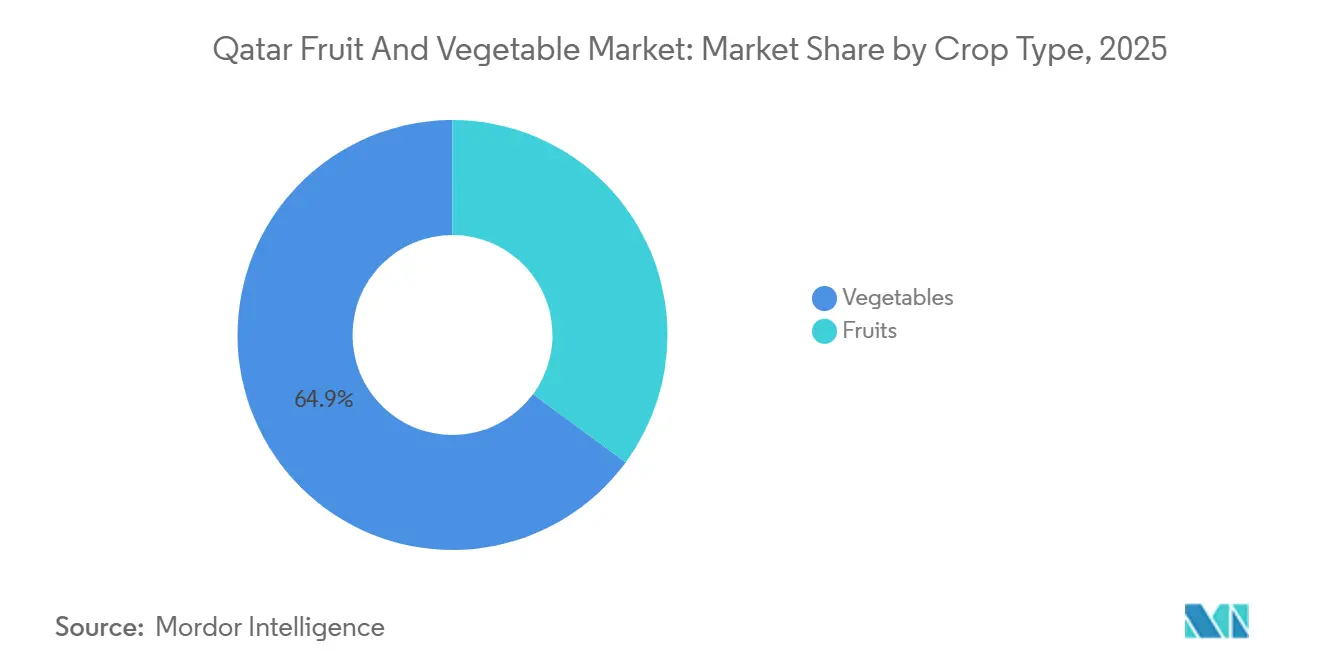
- By crop type, vegetables led with a 64.9% of the Qatar fruit and vegetable market share in 2025, while fruits are set to post the fastest 5.0% CAGR through 2031.
Note: Market size and forecast figures in this report are generated using Mordor Intelligence’s proprietary estimation framework, updated with the latest available data and insights as of 2026.
Qatar Fruit And Vegetable Market Trends and Insights
Drivers Impact Analysis*
| Driver | (~)% Impact on CAGR Forecast | Geographic Relevance | Impact Timeline |
|---|---|---|---|
| Expanding protected cultivation acreage | +0.9% | Al Shahaniya, Umm Salal, and Al Khor | Medium term (2-4 years) |
| Government food-security funds for desert agriculture | +0.6% | National, 441 farms funded in 2024 to 2025 | Short term (≤ 2 years) |
| Agri-voltaic projects monetizing dual land use | +0.3% | Pilot sites in Al Khor and Qatar University | Long term (≥ 4 years) |
| Increasing per-capita fruit and vegetable intake targets | +0.5% | National dietary programs | Medium term (2-4 years) |
| Surplus desalination brine valorized for fertigation | +0.3% | Experimental coastal farms | Long term (≥ 4 years) |
| Proven yield gains from hydroponics and vertical farms | +0.7% | Agrico, Pure Harvest, and Qatar University | Short term (≤ 2 years) |
| Source: Mordor Intelligence | |||
Expanding Protected Cultivation Acreage
Protected cultivation in Qatar is expanding rapidly to improve food security, with a focus on greenhouses and net houses to address the challenges posed by harsh climatic conditions. The Ministry of Municipality distributed 3,476 greenhouse structures covering 666 hectares by 2024, targeting 110 hectares of high-tech facilities[1]Source: Ministry of Municipality Qatar, “Agricultural Development and Food Security Initiatives,” mm.gov.qa. The growth clusters around service centers in Al Shahaniya, Umm Salal, and Al Khor now support 150 farms, providing inputs and technical support. Protected facilities safeguard heat-sensitive crops such as lettuce and cucumbers when summer temperatures rise above 45 degrees Celsius, resulting in a 98% increase in total vegetable output over five years. The Ministry of Municipality (MoM) has launched a 2024 project to develop 'protected farms' and implement climate-smart agriculture. This initiative aims to transform open farm areas into closed farms, reducing evaporation, minimizing water loss, and addressing soil-related challenges. Export-oriented farms such as Al Sulaiteen are pairing new acreage with GLOBALG.A.P. compliance to unlock European demand.
Government Food-Security Funds for Desert Agriculture
A flexible voucher program launched in September 2025 lets growers buy seeds, fertilizers, and drip lines from approved dealers instead of accepting mismatched in-kind inputs, improving yield response for tomatoes, cucumbers, eggplants, zucchini, and sweet peppers, which together account for more than 70% of domestic vegetable sales. Mahaseel’s Daman pre-contracting scheme fixes purchase prices before planting, de-risking field decisions for 199 participating farms. Vegetable yards in Sheehaniya, Al Mazrouah, Al Wakrah, Al Khor-Al Thakhira, and Al Shamal offer produce roughly 30% below hypermarket prices, stabilizing household budgets. Complementary tariffs and anti-dumping rules introduced in 2024 further insulate growers from low-cost seasonal imports, anchoring the domestic floor price.
Agri-Voltaic Projects Monetizing Dual Land Use
Solar panels mounted above crop rows are being trialed at Qatar University and commercial farms to offset electricity costs that have ballooned 100-fold following the tariff reform. Research published in 2024 confirmed that lettuce yields under semi-transparent photovoltaic panels match open-field yields while slashing net energy demand by 40%. Although commercial-scale systems remain few, Agrico has signaled its intent to pursue solar integration across 250,000 square meters of greenhouses, and forthcoming Ministry rules are projected to streamline grid connection. Over the long term, crops such as strawberries and leafy greens, which require continuous cooling, stand to gain the most from on-farm electricity generation that mitigates tariff volatility.
Increasing Per-Capita Fruit and Vegetable Intake Targets
Qatar is making significant progress toward enhancing its national food security, aiming to achieve 55% vegetable self-sufficiency by 2030 under the National Food Security Strategy 2024-2030. This strategy emphasizes a 50% increase in local production, promoting consumption through health awareness campaigns, and building on the 39% vegetable self-sufficiency achieved by 2023. Current interventions include school meals, public campaigns, and clearer labeling at retailers such as Lulu Hypermarket and Carrefour that now highlight farm origin and carbon footprint. Rising wellness consciousness among the expatriate majority is fueling demand for pesticide-free and organic produce, prompting Agrico and Paramount Agricole to pursue organic certification. The ministry aims to increase fresh intake by 2030, thereby expanding the addressable demand for fruits and vegetables and supporting capacity additions in hydroponics and vertical farms.
Restraints Impact Analysis*
| Restraint | (~) % Impact on CAGR Forecast | Geographic Relevance | Impact Timeline |
|---|---|---|---|
| Shrinking groundwater reserves in arid regions | −0.6% | Southern and western agricultural zones | Long term (≥ 4 years) |
| Volatile energy prices inflating controlled-environment costs | −0.5% | All greenhouse and vertical farm operators | Short term (≤ 2 years) |
| High salinity drift clogging drip lines | −0.3% | Farms reliant on untreated wells | Medium term (2-4 years) |
| Bio-security risks from expanding seed-import channels | −0.2% | Air and sea entry points | Medium term (2-4 years) |
| Source: Mordor Intelligence | |||
Shrinking Groundwater Reserves in Arid Regions
Qatar experiences severe water stress due to heavily depleted, non-renewable, and brackish groundwater reserves, worsened by over-extraction for agricultural purposes and minimal rainfall. The water table is declining at approximately 1 meter per year, and extraction levels exceed the safe yield by up to 5 times. This has led to significant degradation of the country's limited, predominantly karstic aquifers, including seawater intrusion. The Ministry targets a 70% extraction cut by 2030, hinging on treated sewage effluent, which accounted for only 31% of irrigation in 2019. Scaling reuse to 72% could satisfy more than 90% of crop water demand, but pipeline coverage and on-farm storage lag investment needs. Farms outside effluent networks pay for reverse-osmosis desalination, raising break-even prices and discouraging acreage expansion.
Bio-Security Risks from Expanding Seed-Import Channels
The shift away from neighboring suppliers has led to an increase in seed consignments through Hamad International Airport and Hamad Port. This change reflects efforts to diversify supply chains and reduce dependency on regional sources. Phytosanitary protocols are being strengthened, and customs officers intercepted forty-seven contaminated seed lots in 2024, highlighting ongoing challenges in ensuring seed quality. The Ministry is preparing stricter pre-shipment testing regulations, which may increase lead times and working capital requirements for growers relying on imported genetics for high-value greenhouse crops. These measures aim to enhance biosecurity and safeguard agricultural productivity. However, implementing these stricter protocols may also require additional investments in testing infrastructure and training for customs officials to ensure effective enforcement and minimize disruptions to the supply chain.
*Our forecasts treat driver/restraint impacts as directional, not additive. The impact forecasts reflect baseline growth, mix effects, and variable interactions.
Segment Analysis
By Type: Vegetables Dominate Value While Fruits Lead Growth
Vegetables accounted for 64.9% of the Qatar fruit and vegetable market share in 2025, as Mahaseel pre-contracts reinforce planting confidence and cooled greenhouses extend the production calendar[2]Source: The Peninsula Qatar, “Mahaseel Marketing and Local Vegetable Production,” thepeninsulaqatar.com. According to the Food and Agriculture Organization, tomatoes alone reached 27,321.7 metric tons in 2024, and cucumbers and gharkins followed at 14,410.1 metric tons, both sourced mainly from Al Shahaniya and Umm Salal. Hydroponic leafy green suppliers such as Agrico are compressing cycles to 30 days, capturing premium shelf space in 44 hypermarkets where Mahaseel merchandises local produce within 24 hours of harvest. Potatoes and onions remain largely imported because their long seasons and high field requirements collide with summer heat and scarce water.
Fruits are advancing at a 5.0% CAGR, the fastest among segments, as retailers expand assortments beyond citrus to grapes, berries, and melons that arrive by air from Egypt, Turkey, South Africa, and the United States. Date palm output reached 35,317.6 metric tons in 2024, and the ministry distributed 880 metric tons of offshoots to expand groves. Pilot citrus blocks under shade nets are being tested for local adaptation, while Eden Farm’s mushroom unit targets hotel and airline buyers seeking novelty items. Easier-peel mandarins see demand spikes of up to 40% during Ramadan, illustrating how cultural events shape import scheduling.


Geography Analysis
Qatar's fruit and vegetable market is transitioning from significant import dependence to localized, technology-driven production, with vegetables dominating the market. This shift is propelled by food security objectives, leading to the expansion of hydroponic and greenhouse farming in northern regions, particularly for crops such as tomatoes, cucumbers, and leafy greens. Doha and its suburbs host 99.4% of the population in 2024, enabling same-day delivery from farms in Al Shahaniya, Umm Salal, and Al Khor to retail hubs, which cuts spoilage to below 10% in 2024 compared with 25% in 2010. Five government-operated yards serve as nodal points, feeding forty-four Mahaseel outlets, and integrate collection, grading, and auction activities to shorten the farm-to-shelf interval.
European Union fruit and nut exports to Qatar fell by 19% in 2023 as the country pivoted toward Egypt, Turkey, and South Africa, lowering freight costs and currency risk[3]Source: European Commission, “European Union Agricultural Exports to Qatar,” agriculture.ec.europa.eu. In contrast, shipments from the United States increased by 201% over the decade leading to 2024, driven by the premium positioning of apples and grapes targeting high-income expatriates. The strong demand for high-quality produce among Qatar's affluent expatriate population has bolstered the United States' market share, highlighting the appeal of premium products in this segment.
Qatar’s desert agriculture experiments attract attention from the Gulf Cooperation Council and North African nations facing similar climates. Pure Harvest’s USD 180.5 million raise in 2022 and Agrico for Agricultural Development W.L.L.’s hydroponic demonstration center with Yara International ASA provide templates for technology roll-out elsewhere. The Ministry’s partnership framework, embedded in the 2024 to 2030 plan, encourages foreign joint ventures that bring know-how in solar cooling and nutrient recycling, accelerating regional diffusion.
Regulatory Landscape
Qatar regulates fruits and vegetables through a coordinated framework led by the Ministry of Municipality (agricultural quarantine and controls on seeds, fertilizers, and pesticide imports) and the Ministry of Public Health (food safety oversight for marketed produce). Food items entering commercial channels are tied to digital compliance workflows, including product registration and import inspection under the Ministry of Public Health's electronic processes (Wathiq), with customs clearance routed through the Al Nadeeb single window.
On the import side, conformity assessment requirements apply for regulated categories through the VOC QATAR program, which uses Certificates of Conformity (CoC) as part of the clearance process for specified products. In April 2026, the Ministry of Municipality (Department of Agricultural Affairs) opened applications for technical licenses for agricultural businesses and for importing restricted nitrate-based fertilizers for the 2026/2027 season, reinforcing tighter permitting and documentation for critical farm inputs.
Value Chain Analysis
The value chain begins with inputs (seeds, fertilizers, crop protection products, greenhouse materials, and irrigation components). The Ministry of Municipality supports growers through programs that include the provision of greenhouse units and other inputs, alongside service delivery through agricultural service centers such as Al Shamal (Al Zubara), Al Wasat (Umm Salal), and Al Janoub (Al Shahaniya). Production is increasingly concentrated in protected cultivation and hydroponic systems in clusters such as Al Shahaniya, Umm Salal, and Al Khor, reflecting the need to manage heat and water constraints while improving yields.
Post-harvest aggregation and marketing are structured around government-backed platforms, led by Mahaseel (a Hassad Food subsidiary) as a key collector and buyer via pre-contracting and daily procurement programs. Distribution routes include government vegetable yards and modern retail, where Mahaseel places local produce across multiple hypermarket outlets. Established importers and wholesalers (for example, Sanwara and Al Afisha) also complement supply by managing inbound trade and wholesale distribution for fruits and off-season vegetables. The Ministry of Commerce and Industry's role in strategic stock management adds resilience to the chain, while cold-chain and last-mile logistics capacity remains the main operational lever for reducing spoilage and stabilizing year-round availability.
Competitive Landscape
The market remains moderately fragmented, with more than 950 productive farms alongside vertically integrated players that control greenhouses, logistics, and shelf space. Mahaseel purchased 24,000 metric tons of vegetables worth QAR 68 million (USD 18.7 million) in 2024 and stocked forty-four hypermarket corners, establishing a price floor that narrows private importer margins. Lulu Hypermarket and Carrefour compete on breadth and convenience, while Mahaseel drives volume.
Technology is the key differentiator. Agrico for Agricultural Development W.L.L. operates 250,000 square meters of greenhouses, supplying 1,400 customers, and opened an indoor farm hub on Green Island in May 2025 to showcase vertical farming to students. Baladna Food Industries Q.P.S.C. leveraged its dairy distribution network to launch twenty-five fruit beverage stock-keeping units in the first half of 2025 and partnered with Veolia to recycle 22,000 liters of water daily, halving freshwater use. Al Sulaiteen Agricultural and Industrial Complex Q.S.C. holds GLOBALG.A.P. certification and started selective vegetable exports to Europe.
Emerging disruptors include Paramount Agricole, which secured organic mushroom certification and sells high-margin oyster and shiitake lines, and Global Farm for Agricultural Supplies, which builds turnkey greenhouses while producing cucumbers and peppers. Local input suppliers such as Al Noor Plastic Factory and Mitras Trading Company now provide greenhouse films and custom fertilizers, deepening value-chain localization.
Market Opportunities and Future Outlook
Opportunities center on scaling climate-controlled production and input efficiency under the National Food Security Strategy 2024-2030, which targets 55% vegetable self-sufficiency by 2030 and has already supported material infrastructure expansion, including 8,420 greenhouse units by 2025 and the Ministry's network of agricultural service centers. The push to reduce water stress and operating volatility creates room for hydroponics, vertical farming, solar integration, and water-reuse systems, particularly where farms face groundwater decline and higher energy-linked cooling costs.
Market pull for higher-specification produce is visible in retailer programs that highlight origin and carbon footprint, alongside expansion of organic cultivation, with organic farming land reported as up 207% in 2025 to 813.2 dunams. In 2026, the integrated food security framework spanning production, storage, and marketing has been promoted through national platforms such as AgriteQ, where Hassad Food served as Food Security Partner under an agreement with the Ministry of Municipality. This arrangement helps channel technology vendors and growers into the same procurement and commercialization ecosystem. Import-side compliance digitization (Wathiq and Al Nadeeb) and the VOC QATAR conformity process also support opportunities for specialized service providers in inspection readiness, cold-chain compliance, and faster clearance workflows for fresh produce and controlled inputs.
Recent Industry Developments
- April 2026: The Ministry of Municipality opened applications for technical licenses for agricultural businesses and for importing restricted nitrate-based fertilizers for the 2026/2027 season. The move tightens permitting and documentation requirements around critical farm inputs, influencing cost planning and procurement timing for greenhouse operators.
- November 2025: The Ministry of Municipality launched the second Aswaq Winter Festival in collaboration with Hassad Food Company, showcasing local dates and seasonal fruits and vegetables alongside other domestic products. The event supported demand stimulation and provided an additional route-to-market for small producers and family-run businesses during the peak local season.
- May 2024: The Ministry of Municipality rolled out measures to ensure fair pricing for local agricultural produce during peak season through its marketing platform and sales channels. Strengthening price discipline during harvest periods supported local growers against low-priced seasonal imports and helped stabilize volumes routed through organized markets.


Research Methodology Framework and Report Scope
Market Definition and Coverage
For this study, the market covers the value of fruits and vegetables consumed in Qatar, combining locally produced supply and imported volumes that enter the country supply chain, measured in USD.
Scope exclusions: Processed fruit and vegetable products (such as canned, frozen, freeze-dried, juices, and purees) are excluded from the market value unless they are explicitly traded and priced as fresh produce equivalents.
Segmentation Overview
- By Crop Type
- Vegetables
- Potatoes
- Production Analysis
- Production Volume
- Area Harvested and Yield
- Consumption Analysis (Value and Volume)
- Trade Analysis (Value and Volume)
- Import Market Analysis
- Import Value and Volume
- Key Supplying Markets
- Export Market Analysis
- Export Value and Volume
- Key Destination Markets
- Import Market Analysis
- Wholesale Price Trend Analysis and Forecast
- Seasonality Analysis
- Production Analysis
- Onions
- Production Analysis
- Production Volume
- Area Harvested and Yield
- Consumption Analysis (Value and Volume)
- Trade Analysis (Value and Volume)
- Import Market Analysis
- Import Value and Volume
- Key Supplying Markets
- Export Market Analysis
- Export Value and Volume
- Key Destination Markets
- Import Market Analysis
- Wholesale Price Trend Analysis and Forecast
- Seasonality Analysis
- Production Analysis
- Tomatoes
- Production Analysis
- Production Volume
- Area Harvested and Yield
- Consumption Analysis (Value and Volume)
- Trade Analysis (Value and Volume)
- Import Market Analysis
- Import Value and Volume
- Key Supplying Markets
- Export Market Analysis
- Export Value and Volume
- Key Destination Markets
- Import Market Analysis
- Wholesale Price Trend Analysis and Forecast
- Seasonality Analysis
- Production Analysis
- Carrots
- Production Analysis
- Production Volume
- Area Harvested and Yield
- Consumption Analysis (Value and Volume)
- Trade Analysis (Value and Volume)
- Import Market Analysis
- Import Value and Volume
- Key Supplying Markets
- Export Market Analysis
- Export Value and Volume
- Key Destination Markets
- Import Market Analysis
- Wholesale Price Trend Analysis and Forecast
- Seasonality Analysis
- Production Analysis
- Cabbage and Brassicas
- Production Analysis
- Production Volume
- Area Harvested and Yield
- Consumption Analysis (Value and Volume)
- Trade Analysis (Value and Volume)
- Import Market Analysis
- Import Value and Volume
- Key Supplying Markets
- Export Market Analysis
- Export Value and Volume
- Key Destination Markets
- Import Market Analysis
- Wholesale Price Trend Analysis and Forecast
- Seasonality Analysis
- Production Analysis
- Pumpkins and Squash
- Production Analysis
- Production Volume
- Area Harvested and Yield
- Consumption Analysis (Value and Volume)
- Trade Analysis (Value and Volume)
- Import Market Analysis
- Import Value and Volume
- Key Supplying Markets
- Export Market Analysis
- Export Value and Volume
- Key Destination Markets
- Import Market Analysis
- Wholesale Price Trend Analysis and Forecast
- Seasonality Analysis
- Production Analysis
- Chillies and Peppers
- Production Analysis
- Production Volume
- Area Harvested and Yield
- Consumption Analysis (Value and Volume)
- Trade Analysis (Value and Volume)
- Import Market Analysis
- Import Value and Volume
- Key Supplying Markets
- Export Market Analysis
- Export Value and Volume
- Key Destination Markets
- Import Market Analysis
- Wholesale Price Trend Analysis and Forecast
- Seasonality Analysis
- Production Analysis
- Potatoes
- Fruits
- Citrus (Oranges, Lemons and Limes)
- Production Analysis
- Production Volume
- Area Harvested and Yield
- Consumption Analysis (Value and Volume)
- Trade Analysis (Value and Volume)
- Import Market Analysis
- Import Value and Volume
- Key Supplying Markets
- Export Market Analysis
- Export Value and Volume
- Key Destination Markets
- Import Market Analysis
- Wholesale Price Trend Analysis and Forecast
- Seasonality Analysis
- Production Analysis
- Apples and Pears
- Production Analysis
- Production Volume
- Area Harvested and Yield
- Consumption Analysis (Value and Volume)
- Trade Analysis (Value and Volume)
- Import Market Analysis
- Import Value and Volume
- Key Supplying Markets
- Export Market Analysis
- Export Value and Volume
- Key Destination Markets
- Import Market Analysis
- Wholesale Price Trend Analysis and Forecast
- Seasonality Analysis
- Production Analysis
- Grapes
- Production Analysis
- Production Volume
- Area Harvested and Yield
- Consumption Analysis (Value and Volume)
- Trade Analysis (Value and Volume)
- Import Market Analysis
- Import Value and Volume
- Key Supplying Markets
- Export Market Analysis
- Export Value and Volume
- Key Destination Markets
- Import Market Analysis
- Wholesale Price Trend Analysis and Forecast
- Seasonality Analysis
- Production Analysis
- Peaches and Nectarines
- Production Analysis
- Production Volume
- Area Harvested and Yield
- Consumption Analysis (Value and Volume)
- Trade Analysis (Value and Volume)
- Import Market Analysis
- Import Value and Volume
- Key Supplying Markets
- Export Market Analysis
- Export Value and Volume
- Key Destination Markets
- Import Market Analysis
- Wholesale Price Trend Analysis and Forecast
- Seasonality Analysis
- Production Analysis
- Watermelons
- Production Analysis
- Production Volume
- Area Harvested and Yield
- Consumption Analysis (Value and Volume)
- Trade Analysis (Value and Volume)
- Import Market Analysis
- Import Value and Volume
- Key Supplying Markets
- Export Market Analysis
- Export Value and Volume
- Key Destination Markets
- Import Market Analysis
- Wholesale Price Trend Analysis and Forecast
- Seasonality Analysis
- Production Analysis
- Cantaloupes and Other Melons
- Production Analysis
- Production Volume
- Area Harvested and Yield
- Consumption Analysis (Value and Volume)
- Trade Analysis (Value and Volume)
- Import Market Analysis
- Import Value and Volume
- Key Supplying Markets
- Export Market Analysis
- Export Value and Volume
- Key Destination Markets
- Import Market Analysis
- Wholesale Price Trend Analysis and Forecast
- Seasonality Analysis
- Production Analysis
- Tangerines, Mandarins, and Clementines
- Production Analysis
- Production Volume
- Area Harvested and Yield
- Consumption Analysis (Value and Volume)
- Trade Analysis (Value and Volume)
- Import Market Analysis
- Import Value and Volume
- Key Supplying Markets
- Export Market Analysis
- Export Value and Volume
- Key Destination Markets
- Import Market Analysis
- Wholesale Price Trend Analysis and Forecast
- Seasonality Analysis
- Production Analysis
- Citrus (Oranges, Lemons and Limes)
- Vegetables
Data Sources, Market Sizing, and Validation
Desk Research
Desk work starts with building a clean picture of Qatar supply and demand, and then making sure units and definitions match across sources before any calculations. We relied on public agriculture and trade series and price references such as FAOSTAT, UN Comtrade-style trade tables, national statistics releases, and ministry level agriculture updates. Where available, we cross-checked these with customs summaries and major port or logistics notices.
To convert volumes into market value in a realistic way, we also reviewed observable wholesale price trend references and seasonal availability patterns, and we used company filings, investor presentations, and association or retailer announcements to understand sourcing shifts. A paid subscription for shipment-level import and export data was used selectively to sanity check the country-of-origin mix and to flag sudden one-off swings that can distort a single year. The sources listed here are illustrative, and many other public documents and datasets were also used for validation and clarification during the work.
Primary Interviews and Surveys
Primary inputs were gathered through expert interviews and structured surveys with importers, wholesalers, large retailers, foodservice buyers, and selected growers to confirm pricing behavior, wastage allowances, and channel mix. Since the market is Qatar-only, the outreach focused on the main consumption and distribution nodes in the country. The interviews were used to test assumptions on import dependence, local harvest seasonality, and wholesale-to-retail markups that are difficult to infer from public tables alone.
Distribution of primary research fieldwork respondents
| Company type | Respondent position |
|---|---|
| Top tier: 28% | CXOs: 15% |
| Mid tier: 55% | Functional/Unit leaders: 34% |
| Smaller Players: 17% | Managers: 51% |
Market-Sizing & Forecasting
Sizing is anchored in a top-down build that reconstructs Qatar consumption from the supply side, using production volumes and net trade flows. Those volumes are then translated into value using observed wholesale price movements. After this core is set, we corroborate with selective bottom-up approximations, such as sampled price points by major commodity groups and channel checks on the share typically routed through wholesale markets versus organized retail.
Key model inputs include import volumes and value by produce category, local production volumes for key crops, wholesale price trend direction, estimated post-harvest loss ranges, and seasonality that changes the share of local supply in peak months. For forecasting, scenario analysis is used around import dependence and local output growth, including greenhouse and protected farming adoption, and then the final path is smoothed using short-run trend behavior so one abnormal year does not drive the entire curve. Where bottom-up checks do not cover smaller commodity lines, gaps are handled by applying validated price bands and loss factors to the remaining volumes, and then re-testing the total against trade value signals.
Data Validation & Update Cycle
Outputs are checked in several passes so the final market value remains consistent with independent signals. We compare implied per-capita consumption value against population and food demand direction, and we test whether the implied import bill trend is reasonable versus trade tables and price direction.
Any unusual jumps trigger a review of unit conversions, crop calendar effects, and currency timing. Assumptions are then re-checked with follow-up calls if the variance is still large. A second analyst reviews the model logic and the year-to-year movements before sign-off. Reports are refreshed annually, and interim updates are made when material events occur, followed by a final pre-delivery pass so clients receive the latest view.
Mordor Intelligence's Qatar Fruits and Vegetables Market Size Versus Other Published Estimates
Published market sizes for Qatar fruits and vegetables can look far apart, even when the topic label sounds the same, because the counting rules differ more than most readers expect. Common differences come from what is treated as fresh versus processed, whether the figure is closer to retail spend or wholesale trade value, and which year and exchange rate timing is applied.
Some external figures fold in processed formats or regional totals that are later apportioned to Qatar using broad shares. In Mordor Intelligence, the estimate is limited to the Qatar fresh fruits and vegetables market value and is kept aligned to import and local supply signals plus wholesale price trend checks, which reduces the risk of counting freeze-dried or other processed categories as part of the same pool.
Benchmark comparison
| Source | Market Size | Gaps in Research Methodology |
|---|---|---|
| Mordor Intelligence | USD 698.23 M (2025) | |
| Industry Publisher A | USD 400.00 M (2025) | This figure is for freeze-dried fruits and vegetables, which is a processed subset with a different price structure and demand drivers, so it is not comparable to a fresh produce market value. |
| Trade Platform B | USD 689.59 M (2024) | This is the annual import value of fruits and vegetables into Qatar, which excludes locally produced supply and does not represent total consumption value across the full supply chain. |
The spread is mainly explained by scope and what the value represents, which is why import-only and processed-only figures can sit below a full fresh consumption market. By keeping the model tied to supply availability, trade flow direction, and observable wholesale pricing, the final number stays traceable to inputs that can be checked and repeated year after year.


Key Questions Answered in the Report
How large will Qatar fruit and vegetable demand be by 2031?
The Qatar fruit and vegetable market size is forecast to reach USD 860.62 million by 2031, expanding at a 4.18% compound annual rate from 2026.
Which product category currently dominates grocery sales?
Vegetables lead, holding 64.9% of Qatar fruit and vegetable market share in 2025, with tomatoes and cucumbers forming the bulk of volumes.
What segment is expanding the quickest?
Fruits post the fastest growth, advancing at a 5.0% CAGR as import diversification and pilot orchards boost availability.
Why are hydroponic systems gaining popularity among Qatari growers?
Hydroponics cut water usage by up to ninety percent, mitigate saline groundwater risks, and deliver consistent yields inside climate-controlled facilities.
How is the government supporting growers against import competition?
Mahaseel pre-contracts, tariff protections during peak harvest, and QAR 1.1 billion (USD 302 million) earmarked for greenhouses under the 2024-2030 plan provide price certainty and capital access.
What drives retailer interest in local produce?
Same-day delivery from nearby farms reduces spoilage and carbon footprint, while consumer demand for traceable and pesticide-free food commands premium shelf placement.
Page last updated on:


 Your data is secure and never sold or shared.


