
Fresh Durian Market Size and Share
Fresh Durian Market Analysis by Mordor Intelligence
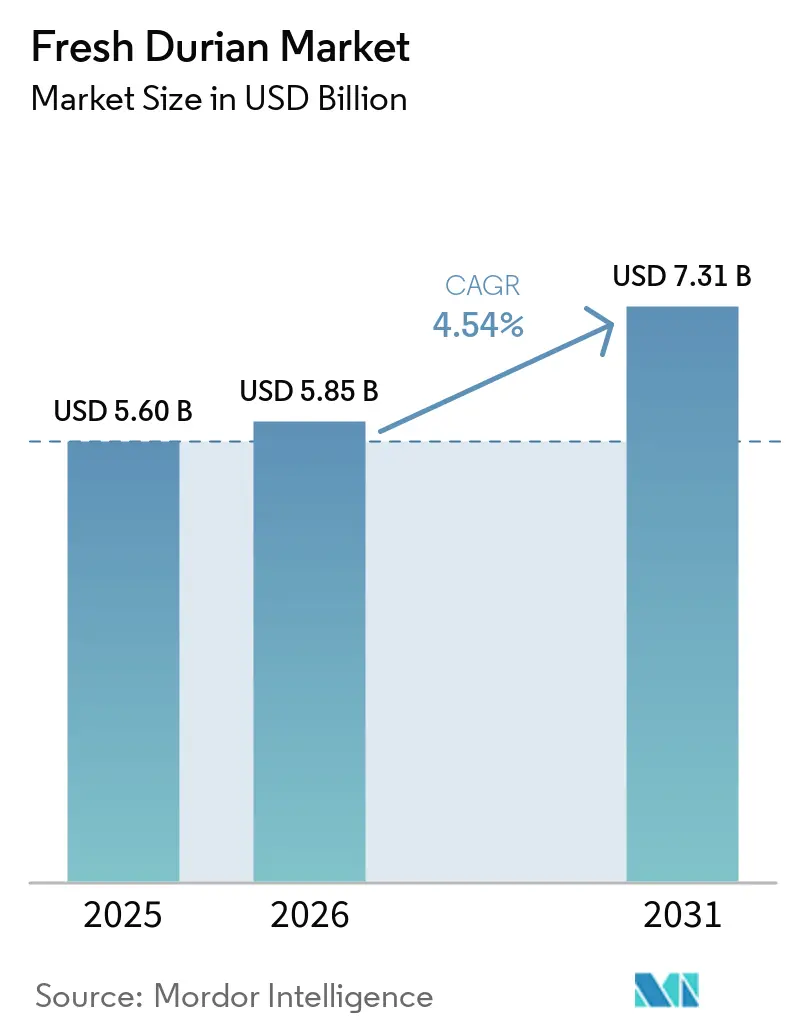
The Fresh Durian Market size was USD 5.60 billion in 2025 and is forecast to reach USD 5.85 billion in 2026 and USD 7.31 billion by 2031, growing at a CAGR of 4.54% from 2026 to 2031. Robust Chinese import demand, backed by 1.56 million metric tons of arrivals in 2024, continues to upend Southeast Asian orchard economics as growers race to secure export certification and controlled-atmosphere logistics. Since early 2025, China has implemented stricter import regulations on Vietnamese durians due to the detection of excessive levels of alkaline yellow and cadmium, creating a premium window for compliant producers. Integrated cold chains that cut spoilage and blockchain-verified provenance that lifts auction prices are accelerating investment in on-farm technologies across Malaysia, Thailand, and Vietnam. At the same time, El Niño-linked heat stress and residue-limit crackdowns in China, the European Union, and the United States expose growers to regulatory and climate shocks that may temper short-term volume gains.
Key Report Takeaways
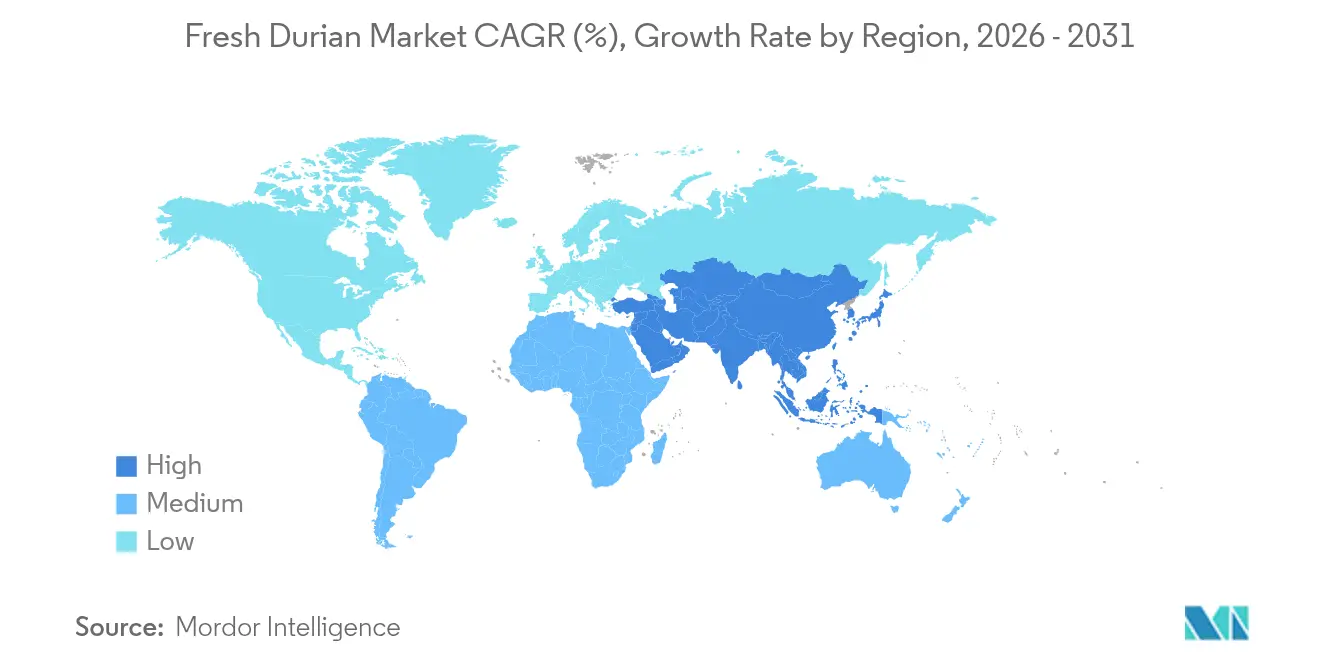
- By geography, Asia-Pacific accounted for the largest fresh durian market share in 2025, at 79.6%, while the Middle East is forecast to grow at a CAGR of 6.5% from 2026 to 2031, making it the fastest-growing region.
Note: Market size and forecast figures in this report are generated using Mordor Intelligence’s proprietary estimation framework, updated with the latest available data and insights as of 2026.
Market Trends and Insights
Drivers Impact Analysis of Fresh Durian Market*
| Driver | (~) % Impact on CAGR Forecast | Geographic Relevance | Impact Timeline |
|---|---|---|---|
| Demand surge for premium-grade fruit in China and Singapore | +2.8% | Asia-Pacific core, spillover to Middle East luxury retail | Medium term (2-4 years) |
| Expansion of controlled-atmosphere shipping corridors | +1.9% | Southeast Asia to China and Middle East lanes | Short term (≤ 2 years) |
| Subsidized re-planting programs in Thailand, Malaysia, and Vietnam | +1.4% | Thailand, Malaysia, Vietnam | Long term (≥ 4 years) |
| Roll-out of cold-resistant cultivars for subtropical latitudes | +1.2% | Southern China, northern Vietnam, Taiwan trials | Long term (≥ 4 years) |
| Orchard-backed tokenized investment funds crowd-funding acreage | +0.9% | Malaysia, Thailand, Vietnam | Medium term (2-4 years) |
| Blockchain-enabled provenance premiums in luxury retail | +1.3% | China tier-1 cities, Singapore, United Arab Emirates | Short term (≤ 2 years) |
| Source: Mordor Intelligence | |||
Demand Surge for Premium-Grade Fruit in China and Singapore
High-income consumers in Shanghai and Shenzhen paid above USD 15 per kilogram for Musang King during 2025, encouraging Malaysian orchards to secure geographical indication tags and post-harvest quality controls[1]Source: Department of Agriculture Malaysia, “Musang King Export Note 2025,” doa.gov.my. Singapore’s role as a re-export hub magnifies this pull, routing certified fruit to Hong Kong and Japan at stable premiums. Aroma profiling research links specific sulfur compounds to perceived quality, giving exporters scientific tools for consistent grading. The resulting willingness to pay premium prices reduces the market’s exposure to bulk-commodity swings, opens niche digital channels, and allows small orchards to monetize meticulous cultivation practices. In turn, local government programs begin subsidizing post-harvest cold-chain upgrades, further supporting premium segments. As a result, premiumization continues to elevate average unit values within the fresh durian market.
Expansion of Controlled-Atmosphere Shipping Corridors
Maersk introduced low-oxygen, high-carbon-dioxide reefers in 2024 that slashed spoilage on Thailand-China routes by 30% and extended shelf life by roughly one-third. Cryogenic liquid-nitrogen freezing at minus 80 to minus 110 degrees Celsius now preserves whole-fruit texture, letting exporters capture up to 80% of fresh-fruit value during off-season months. These logistics advances boost the adoption of durian commodity market innovations in West Asia and Europe. These logistics improvements can reduce the impact of seasonal supply concentration by extending commercially viable shipping windows.
Subsidized Re-Planting Programs in Thailand, Malaysia, and Vietnam
Southeast Asian governments recognize durian as a significant cash crop. Vietnam's Directive 71 requires adherence to good agricultural practice (GAP) audits and provides low-interest loans for drip irrigation, aiming to achieve yields of 7 metric tons per hectare by 2030. This policy addresses quality inconsistencies, ensuring the export of compliant, high-quality fruit to markets such as China. Vietnam overshot its 2030 durian acreage target five years early, reaching 150,000 hectares in 2025 and triggering price swings that dropped Grade A fruit from VND 200,000 to VND 30,000 per kilogram (USD 7.70 to USD 1.15) within weeks. Subsidies invite a three-to-five-year lag before new trees bear fruit, rewarding first movers and pressuring late entrants as supply floods in 2028 and beyond.
Orchard-Backed Tokenized Investment Funds Crowd-Funding Acreage
Harvest Ville fractionalizes orchard ownership through blockchain tokens that represent land parcels and harvest rights, bringing urban capital to smallholders who lack bank credit. Tokens offer exposure to a commodity that generated 15-20% yearly returns between 2020 and 2024, yet secondary markets remain thin, limiting liquidity. Regulatory agencies in Malaysia and Thailand have not clarified whether these tokens are securities, leaving investors with disclosure risk. Concentrating portfolios in a single cultivar could amplify downside if Musang King premiums erode once Vietnam’s plantings mature.
Restraints Impact Analysis of Fresh Durian Market*
| Restraint | (~) % Impact on CAGR Forecast | Geographic Relevance | Impact Timeline |
|---|---|---|---|
| Stricter maximum residue limits in China, European Union, and United States | -1.6% | Thailand, Vietnam, Malaysia exports | Short term (≤ 2 years) |
| Climate-driven pollination failures and yield swings | -1.3% | Equatorial Southeast Asia | Medium term (2-4 years) |
| High farm-gate price volatility discouraging long-term contracts | -0.9% | Vietnam, Thailand, Malaysia | Short term (≤ 2 years) |
| Structural labor shortage and rising orchard wages | -0.7% | Malaysia, Thailand, Vietnam | Long term (≥ 4 years) |
| Source: Mordor Intelligence | |||
Stricter Maximum Residue Limits in China, European Union, and United States
Since Vietnam began officially exporting durians in September 2022, China has rejected 30 shipments due to cadmium contamination. These rejections account for only 0.01% of the total durian exports to China. China’s customs authority now mandates cadmium and Auramine O tests on every shipment after carcinogenic dye was detected in Thai fruit. The rule immediately reduced Vietnamese exports by 80% in February 2025, exposing smallholders who could not fund certified labs. The European Union has announced that it will no longer allow the sale of the commonly used insecticide active ingredients, chlorpyrifos and chlorpyrifos-methyl. Singapore’s Food Agency imposes similar thresholds, triggering costly recall risks for non-compliant lots. Compliance investment lifts entry barriers and favors large integrated estates, but it also cuts contamination incidents and preserves consumer trust in the fresh durian market.
Climate-Driven Pollination Failures and Yield Swings
The 2024 El Niño heatwave cracked skins and dried fibers across Thailand, trimming export volume substantially and forcing emergency imports of Vietnamese fruit to meet domestic tourist demand. Malaysia experienced 10-30% tree losses from canker outbreaks and humidity-linked flower abortion, reducing farmer revenue by as much as 80% in affected blocks. Studies submitted to the Food and Agriculture Organization show night temperatures above 24 degrees Celsius cut fruit set by 25% and are now occurring 40-plus nights a year compared with 15 historically. Saltwater intrusion in Vietnam’s Mekong Delta threatens 20,000 hectares within three years as upstream dams shrink freshwater flows, elevating soil salinity and curbing yields by up to 40%.
*Our forecasts treat driver/restraint impacts as directional, not additive. The impact forecasts reflect baseline growth, mix effects, and variable interactions.
Geography Analysis
APAC Fresh Durian Market
Asia-Pacific accounted for 79.6% of the fresh durian market share in 2025, making it the largest geographic market. Vietnam's significant share of China's arrivals highlights the effectiveness of two-day land-sea corridors in maintaining product quality, outperforming Thailand's longer shipments and reducing Bangkok suppliers' market share. Thailand's market presence faced challenges due to stricter entry conditions following contamination incidents. Malaysia leveraged premium products and efficient cross-border road connections to southern China to strengthen its position.
MEA and APAC Fresh Durian Market
The Middle East is forecast to grow at a CAGR of 6.5% from 2026 to 2031, the fastest among regions, driven by rising consumption in the United Arab Emirates due to the growing Asian expatriate population and the availability of halal-certified products in premium grocery chains [2]Source: Dubai Customs, “Agri-Import Statistics 2026,” dubaicustoms.gov.ae. Saudi Arabia's food-security agenda has increased the number of import permits, supporting significant annual growth. Dedicated freighters facilitate weekly shipments of Musang King durians during the peak Ramadan gift season. Additionally, smaller Gulf states re-export products through Dubai’s Jebel Ali port to regions such as East Africa and Central Asia.
The Americas, Europe and Africa Fresh Durian Market
North America is experiencing growth due to demand from diaspora communities and the increasing availability of freeze-dried snacks in mainstream retail stores. Europe is also growing, although new residue-limit regulations may restrict supply unless exporters adopt biological control measures. South America and Africa are nearing double-digit growth rates, supported by investments from stakeholders in countries such as Brazil, Ecuador, South Africa, and Kenya, which are creating niche distribution channels.


Regulatory Landscape
Market access for fresh durian is shaped by sanitary and phytosanitary (SPS) protocols that tie export eligibility to orchard and packing-house registration and approval lists, most critically under China’s General Administration of Customs (GACC). China’s tightening of import controls since early 2025, including mandatory testing for contaminants such as cadmium and Auramine O, has raised compliance costs and increased the risk of shipment rejection for suppliers that cannot document traceability and lab testing through the full chain.
Across key origins, governments have moved toward standardized, auditable controls at pre-export nodes. Thailand’s National Bureau of Agricultural Commodity and Food Standards (ACFS) made TAS 9070-2023 mandatory in 2025 for good practices in inspection and receiving at collection and packing houses, reinforcing consolidation around certified facilities. Vietnam’s Ministry of Agriculture and Environment issued Decision No. 3015/QD-BNNMT in August 2025 to standardize food-safety control procedures for exported fresh durian nationwide, while Malaysia’s China-facing trade is governed by GACC phytosanitary requirements formalized through its Malaysia-China protocol framework and facility listing mechanisms.
Value Chain Analysis
The fresh durian value chain runs from input suppliers and orchard operators to collectors, collection centers, packing houses, transporters, exporters, importers and wholesalers, and retail channels, including e-commerce and premium grocery. Value creation concentrates at post-harvest steps, where maturity selection, sorting and grading, phytosanitary documentation, and cold-chain handling determine whether fruit qualifies for premium lanes such as China and Singapore. Integrated players with packing, cold storage, and export documentation capability, including large estate-linked shippers and cold-chain operators, gain leverage over fragmented farm supply by aggregating compliant volumes and reducing spoilage.
Bottlenecks sit at harvest-to-border timing and inspection capacity. With a short usable window and inspection-heavy routes, pre-cooling, controlled-atmosphere logistics, and fast customs clearance become decisive. Containers, trailers, and plant-quarantine officers at checkpoints can also constrain throughput during peak harvests. Bilateral operational fixes are increasingly part of chain design, including the May 2025 Vietnam Ministry of Agriculture and Environment and GACC agreement to establish a green lane to accelerate agricultural clearance at border gates. Weather-driven supply shocks propagate quickly through the chain, tightening availability for exporters and retailers when flowering and fruit set are disrupted.
Competitive Landscape
The durian market remains fragmented, with the top companies holding significant shares in 2025. Charoen Pokphand Foods leads the market, supported by integrated cold storage facilities ensuring a consistent supply to buyers[3]Source: Charoen Pokphand Foods, “Company Overview,” cpfworldwide.com . Sunshine International follows, driven by its strong presence in wholesale clusters and its strategy of repackaging durians to meet size preferences in various cities. Malaysia-based companies, Top Fruits and Benum Hill Fruits, specialize in Musang King durians with complete orchard-to-market control.
Competition in the durian market increasingly revolves around traceability. Serialized identifiers have significantly reduced tracking time and provided price advantages for compliant suppliers. Advanced QR code technology enables consumers to verify product origins, pushing suppliers to upgrade their digital infrastructure. Tokenized acreage concepts are lowering entry barriers for smallholders and attracting fresh capital into mechanization. Tech-ready orchards are also exploring integration with carbon-credit revenue, hinting at future growth opportunities.
The approval of new origins for fresh durian exports is anticipated to impact the market by diluting volume shares and intensifying price competition. Rising demand in alternative regions offers new opportunities, though regulatory harmonization may limit access to premium markets. Cryogenic freezing infrastructure is becoming a critical factor, enabling access to distant markets without reliance on costly airfreight. As margins tighten for commodity-grade fruit, cultivar innovation and direct-to-consumer e-commerce are likely to shape the future of the market.
Market Opportunities and Future Outlook
Compliance-led segmentation is opening space for service providers and exporters that can industrialize testing, documentation, and traceability at scale. China’s tighter SPS regime and audit trails, including contaminant testing and facility eligibility tied to registration lists, create demand for certified packing-house capacity, third-party labs, and digital documentation flows that keep consignments moving while reducing rejection risk. Vietnam’s move to standardized export food-safety control procedures, Decision No. 3015/QD-BNNMT in August 2025, reinforces a market for compliant aggregation models that bring smallholder output into auditable export streams.
Logistics modernization and alternative corridors are expanding addressable premium markets for fresh fruit beyond traditional airfreight lanes. Evidence of throughput and infrastructure focus includes Nansha Port customs handling more than 9,500 tonnes of fresh durians in the first half of April 2026, and specialized cold-chain capacity being added to rail corridors, including the deployment of 500 refrigerated containers on the China-Laos Railway with real-time temperature and humidity monitoring (May 2026). Producer-side positioning is also shifting toward brand and quality differentiation, highlighted by Thailand’s 1H 2026 exports to China of 872,237 tonnes valued at THB 100.08 billion and Vietnam’s July 2026 efforts on quality, standardization, and branding rather than volume competition.
Recent Industry Developments in Fresh Durian Market
- July 2026: AGONG Durian (Synagistics Limited) launched an AI-powered, blockchain-traced durian brand in Singapore to authenticate Musang King provenance. The move reinforces premiumization and traceability as competitive levers in fresh durian retail, and it sets a platform path for instant-commerce distribution into China.
- April 2026: JD Fresh opened the Thai durian season with CP Fresh and introduced a Guaranteed 5-Lobe quality benchmark for Monthong durians. By formalizing a measurable quality promise in e-commerce, the initiative raises the bar for grading and post-harvest handling standards across supplying packers and exporters.
- August 2024: Malaysia began shipping fresh durians to China following the opening of the China market under the Malaysia-China phytosanitary protocol framework. This marked a step-change from Malaysia’s prior reliance on frozen formats for China and accelerated investment needs in compliant packing, documentation, and cold-chain execution for fresh exports.


Fresh Durian Market Report Scope and Research Methodology
Market Definition and Coverage
In this study, we define the fresh durian market as the revenue generated from whole, fresh durian fruit sold through organized and traditional trade, including domestic sales and cross-border shipments, valued at prevailing wholesale and export price points.
Scope exclusions: We exclude frozen durian, durian pulp/paste, confectionery, and other processed durian products, even if they use fresh fruit as an input.
Segments Covered in This Report
- By Geography
- North America
- United States
- Production Analysis (Production Volume)
- Consumption Analysis (Consumption Value and Volume)
- Import Market Analysis (Import Value, Volume, and Key Supplying Markets)
- Export Market Analysis (Export Value, Volume, and Key Destination Markets)
- Wholesale Price Trend Analysis and Forecast
- Regulatory Framework
- List of Key Players
- Logistics and Infrastructure
- Seasonality Analysis
- Canada
- Production Analysis (Production Volume)
- Consumption Analysis (Consumption Value and Volume)
- Import Market Analysis (Import Value, Volume, and Key Supplying Markets)
- Export Market Analysis (Export Value, Volume, and Key Destination Markets)
- Wholesale Price Trend Analysis and Forecast
- Regulatory Framework
- List of Key Players
- Logistics and Infrastructure
- Seasonality Analysis
- United States
- South America
- Brazil
- Production Analysis (Production Volume)
- Consumption Analysis (Consumption Value and Volume)
- Import Market Analysis (Import Value, Volume, and Key Supplying Markets)
- Export Market Analysis (Export Value, Volume, and Key Destination Markets)
- Wholesale Price Trend Analysis and Forecast
- Regulatory Framework
- List of Key Players
- Logistics and Infrastructure
- Seasonality Analysis
- Colombia
- Production Analysis (Production Volume)
- Consumption Analysis (Consumption Value and Volume)
- Import Market Analysis (Import Value, Volume, and Key Supplying Markets)
- Export Market Analysis (Export Value, Volume, and Key Destination Markets)
- Wholesale Price Trend Analysis and Forecast
- Regulatory Framework
- List of Key Players
- Logistics and Infrastructure
- Seasonality Analysis
- Brazil
- Europe
- Netherlands
- Production Analysis (Production Volume)
- Consumption Analysis (Consumption Value and Volume)
- Import Market Analysis (Import Value, Volume, and Key Supplying Markets)
- Export Market Analysis (Export Value, Volume, and Key Destination Markets)
- Wholesale Price Trend Analysis and Forecast
- Regulatory Framework
- List of Key Players
- Logistics and Infrastructure
- Seasonality Analysis
- France
- Production Analysis (Production Volume)
- Consumption Analysis (Consumption Value and Volume)
- Import Market Analysis (Import Value, Volume, and Key Supplying Markets)
- Export Market Analysis (Export Value, Volume, and Key Destination Markets)
- Wholesale Price Trend Analysis and Forecast
- Regulatory Framework
- List of Key Players
- Logistics and Infrastructure
- Seasonality Analysis
- United Kingdom
- Production Analysis (Production Volume)
- Consumption Analysis (Consumption Value and Volume)
- Import Market Analysis (Import Value, Volume, and Key Supplying Markets)
- Export Market Analysis (Export Value, Volume, and Key Destination Markets)
- Wholesale Price Trend Analysis and Forecast
- Regulatory Framework
- List of Key Players
- Logistics and Infrastructure
- Seasonality Analysis
- Germany
- Production Analysis (Production Volume)
- Consumption Analysis (Consumption Value and Volume)
- Import Market Analysis (Import Value, Volume, and Key Supplying Markets)
- Export Market Analysis (Export Value, Volume, and Key Destination Markets)
- Wholesale Price Trend Analysis and Forecast
- Regulatory Framework
- List of Key Players
- Logistics and Infrastructure
- Seasonality Analysis
- Netherlands
- Asia-Pacific
- China
- Production Analysis (Production Volume)
- Consumption Analysis (Consumption Value and Volume)
- Import Market Analysis (Import Value, Volume, and Key Supplying Markets)
- Export Market Analysis (Export Value, Volume, and Key Destination Markets)
- Wholesale Price Trend Analysis and Forecast
- Regulatory Framework
- List of Key Players
- Logistics and Infrastructure
- Seasonality Analysis
- Malaysia
- Production Analysis (Production Volume)
- Consumption Analysis (Consumption Value and Volume)
- Import Market Analysis (Import Value, Volume, and Key Supplying Markets)
- Export Market Analysis (Export Value, Volume, and Key Destination Markets)
- Wholesale Price Trend Analysis and Forecast
- Regulatory Framework
- List of Key Players
- Logistics and Infrastructure
- Seasonality Analysis
- Vietnam
- Production Analysis (Production Volume)
- Consumption Analysis (Consumption Value and Volume)
- Import Market Analysis (Import Value, Volume, and Key Supplying Markets)
- Export Market Analysis (Export Value, Volume, and Key Destination Markets)
- Wholesale Price Trend Analysis and Forecast
- Regulatory Framework
- List of Key Players
- Logistics and Infrastructure
- Seasonality Analysis
- Indonesia
- Production Analysis (Production Volume)
- Consumption Analysis (Consumption Value and Volume)
- Import Market Analysis (Import Value, Volume, and Key Supplying Markets)
- Export Market Analysis (Export Value, Volume, and Key Destination Markets)
- Wholesale Price Trend Analysis and Forecast
- Regulatory Framework
- List of Key Players
- Logistics and Infrastructure
- Seasonality Analysis
- Thailand
- Production Analysis (Production Volume)
- Consumption Analysis (Consumption Value and Volume)
- Import Market Analysis (Import Value, Volume, and Key Supplying Markets)
- Export Market Analysis (Export Value, Volume, and Key Destination Markets)
- Wholesale Price Trend Analysis and Forecast
- Regulatory Framework
- List of Key Players
- Logistics and Infrastructure
- Seasonality Analysis
- China
- Middle East
- Saudi Arabia
- Production Analysis (Production Volume)
- Consumption Analysis (Consumption Value and Volume)
- Import Market Analysis (Import Value, Volume, and Key Supplying Markets)
- Export Market Analysis (Export Value, Volume, and Key Destination Markets)
- Wholesale Price Trend Analysis and Forecast
- Regulatory Framework
- List of Key Players
- Logistics and Infrastructure
- Seasonality Analysis
- United Arab Emirates
- Production Analysis (Production Volume)
- Consumption Analysis (Consumption Value and Volume)
- Import Market Analysis (Import Value, Volume, and Key Supplying Markets)
- Export Market Analysis (Export Value, Volume, and Key Destination Markets)
- Wholesale Price Trend Analysis and Forecast
- Regulatory Framework
- List of Key Players
- Logistics and Infrastructure
- Seasonality Analysis
- Saudi Arabia
- Africa
- South Africa
- Production Analysis (Production Volume)
- Consumption Analysis (Consumption Value and Volume)
- Import Market Analysis (Import Value, Volume, and Key Supplying Markets)
- Export Market Analysis (Export Value, Volume, and Key Destination Markets)
- Wholesale Price Trend Analysis and Forecast
- Regulatory Framework
- List of Key Players
- Logistics and Infrastructure
- Seasonality Analysis
- Kenya
- Production Analysis (Production Volume)
- Consumption Analysis (Consumption Value and Volume)
- Import Market Analysis (Import Value, Volume, and Key Supplying Markets)
- Export Market Analysis (Export Value, Volume, and Key Destination Markets)
- Wholesale Price Trend Analysis and Forecast
- Regulatory Framework
- List of Key Players
- Logistics and Infrastructure
- Seasonality Analysis
- South Africa
- North America
Data Sources, Market Sizing, and Validation
Desk Research
Desk work starts by mapping supply and demand signals that can be checked repeatedly over time. We rely on public agriculture and trade series to anchor the model, such as FAOSTAT for production context, ITC Trade Map and UN Comtrade for import and export value and volume, and official customs and agriculture ministry releases in major producing and importing economies.
To avoid building the market on one single data stream, price context is also reviewed using government market price bulletins, food and agriculture statistical yearbooks, and published phytosanitary and residue compliance updates that can change trade flows. Company filings, investor presentations, and association websites help us understand cold chain build-out, packhouse capacity, and shipment seasonality. Where needed, we also use paid subscriptions for company financials and intelligence, shipment-level import and export records, and a patent database to track post-harvest handling and packaging activity. These examples are not exhaustive, and many other sources were consulted for data collection, validation, and clarification.
Primary Interviews and Surveys
Primary work is used to pressure-test the desk assumptions and to fill gaps that public data does not explain well, like grade mix shifts, average realized export pricing, and loss rates along cold chains. We speak with growers, aggregators, exporters, importers, wholesalers, and modern retailers across key producing belts and major import hubs so the model reflects practical trade behavior rather than only reported totals.
Distribution of primary research fieldwork respondents
| Company type | Respondent position | Region |
|---|---|---|
| Top tier: 25% | CXOs: 12% | APAC: 46% |
| Mid tier: 56% | Functional/Unit leaders: 35% | EMEA: 35% |
| Smaller Players: 19% | Managers: 53% | Americas: 19% |
Market-Sizing & Forecasting
Sizing starts with a top-down reconstruction of the value pool using production and trade data, and then converting relevant volumes into value using observed price series. For each key corridor, we align import volumes, export volumes, and domestic availability, then apply market-level pricing that reflects seasonality, quality grade mix, and typical handling costs before the fruit reaches wholesale.
Several market fingerprints are used as inputs and checks, including harvested area and yield direction in producing countries, import volumes into China and other fast-growing markets, average export unit values by origin, cold chain and packhouse expansion signals, and the share of air versus sea freight in peak seasons. Forecasts are developed using scenario analysis that links demand growth to income and population trends in importing markets, and supply growth to acreage, yield improvements, and weather-related downside risk. The totals are corroborated with selective bottom-up approximations, such as sampled price times volume checks in key wholesale markets and exporter shipment roll-ups, with gaps handled by conservative interpolation when reliable corridor data is temporarily missing.
Data Validation & Update Cycle
Validation is done in steps so outliers are caught early and assumptions are not carried forward without review. We compare modeled values against independent signals like trade balances, unit value movements, and known seasonality peaks, then recheck unusual jumps back to the source tables and interview notes.
Before sign-off, the work is reviewed across the team with variance explanations documented, and follow-up calls are triggered when a corridor or price series breaks its normal pattern. Reports are refreshed annually, with interim updates when material events occur, such as policy changes, residue enforcement shifts, or severe weather impacts. Right before delivery, an analyst runs a final pass so clients receive the most current view.
Mordor Intelligence's Fresh Durian Market Size Compared With Other Published Estimates
Published numbers for fresh durian do not always line up because the market boundary is set differently, and because the same trade flow can be counted in more than one place if the steps are not clearly defined. Differences also come from how each estimate treats pricing, seasonality, and the year used for currency conversion.
Import and export volumes by corridor, paired with observed export unit values and wholesale price checks, are the evidence that ties Mordor Intelligence's estimate to the tradable fresh-fruit demand pool rather than a broader durian universe that can include processed formats.
Benchmark comparison
| Source | Market Size | Gaps in Research Methodology |
|---|---|---|
| Mordor Intelligence | USD 5.60 B (2025) | |
| Industry Publisher A | USD 8.30 B (2025) | This figure appears to use a wider product boundary that can pull in non-fresh durian forms and a broader retail value framing, which lifts the total above a fresh-fruit, trade-aligned value pool. |
| Market Intelligence B | USD 1.81 B (2025) | This estimate likely applies a narrower definition, such as counting only a limited set of commercial channels or reported trade value without capturing domestic fresh consumption, which can push the total downward. |
The spread mainly reflects how each publisher sets the line between fresh fruit versus durian-derived products, and how domestic consumption is treated alongside cross-border shipments. By anchoring the model to observable trade volumes, price series, and seasonality checks, the outcome stays explainable and can be rebuilt when new corridor data becomes available.


Key Questions Answered in the Report
How large is the durian market in 2026?
The fresh durian market size was USD 5.85 billion in 2026 and is forecast to reach USD 7.31 billion by 2031.
Which region accounts for the biggest share of the fresh durian market?
Asia-Pacific accounted for 79.6% of the fresh durian market share in 2025, driven by strong demand for fresh durian imports in China.
Why is Musang King priced higher than other cultivars?
Musang King benefits from Malaysian geographical indication tags and blockchain traceability that lift Guangzhou wholesale prices by about 12% over uncertified fruit.
How are stricter pesticide rules affecting exporters?
China's and Singapore's tighter residue tests increase compliance costs, favoring large integrated estates with certified labs.
Which new supplier entered China in 2025?
Laos received approval in December 2025, adding competitive pressure for Thai, Vietnamese, and Malaysian exporters.
Page last updated on:


 Your data is secure and never sold or shared.


