
Market Overview
| Study Period | 2019 - 2031 |
|---|---|
| Market Size (2026) | USD 9.40 Billion |
| Market Size (2031) | USD 12.11 Billion |
| Growth Rate (2026 - 2031) | 5.20 % |
| Fastest Growing Market | Middle East |
| Largest Market | North America |
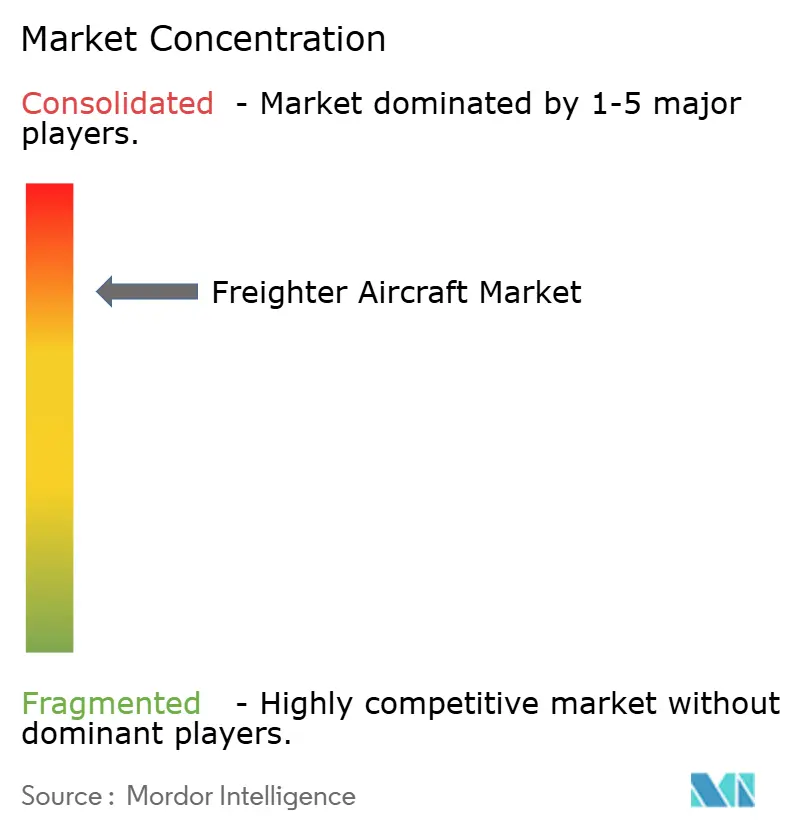
| Market Concentration | High |
Major Players *Disclaimer: Major Players sorted in no particular order Image © Mordor Intelligence. Reuse requires attribution under CC BY 4.0. | |
Freighter Aircraft Market Analysis by Mordor Intelligence
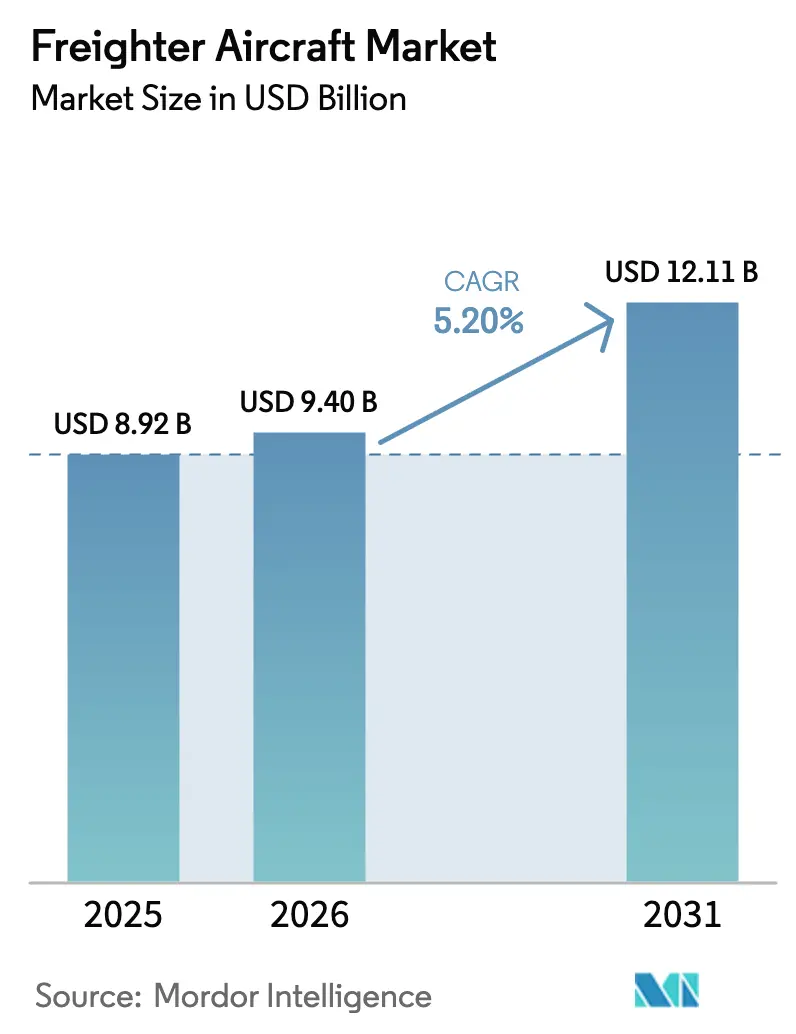
The freighter aircraft market size is expected to grow from USD 8.92 billion in 2025 to USD 9.40 billion in 2026 and is forecasted to reach USD 12.11 billion by 2031 at a 5.20% CAGR over 2026-2031. This trajectory is driven by sustained growth in cross-border e-commerce, the structural contraction of passenger belly-hold capacity, and regulatory pressure that is accelerating fleet renewal. Express parcel volumes now account for as much as one-third of international air-cargo tonnage, prompting integrators to secure dedicated main-deck lift well ahead of seasonal peaks. Operators are also influencing investment decisions due to the International Civil Aviation Organization’s CO₂ standard, effective 2027, and Chapter 14 noise limits, which are phasing out Stage 3 aircraft. At the same time, the European Union Emissions Trading System’s full aviation inclusion from 2026 embeds carbon costs into every trans-Atlantic sector, tilting fleet-planning economics further toward fuel-efficient types. These converging forces underpin the resilient double-digit growth outlook for the freighter aircraft market.
Key Report Takeaways
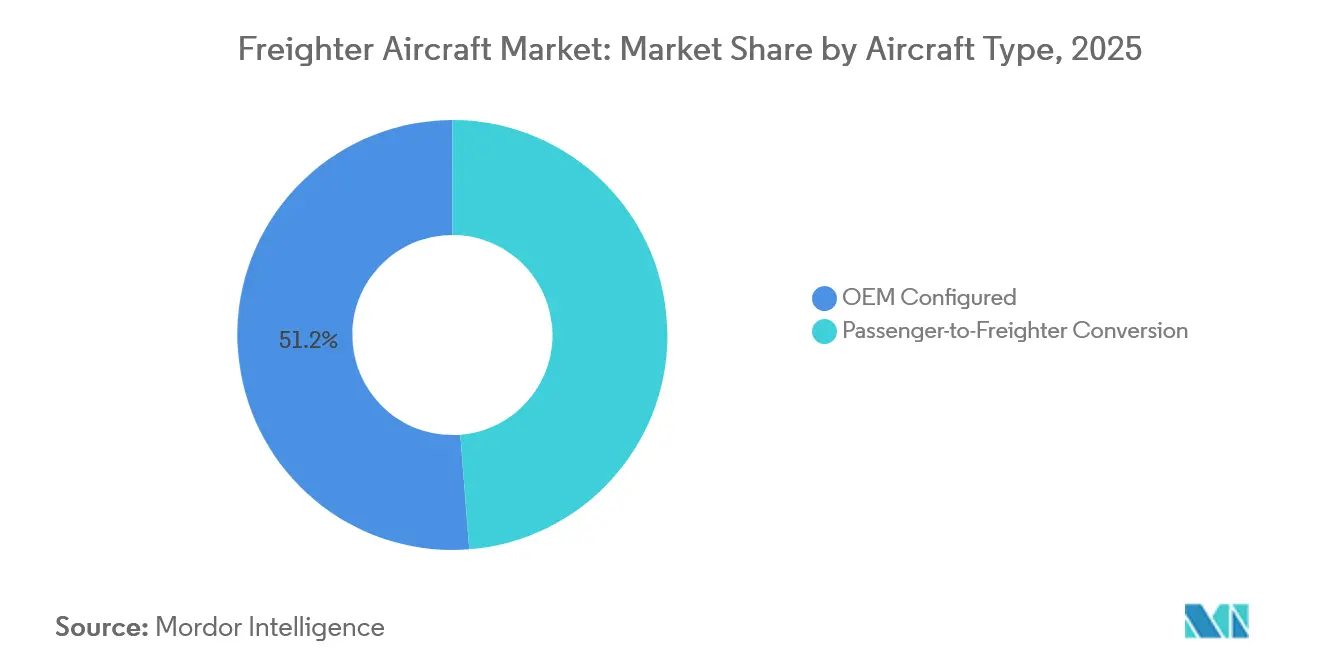
- By aircraft type, passenger-to-freighter conversions expanded at a 5.95% CAGR through 2031 while OEM-configured units held a 51.25% freighter aircraft market share in 2025.
- By payload capacity, medium widebodies captured 41.21% of the freighter aircraft market size in 2025, whereas standard-body aircraft under 45 tonnes are advancing at a 5.76% CAGR.
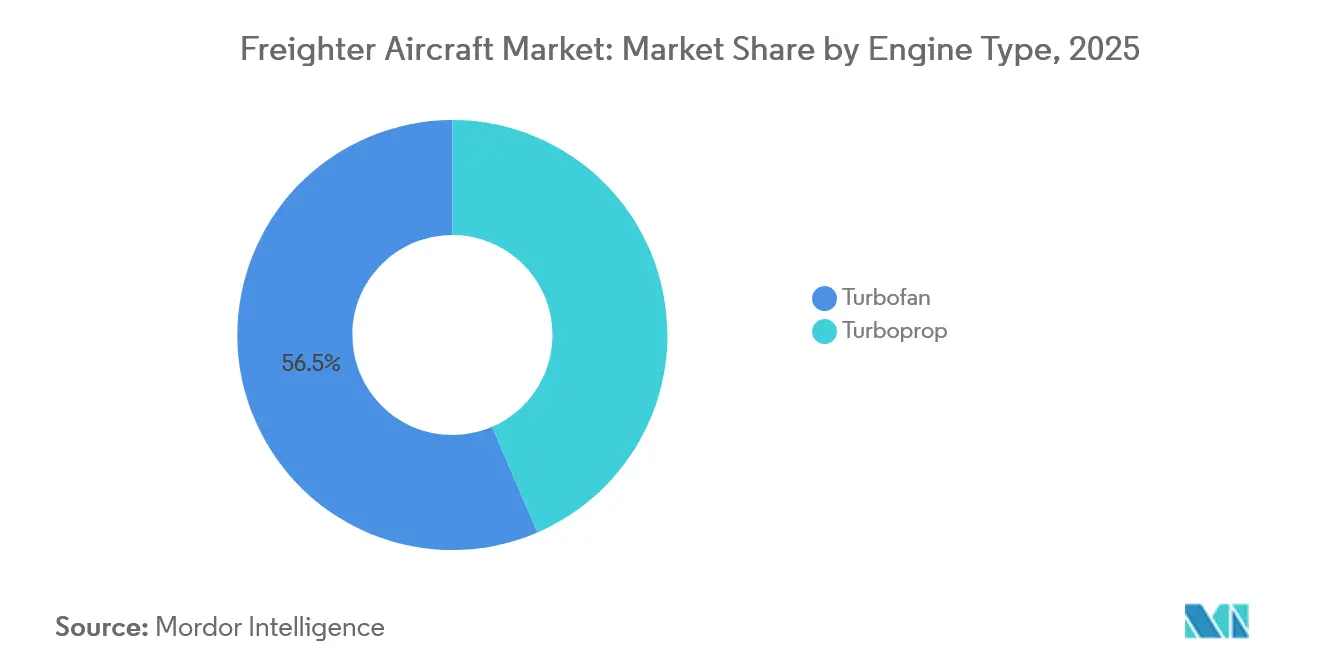
- By engine type, turbofan platforms commanded 56.47% freighter aircraft market share in 2025, with turboprops logging a 6.11% CAGR.
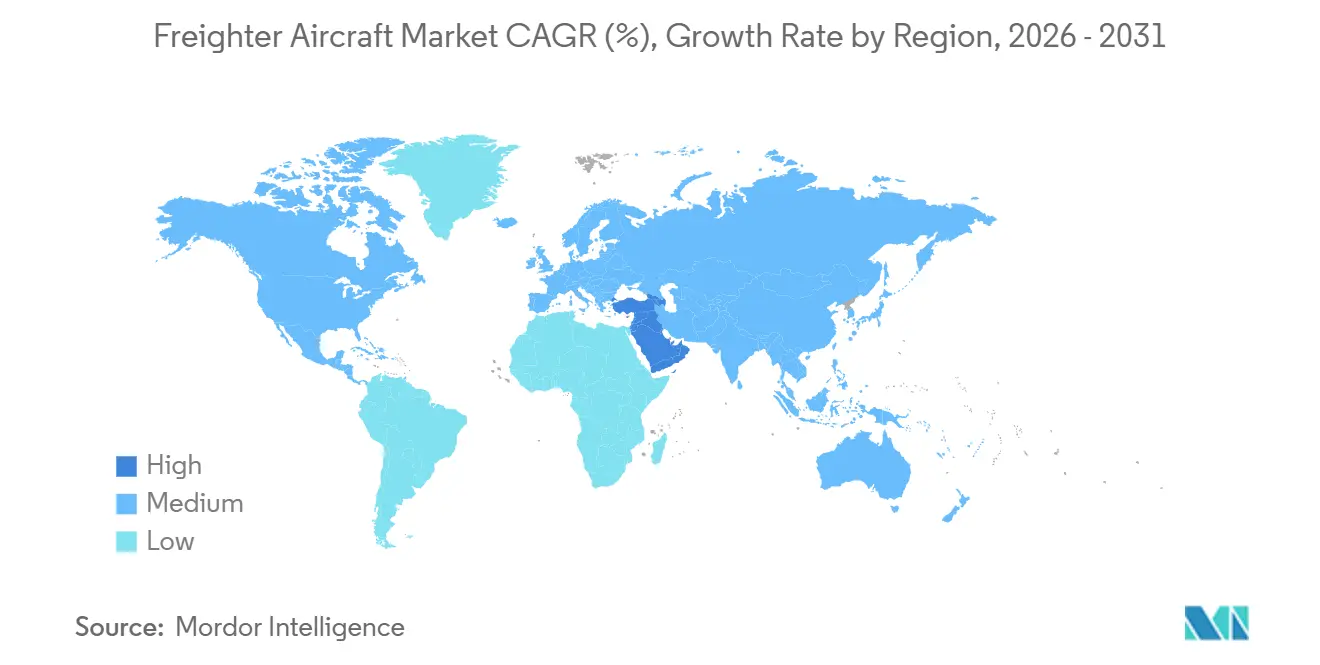
- By geography, North America retained a 46.81% freighter aircraft market share in 2025, while the Middle East is the fastest-growing region, with a 6.23% CAGR.
Note: Market size and forecast figures in this report are generated using Mordor Intelligence’s proprietary estimation framework, updated with the latest available data and insights as of January 2026.
Market Trends and Insights
Drivers Impact Analysis of Freighter Aircraft Market*
| Driver | (~) % Impact on CAGR Forecast | Geographic Relevance | Impact Timeline |
|---|---|---|---|
| E-commerce and express parcel boom | +3.20% | Global, concentrated in North America and Asia-Pacific | Medium term (2-4 years) |
| Fleet renewal to meet ICAO CO₂/noise rules | +2.80% | Global, with Europe and North America most exposed | Long term (≥4 years) |
| Shrinking belly-cargo capacity on airliners | +1.90% | Global, acute on trans-Atlantic and trans-Pacific lanes | Short term (≤2 years) |
| Expanding intra-Asia and trans-Pacific trade | +1.50% | Asia-Pacific core with spill-over to Middle East hubs | Medium term (2-4 years) |
| Special-cargo demand for temp-controlled lift | +0.70% | Global, led by North America and Europe | Long term (≥4 years) |
| Opening of polar ETOPS routes post-2027 | +0.40% | Asia-Europe corridors, secondary effect on Middle East | Long term (≥4 years) |
| Source: Mordor Intelligence | |||
E-commerce and Express Parcel Boom
Cross-border parcel shipments are forecast to rise 12-15% annually to 2028, a pace that obliges integrators to reserve conversion slots three years in advance. Amazon Air’s fleet climbed to 110 aircraft in 2025, and the company secured 20 additional 767-300 conversions to sustain two-day delivery across secondary US cities.[1] Cainiao Logistics ordered 10 converted 777Fs in 2024 to buffer Singles’ Day surges, which can triple daily tonnage, a profile that a belly-hold cannot absorb. Premiums for guaranteed next-day lift now run 15-20% above standard charters, supporting aggressive capital deployment into dedicated freighters even when lease rates tighten.
Fleet Renewal to Meet ICAO CO₂/Noise Rules
ICAO’s CO₂ design standard applies from 2027, while Chapter 14 noise limits that took full effect in 2024 have already excluded older 747-400 and MD-11 freighters from European and Japanese gateways.[2] FedEx retired its final MD-11F in early 2024 and firmed 24 777F deliveries through 2028, citing compliance certainty as the overriding rationale. With OEM order backlogs stretching to 36 months, operators unable to defer decisions beyond 2026 face a shrinking retrofit window that magnifies the tailwind behind the freighter aircraft market.
Shrinking Belly-Cargo Capacity on Passenger Fleets
Permanent 747-400 and A380 retirements eliminated roughly 15% of pre-2020 belly-hold capacity, a gap that narrowbody replacements cannot fill because 737 and A320 lower holds carry a fraction of widebody volume. Forwarders now pay 30-40% higher kilo-rates for what little belly space remains, erasing its historical cost edge over main-deck lift. Boeing’s 2024 Commercial Market Outlook projects that only 85% of lost belly tonnage will return by 2030, securing long-term demand for dedicated freighters.
Expanding Intra-Asia and Trans-Pacific Trade Lanes
Intra-Asia tonnage expanded 8% in 2025, outstripping the global average, as supply-chain diversification toward Vietnam, Thailand, and India required just-in-time component flows. SF Express grew its freighter fleet from 75 to 92 aircraft in one year, deploying 737-800BCFs on dense Shenzhen-Hanoi and Guangzhou-Bangkok corridors. Balanced east-bound and west-bound loads now keep Trans-Pacific utilization above 80%, reinforcing the economic case for medium-widebody freighters.
Restraints Impact Analysis of Freighter Aircraft Market*
| Restraint | (~) % Impact on CAGR Forecast | Geographic Relevance | Impact Timeline |
|---|---|---|---|
| Fuel-price and carbon-price volatility | -1.8% | Global, most acute in Europe due to EU-ETS | Short term (≤2 years) |
| Tightening environmental compliance cost (EU-ETS) | -1.4% | Europe plus global CORSIA routes | Medium term (2-4 years) |
| Passenger-aircraft feedstock shortage for P2F slots | -0.9% | Global, narrowbody segment most exposed | Medium term (2-4 years) |
| Slot and runway congestion at cargo mega-hubs | -0.6% | Asia-Pacific (HKG, PVG), North America (MEM, ANC) | Short term (≤2 years) |
| Source: Mordor Intelligence | |||
Fuel-Price and Carbon-Price Volatility
Jet-fuel averaged between USD 2.50 and USD 3.50 per gallon in 2025; every USD 0.50 swing adds roughly USD 150,000 in annual fuel spend per 777F, compressing margins that average 8-12%.[3] Carbon allowances under the EU-ETS traded at EUR 60-80 (USD 69.8-93.07) per tonne in 2025, translating to EUR 8,000-10,000 (USD 9,306.72-11,633.4) for a single trans-Atlantic 777F leg. Smaller cargo carriers lack the balance-sheet strength to hedge both fuel and carbon exposure, creating potential capacity shake-outs during price spikes.
Tightening Environmental Compliance Costs (EU-ETS, CORSIA)
The Carbon Offsetting and Reduction Scheme for International Aviation transitions from a pilot to a mandatory phase in 2027, obliging airlines to offset emissions growth above 2019 levels. Credit prices ranged from USD 15 to 25 per tonne in 2025 and are expected to escalate as aviation demand for high-quality offsets rises. Administrative overhead linked to monitoring, reporting, and verification further adds to carriers’ fixed cost base, accelerating consolidation toward well-capitalized incumbents.
*Our forecasts treat driver/restraint impacts as directional, not additive. The impact forecasts reflect baseline growth, mix effects, and variable interactions.
Freighter Aircraft Market Segment Analysis
By Aircraft Type:
Conversions Counter High Capital CostsPassenger-to-freighter conversions are forecast to expand at a 5.95% CAGR to 2031, eclipsing OEM builds even as factory freighters controlled 51.25% of the 2025 freighter aircraft market share. Operators drawn to conversions cite capital expenditures (capex) savings: a 15-year-old 767-300ER converted for USD 22 million, versus a USD 220 million list price for a 777F, enabling capacity additions without 20-year debt loads. Israel Aerospace Industries launched its 777-300ER Special Freighter in 2024 and had 23 commitments by mid-2025, targeting the 80-90 tonne slot not served by the 767F or factory-built 777F.[4] ST Engineering’s A321P2F, certified in 2024, offers 28 tonnes of lift and a containerized main deck, bringing widebody-like loading efficiency into short-haul express networks.
OEM freighters nonetheless retain structural advantages. A new 777-8F will burn 15% less fuel per tonne-kilometer than a converted 777-300ER and is immediately compliant with 2027 ICAO standards. Airbus handed over eight A350Fs in 2025, with Lufthansa Cargo and Singapore Airlines among launch customers that prioritize residual value and unrestricted airport access. Lead-time risk, however, keeps conversions attractive for operators that must respond within 18-24 months to e-commerce surges, insulating the secondary market from OEM competition and cementing its role in the freighter aircraft market.
By Payload Capacity:
Standard-Body Upswing in Last-Mile NetworksStandard-body aircraft under 45 tonnes are logging the fastest growth at 5.76% CAGR as Amazon Air, DHL, and regional integrators saturate next-day networks with 737-800BCFs and A321P2Fs. These types bridge airports that require 8-12 daily departures, instead of one high-capacity widebody, thereby boosting schedule granularity that e-commerce shippers prize. The freighter aircraft market size for standard-body units is expected to rise from USD 2.4 billion in 2026 to USD 4.1 billion by 2031. Medium-widebodies in the 40-80 tonne band held 41.21% of the freighter aircraft market share in 2025, with the 767-300F entrenched as the sector's workhorse. FedEx operates 120 units alone and plans service life extensions to 2035, despite a higher fuel burn compared to newer models.
Large widebodies above 80 tonnes, dominated by 777Fs and legacy 747-8Fs, face a transitional gap until Boeing’s 777-8F enters service in 2028. Charter rates for the segment rose 20% in 2025 as the 747-8F exited production and its operators deferred replacement decisions. Ethiopian Cargo added two ATR 72-600Fs in 2025 to serve Nairobi, Kigali, and Dar es Salaam, illustrating the type’s role on thin African lanes.
By Engine Type:
Turbofan Dominance, Turboprop Niche GrowthTurbofan engines retained a commanding 56.47% slice of the 2025 freighter aircraft market share, a position sustained by fuel-efficient twin-engine widebodies such as the 777F and A350F that burn less than 0.50 lb of fuel per pound of thrust per hour and can fly 9,000-kilometre missions without payload penalties. Airlines that operate both passenger and cargo variants of these types consolidate spare parts pools and line maintenance crews, cutting unit maintenance costs by as much as 10%, an advantage turboprops cannot replicate.
Even so, turboprops are expected to expand at a 6.11% CAGR through 2031, as they excel in short-haul sectors or at airports with limited runway length or ground infrastructure. FedEx Feeder already deploys 240 ATR and Cessna turboprops to connect 120 US cities to its Memphis super-hub, offering frequency and slot flexibility that jets would oversupply. Annual production remains modest; ATR rolls out only 40-50 freighter units, but each airframe quickly finds a home in Southeast Asia, the Caribbean, or Central Africa, regions where Chapter 14-compliant noise footprints and short-field performance outweigh the speed premium of turbofans.
Geography Analysis
North America Freighter Aircraft Market
North America’s freighter aircraft market size was USD 4.4 billion in 2026, accounting for 46.81% of the global value, as e-commerce penetration is expected to reach 30% of US retail sales by 2031. FedEx’s Memphis super-hub processes 500,000 packages per hour at peak, while UPS’s Louisville complex tops 400,000; these volumes underpin sustained demand for widebody lift. Canada’s Cargojet added three 767-300Fs in 2025 and renewed a long-term capacity-purchase agreement with Amazon Canada, reflecting continued strength in domestic overnight parcels.
Middle East Freighter Aircraft Market
The Middle East is the fastest-growing region, with a 6.23% CAGR. Emirates SkyCargo is committed to delivering five additional 777Fs through 2027, which will raise its total fleet to 16 and reinforce Dubai’s role as a sixth-freedom bridge between Asia and Europe. Qatar Airways Cargo operates 28 freighters, including two 747-8Fs dedicated to handling outsized loads, such as oil-field equipment, which leverage Doha’s uncongested nighttime slots. Etihad Cargo remains a minor player but is retrofitting A350Fs with active cooling units to target pharmaceuticals, adding competitive depth to the regional landscape.
APAC Freighter Aircraft Market
Asia-Pacific demand is accelerating, driven by supply-chain shifts and intra-regional e-commerce, which is pledging 48-hour delivery. SF Express plans to grow its fleet to 92 units by the end of 2025 and has reserved 15 additional 737-800BCF slots for 2026-2027. Singapore Airlines Cargo, an early A350F operator, is redeploying 777Fs to Australia and India, optimizing aircraft gauge to lane density. Airport constraints in Hong Kong and Shanghai are steering incremental frequencies toward secondary hubs, such as Shenzhen and Phnom Penh, thereby diversifying the capacity map.
Europe, LATAM and Africa Freighter Aircraft Market
Europe maintains a stable volume, anchored by Lufthansa Cargo’s Leipzig and Frankfurt operations, as well as DHL’s pan-European network. Slot scarcity at Frankfurt restricts further frequency growth, but fuel-efficient A350Fs allow Lufthansa to up-gauge without breaching local noise quotas. Latin America and Africa remain niche markets, yet LATAM Cargo and Ethiopian Cargo each added two wide-body aircraft in 2025, citing agricultural exports and mining parts as catalysts for dedicated main-deck services. Although their combined market share remains under 5%, these regions provide high-yield backhaul opportunities that improve global network balance.
Regulatory Landscape
Freighter aircraft certification and operations are governed by a mix of airworthiness rules, operational requirements, and safety standards that increasingly converge across jurisdictions. In the United States, FAA certification under 14 CFR Part 25 and the Supplemental Type Certificate (STC) pathway are central to passenger-to-freighter (P2F) programs, and in June 2026 the FAA issued an NPRM (Docket No. FAA-2026-0430) to modernize transport category airplane and propulsion certification standards and further harmonize with EASA CS-25. In Europe, EASA applies certification specifications and supplemental airworthiness requirements (including Part-26 Additional Airworthiness Specifications), while the United Kingdom continues to apply its Air Navigation Order 2016 framework through the UK CAA.
Safety and dangerous-goods compliance remain key for freighter operations under ICAO SARPs. ICAO Annex 6 Part I requires operators to conduct cargo-compartment safety risk assessments, supported by guidance such as ICAO Doc 10102, while ICAO Doc 9284 (Technical Instructions for the Safe Transport of Dangerous Goods by Air) remains the core global standard and was updated for the 2025-2026 cycle via Corrigendum No. 2 issued in May 2026. Environmental compliance pressure in the report context also continues to shape fleet planning, with ICAO CO2 standards effective from 2027 and Chapter 14 noise limits already constraining older aircraft access at noise-sensitive gateways.
Value Chain Analysis
The freighter aircraft value chain covers OEM design and final assembly (factory freighters), the P2F ecosystem (feedstock sourcing, engineering/STC development, conversion MRO, and parts provisioning), and downstream operations (leasing, flight operations, line maintenance, and cargo handling at hubs). Boeing and Airbus lead new-build supply, while conversion capacity comes from specialized engineering firms and MRO networks that secure STCs and execute structural modifications such as cargo door installation, floor reinforcement, and main-deck systems integration. Lessors and platform integrators then feed aircraft into express, postal, and general cargo networks via operating leases and ACMI models.
Supply chain constraints are a recurring limiter for both OEM and conversion pathways. Industry bodies have pointed to ongoing instability in aerospace manufacturing supply chains, including shared material inputs such as aluminum, steel, and superalloys, and production bottlenecks in widebody programs that delay passenger deliveries and reduce near-term conversion feedstock availability. On the conversion side, regulatory certification milestones can unlock capacity quickly. For example, the FAA certification of Mammoth Freighters for 777-200LR passenger-to-freighter conversions in April 2026 expands the pool of viable widebody conversion solutions, while A350 freighter schedule adjustments linked to A350 production hurdles influence operator sequencing between new-build orders, life extensions, and P2F alternatives.
Competitive Landscape
The production of freighter aircraft is concentrated within a two-manufacturer market. In 2025, Boeing is projected to account for 70% of factory deliveries, with 22 units of the 777F and six units of the 767F delivered. Meanwhile, Airbus is expected to produce eight A350Fs during the aircraft's first full year of production. The passenger-to-freighter conversion arena, however, is fragmented. Israel Aerospace Industries, ST Engineering, Precision Aircraft Solutions, and KF Aerospace collectively completed 105 conversions in 2025, competing fiercely for airframes and hangar labor. Lessors such as AerCap pre-purchase slots, then market converted 737-800BCFs and 777-300ERSFs on operating leases that shift residual-value and compliance risk away from airlines, a structure attractive to e-commerce logistics arms with thin balance sheets.
OEMs are relying on technology to maintain their market share. Boeing’s 777-8F will incorporate composite wing-covers and advanced flutter-suppression logic to cut fuel burn 20% versus the 747-8F, translating to roughly USD 2 million annual savings per aircraft even at USD 2.75 per-gallon jet fuel. Airbus positions the A350F as a compliance hedge: its inherent CO₂ performance beats ICAO’s 2027 line-fit target by a 10% margin, ensuring unrestricted airport access beyond 2045. Conversion specialists respond by reducing downtime; ST Engineering trimmed its A321P2F turnaround to 82 days through the use of modular kit design, resulting in a 15% lead-time gain over 2024.
Digital forwarders are another competitive vector. Freightos and Flexport aggregate capacity and publish all-in rates via APIs, eroding traditional forwarders’ informational advantage. Incumbent cargo airlines are therefore investing in real-time booking portals and predictive load planning to defend their share, amplifying the technology arms race within the freighter aircraft market.
Freighter Aircraft Industry Leaders
-
The Boeing Company
-
Airbus SE
-
Avions de Transport Régional (ATR)
-
Singapore Technologies Engineering Ltd
-
Aeronautical Engineers Inc.
- *Disclaimer: Major Players sorted in no particular order
Freighter Aircraft Market Companies Covered in this Report
- The Boeing Company
- Airbus SE
- Avions de Transport Régional (ATR)
- Textron Inc.
- KF Aerospace
- Singapore Technologies Engineering Ltd
- Aeronautical Engineers Inc.
- Precision Aircraft Solutions
- Israel Aerospace Industries Ltd
- Embraer S.A.
- Silk Way West Airlines
Market Opportunities and Future Outlook
Near-term whitespace focuses on adding compliant, fuel-efficient main-deck lift where widebody availability and certification gates constrain supply. The market is shifting toward large-widebody solutions that balance range with volumetric capacity, supported by multiple 2026 proof points: Emirates SkyCargo introduced the first Boeing 777-300ERSF (converted) into commercial service in June 2026, and the FAA issued an STC for the 777-200LRMF conversion program in April 2026. These developments broaden the addressable conversion landscape beyond legacy 767 and 737 families and add options for operators navigating OEM delivery slots and airframe feedstock limits.
Competition and investment are also building around factory-freighter replacement cycles and network densification. Atlas Airs March 2026 firm order for 20 Airbus A350Fs indicates a widening buyer set for next-generation freighters beyond traditional fleet commonality constraints, while conversion infrastructure continues to expand through new contracts and distributed conversion networks, including A330P2F activity tied to EFW and partners in China. Alongside tightening emissions and noise compliance economics referenced in the report context (EU-ETS full aviation inclusion from 2026 and ICAO CO2 standards from 2027), these actions keep fleet renewal, conversion program expansion, and specialized cargo capability, such as temperature-controlled and high-volume express flows, central to procurement and leasing decisions through the study period.
Recent Industry Developments in Freighter Aircraft Market
- July 2026: FTAI Aviation and Aeronautical Engineers Inc. (AEI) announced a strategic collaboration focused on Boeing 737-800 freighters, combining conversion activity with engine maintenance capabilities. The tie-up targets lower operating costs and improved asset availability for operators running high-cycle express and parcel networks.
- March 2026: Elbe Flugzeugwerke (EFW), the ST Engineering and Airbus joint venture, signed an A330-300P2F conversion contract with Asia Pacific Aviation Leasing Group (APAL), with work scheduled to start in 2Q 2026. The agreement adds conversion backlog visibility and supports the scaling of mid-size widebody freighter supply for carriers and lessors seeking alternatives to constrained factory delivery slots.
- October 2025: Miami-based Aeronautical Engineers Inc. (AEI) initiated development of its Boeing 737-900ER passenger-to-freighter program, targeting certification by 2029. The program expands the narrowbody conversion menu for operators that need higher volume and payload than earlier 737 variants while staying within short- to medium-haul cargo network economics.
Freighter Aircraft Market Report Scope and Research Methodology
Market Definition and Coverage
For this study, the freighter aircraft market covers the value of fixed-wing aircraft used mainly to carry cargo. This includes new-build freighters and passenger-to-freighter conversions, counted at the aircraft and major conversion-program level across global demand.
Scope exclusions: We exclude passenger belly-cargo capacity, pure ground logistics services, and routine line maintenance not tied to a freighter acquisition or conversion decision.
Segments Covered in This Report
- By Aircraft Type
- OEM Configured
- Passenger-to-Freighter Conversion
- By Payload Capacity
- Standard-Body (Less than 45 tonnes)
- Medium Widebody (40–80 tonnes)
- Large Widebody (Greater than 80 tonnes)
- By Engine Type
- Turbofan
- Turboprop
- Geography
- North America
- United States
- Canada
- Mexico
- South America
- Brazil
- Rest of South America
- Europe
- Germany
- United Kingdom
- France
- Russia
- Rest of Europe
- Asia-Pacific
- China
- India
- Japan
- Australia
- Rest of Asia-Pacific
- Middle East and Africa
- Middle East
- Saudi Arabia
- United Arab Emirates
- Rest of Middle East
- Africa
- South Africa
- Rest of Africa
- Middle East
- North America
Data Sources, Market Sizing, and Validation
Desk Research
Desk work starts by mapping the active freighter fleet, order activity, and cargo-demand signals that can be checked in public data. We use sources such as ICAO air transport statistics, IATA air cargo releases, FAA registry and guidance material, EASA publications, and UN Comtrade trade flows to anchor both traffic levels and trade direction.
Next, we cross-check program activity and pricing logic using company annual reports, investor presentations, press releases, airport and cargo hub statistics, and reputable aviation press coverage. Where needed, we also use paid subscriptions for company financials and intelligence, aviation databases with aircraft-level details, and patent databases to confirm conversion activity and technology direction. These examples are not exhaustive, and other public and paid sources were also used to collect data, validate it, and resolve open questions.
Primary Interviews and Surveys
Primary work was used to test demand drivers and keep assumptions realistic, especially around fleet replacement timing and conversion feasibility. We spoke with cargo operators, lessors, conversion and MRO participants, and airport or cargo specialists across APAC, EMEA, and the Americas, then used follow-up questions to reconcile differences observed during desk work.
Distribution of primary research fieldwork respondents
| Company type | Respondent position | Region |
|---|---|---|
| Top tier: 29% | CXOs: 12% | APAC: 50% |
| Mid tier: 57% | Functional/Unit leaders: 32% | EMEA: 31% |
| Smaller Players: 14% | Managers: 56% | Americas: 19% |
Market-Sizing & Forecasting
Sizing begins with a top-down build where air cargo traffic signals and freighter fleet requirements are reconstructed by region. We then translate these inputs into expected aircraft demand by payload class and engine type. To keep totals grounded, we corroborate results with selective bottom-up checks, such as sampling announced freighter orders and conversion slots, and applying reasonable aircraft or conversion pricing ranges to the implied volumes.
Key inputs used in the model include freighter fleet size and age profile, conversion candidate availability, cargo traffic growth (CTKs and load factor direction), replacement cycles by payload class, and the share shift between belly capacity and dedicated freighters. We also monitor regulatory and operating constraints that influence fleet choices, including noise and emissions compliance timelines, and we use fuel price direction as a sensitivity lever.
For forecasting, scenario analysis is used so the model can reflect different cargo-demand paths and conversion capacity outcomes. When bottom-up information is missing for specific routes or smaller operators, gaps are handled through regional averages tied back to fleet composition, utilization assumptions, and expert-reviewed pricing progressions.
Data Validation & Update Cycle
Outputs are checked against independent signals such as reported freighter fleet counts, published delivery and conversion activity, and regional air cargo growth indicators. If large variances show up by region or payload class, assumptions are re-tested and experts are re-contacted to determine whether the change is real or data-related.
Before sign-off, the model and calculations go through a multi-step analyst review. This includes anomaly checks on pricing, implied unit demand, and year-over-year jumps. Reports are refreshed annually, and interim updates are made when material events occur, such as major program announcements or sharp cargo-cycle shifts. Before delivery, an analyst performs a fresh pass so clients receive the latest updated view.
Mordor Intelligence's Freighter Aircraft Market Size Compared Against Other Published Estimates
Published market sizes for freighter aircraft do not always match because the counting boundary is not the same across studies, and because demand can be expressed as fleet value, deliveries, or conversion program value. Timing choices also matter, since aircraft pricing and conversion backlogs can shift within a single year.
By tracking fleet additions, conversion slot capacity, and pricing refresh triggers, Mordor Intelligence keeps the 2026 total tied to delivered and realistically executable freighter supply, instead of mixing in broader air cargo services or long-range fleet value views.
Benchmark comparison
| Source | Market Size | Gaps in Research Methodology |
|---|---|---|
| Mordor Intelligence | USD 9.40 B (2026) | |
| Trade Journal A | USD 7.85 B (2025) | Uses a nearer-term year and tends to emphasize delivered aircraft activity, which can undercount conversion pipeline value when slots are booked but not yet inducted. |
| Regional Consultancy B | USD 21.40 B (2024) | Appears to use a wider value pool that can blend freighter aircraft with adjacent air cargo spending, and it may apply higher blended pricing without payload-class checks. |
The spread is mainly explained by what gets counted and when it is counted, rather than a disagreement that demand exists. A model that links fleet adds, conversion feasibility, and price assumptions to observable cargo and fleet signals gives a practical number that can be re-checked year after year.
Key Questions Answered in the Report
What is the current value of the freighter aircraft market?
The freighter aircraft market size was USD 9.40 billion in 2026 and is projected to reach USD 12.11 billion by 2031, with a CAGR of 5.20%.
Which aircraft type is expanding the fastest?
Passenger-to-freighter conversions are growing at 5.95% CAGR, outpacing new-build deliveries.
Why is the Middle East showing the highest regional growth?
Carriers such as Emirates and Qatar are adding 777Fs to leverage sixth-freedom hubs that link Asia with Europe and Africa, resulting in a 6.23% CAGR for the region.
How will ICAO’s 2027 CO₂ standard affect fleet plans?
Operators must choose between ordering new 777-8Fs and A350Fs that meet the rule or converting mid-life passenger jets and accepting operational restrictions at noise-sensitive airports.
What are the main cost risks for cargo airlines?
Volatile jet-fuel prices and rising carbon-allowance costs under the EU-ETS can erode margins rapidly, especially for carriers without strong hedging capacity.
Are turboprop freighters still relevant?
Yes, turboprops such as the ATR 72-600F are expected to expand at a 6.11% CAGR through 2031 on short routes with runway or demand constraints that make jets uneconomical.