
Market Overview
| Study Period | 2021 - 2031 |
|---|---|
| Forecast Data Period | 2026 - 2031 |
| Base Year Market Size (2025) | 27.72 gigawatt |
| Market Volume (2026) | 32.94 gigawatt |
| Market Volume (2031) | 78.1 gigawatt |
| Growth Rate (2026 - 2031) | 18.84 % |
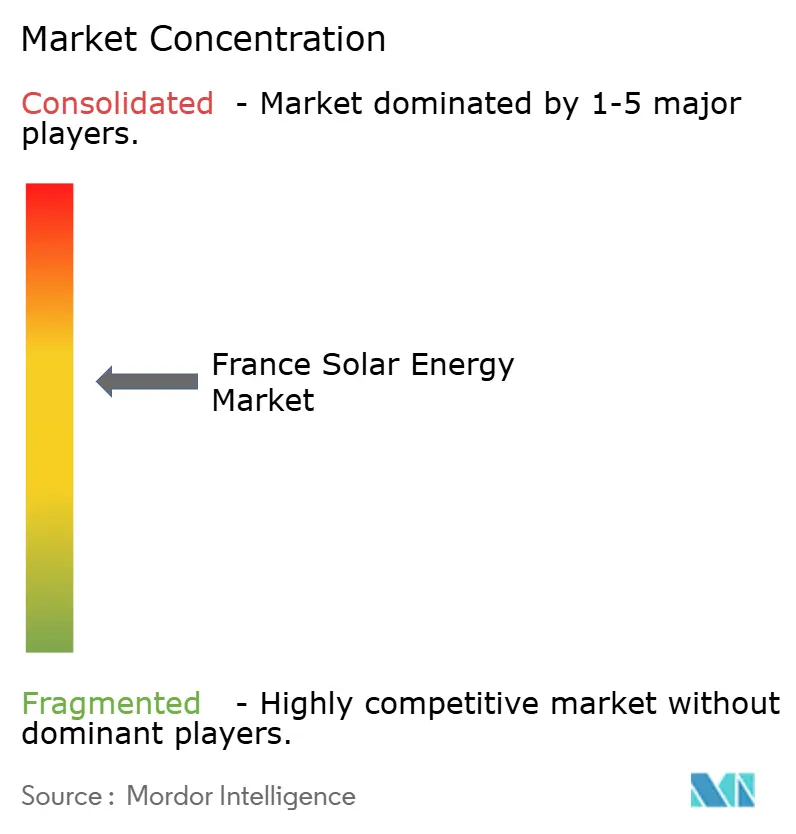
| Market Concentration | Medium |
Major Players *Disclaimer: Major Players sorted in no particular order Image © Mordor Intelligence. Reuse requires attribution under CC BY 4.0. | |
France Solar Energy Market Analysis by Mordor Intelligence
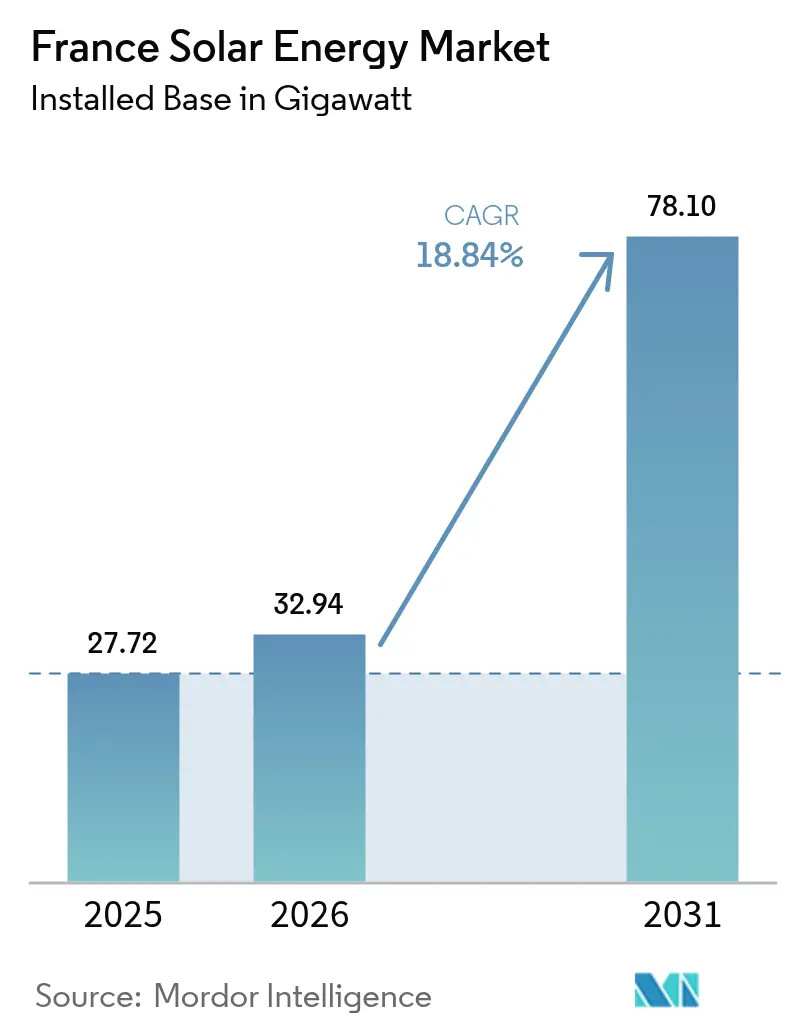
France Solar Energy Market size in 2026 is estimated at 32.94 gigawatt, growing from 2025 value of 27.72 gigawatt with 2031 projections showing 78.1 gigawatt, growing at 18.84% CAGR over 2026-2031.
Government policies that shifted from feed-in tariffs to 20-year contract-for-difference (CfD) auctions have preserved developer returns even as clearing prices fell below EUR 60/MWh, reinforcing investor confidence. Mandatory photovoltaic (PV) deployment on large parking lots and commercial rooftops under the 2023 APER law, combined with the national 60 GW target in the draft PPE3 plan, adds structural momentum to the France solar energy market. Technology learning curves that lowered utility-scale levelized cost of electricity (LCOE) to EUR 42-48/MWh in 2024, as well as rising corporate power-purchase agreements (PPAs), further stimulate capacity additions.[1] Competitive intensity is rising as integrated utilities and independent power producers pivot toward bifacial modules, single-axis trackers, and co-located battery storage to meet grid-stability requirements.
Key Report Takeaways
- By technology, solar photovoltaic held 100.00% of the France solar energy market share in 2025 and is expanding at a 18.84% CAGR through 2031.
- By grid type, on-grid systems commanded 99.03% of the France solar energy market size in 2025 and are accelerating at a 20.02% CAGR between 2026-2031.
- By end user, commercial and industrial installations are growing at a 24.05% CAGR to 2031, while utility-scale projects retained a 54.18% France solar energy market in 2025.
- EDF Renewables, ENGIE, TotalEnergies, Neoen, and Voltalia collectively controlled nearly 40% of the project pipeline in 2024.
Note: Market size and forecast figures in this report are generated using Mordor Intelligence’s proprietary estimation framework, updated with the latest available data and insights as of 2026.
France Solar Energy Market Trends and Insights
Drivers Impact Analysis*
| Driver | (~) % Impact on CAGR Forecast | Geographic Relevance | Impact Timeline |
|---|---|---|---|
| FiT-to-CfD transition sustaining investor IRR | +3.20% | National, with early gains in Occitanie, Nouvelle-Aquitaine, Provence-Alpes-Côte d'Azur | Medium term (2-4 years) |
| Declining LCOE & auction clearing prices | +4.10% | National, concentrated in southern high-irradiance regions | Short term (≤ 2 years) |
| 2030 Solar Plan: 60 GW target | +5.80% | National, policy-driven acceleration across all regions | Long term (≥ 4 years) |
| Mandatory PV on parking lots & large roofs | +2.70% | National, urban and peri-urban zones with commercial density | Medium term (2-4 years) |
| Agri-PV pilots unlocking farmland pipeline | +1.90% | Rural regions: Occitanie, Nouvelle-Aquitaine, Pays de la Loire | Long term (≥ 4 years) |
| Hybrid PV-storage design in CRE tenders | +1.60% | National, grid-constrained areas prioritizing dispatchability | Medium term (2-4 years) |
| Source: Mordor Intelligence | |||
FiT-to-CfD Transition Sustaining Investor IRR
The move from administratively set tariffs to competitive CfD auctions cut taxpayer exposure while giving developers 20-year revenue certainty. The 2024 ground-mounted tender cleared at EUR 54.45/MWh versus EUR 63.3/MWh a year earlier, yet unlevered internal rates of return held near 7-8% as banks underwrite contracted cash flows instead of merchant prices. Independent power producers captured 48% of the awarded volume, proving that CfDs democratize participation and diversify the France solar energy market. Bid-bond forfeiture clauses now oblige developers to reach financial close within 18 months, prompting early grid-connection reservations and more rigorous due diligence practices. The structure also allows the state to claw back excess revenues if spot prices exceed the strike price, preserving public support for renewables.
Declining LCOE and Auction Clearing Prices
Utility-scale LCOE fell to EUR 42-48/MWh in 2024 as bifacial efficiencies hit 21-22% and tracker adoption boosted yields by 15-20%. Rooftop auctions mirrored this decline, averaging EUR 89/MWh for 100-500 kW systems in 2024, down from EUR 105/MWh in 2023. Developers responded by streamlining supply chains and standardizing designs to protect double-digit margins. Corporate buyers quickly seized the opportunity: a 15-year PPA signed by TotalEnergies in 2024 priced power at EUR 52/MWh, which is cheaper than retail tariffs and below grid parity.[2] Lower generation costs have shortened payback periods for behind-the-meter arrays to under six years, catalyzing distributed adoption in the France solar energy market.
2030 Solar Plan 60 GW Target
The draft PPE3 plan obliges France to triple installed solar capacity by 2030, translating into 6-8 GW of annual additions. CRE boosted ground-mounted auction volumes to 3 GW per year, with an extra 2 GW earmarked for rooftop and agri-PV installations, ensuring project-pipeline visibility. Regions tailor implementation: sun-rich Occitanie plans 12 GW by 2030, while densely populated Île-de-France relies on rooftop deployment to balance land use. RTE estimates that EUR 100 billion of network strengthening is needed by 2035 to absorb renewable penetration above 50%, underlining the importance of synchronized grid investment. Without it, up to 10 GW of awarded projects risk being stranded, tempering the otherwise robust outlook for the France solar energy market.
Mandatory PV on Parking Lots and Large Roofs
Under the 2023 APER legislation, parking lots above 1,500 m² and rooftops larger than 500 m² must install PV between 2026 and 2028. The rule could unlock 3-5 GW of distributed capacity, especially for retail, logistics, and industrial sites. Companies such as Carrefour announced a 200 MW program in 2024, while Amazon targets 150 MW across its French fulfillment network. Turn-key leasing and third-party ownership models allow property owners to comply without capex. Technical barriers remain, roof-load limits, fire codes, and grid upgrades, but compliant projects benefit from self-consumption rules that let offtakers use up to 80% of generation on-site.
Restraints Impact Analysis*
| Restraint | (~) % Impact on CAGR Forecast | Geographic Relevance | Impact Timeline |
|---|---|---|---|
| Grid connection queue & permitting delays | -2.80% | National, acute in Occitanie, Nouvelle-Aquitaine, Provence-Alpes-Côte d'Azur | Short term (≤ 2 years) |
| Land-use & biodiversity opposition | -1.40% | Rural and peri-urban zones with agricultural or protected land designations | Medium term (2-4 years) |
| Module price volatility amid global oversupply | -1.10% | National, supply-chain dependent developers | Short term (≤ 2 years) |
| Rising local-content requirements raising capex | -0.90% | National, EU-wide regulatory compliance | Long term (≥ 4 years) |
| Source: Mordor Intelligence | |||
Grid Connection Queue and Permitting Delays
Average connection times lengthened to 18-24 months in 2024 as RTE’s substations could not keep up with the surge in applications. Environmental impact assessments now take 12-18 months under stricter biodiversity rules, while appeals add up to another year, placing 20-25% of auctioned capacity in danger of missing commissioning deadlines. Although fast-track procedures for projects along railways and highways were introduced in 2024, higher land costs have slowed uptake. Funding constraints also loom; RTE invests EUR 2-3 billion annually against a EUR 100 billion need through 2035, implying sustained bottlenecks that could dampen the France solar energy market.
Module Price Volatility
Chinese polysilicon oversupply drove module prices down by 35-40% between 2023 and mid-2024, then threatened to rebound once anti-dumping probes began in Europe. Price swings undermined fixed-price engineering, procurement, and construction contracts signed months earlier, compressing margins by up to 12% and prompting renegotiations. Tariffs as high as 25% could lift module costs by EUR 0.03/W, inflating capex by 5-7%. Larger players hedged by signing multi-year deals with Southeast Asian suppliers, but smaller developers lack bargaining power, increasing financing costs by 25–50 basis points as lenders demand price-escalation clauses.
*Our forecasts treat driver/restraint impacts as directional, not additive. The impact forecasts reflect baseline growth, mix effects, and variable interactions.
Segment Analysis
By Technology: PV Dominance Reflects Insolation Profile
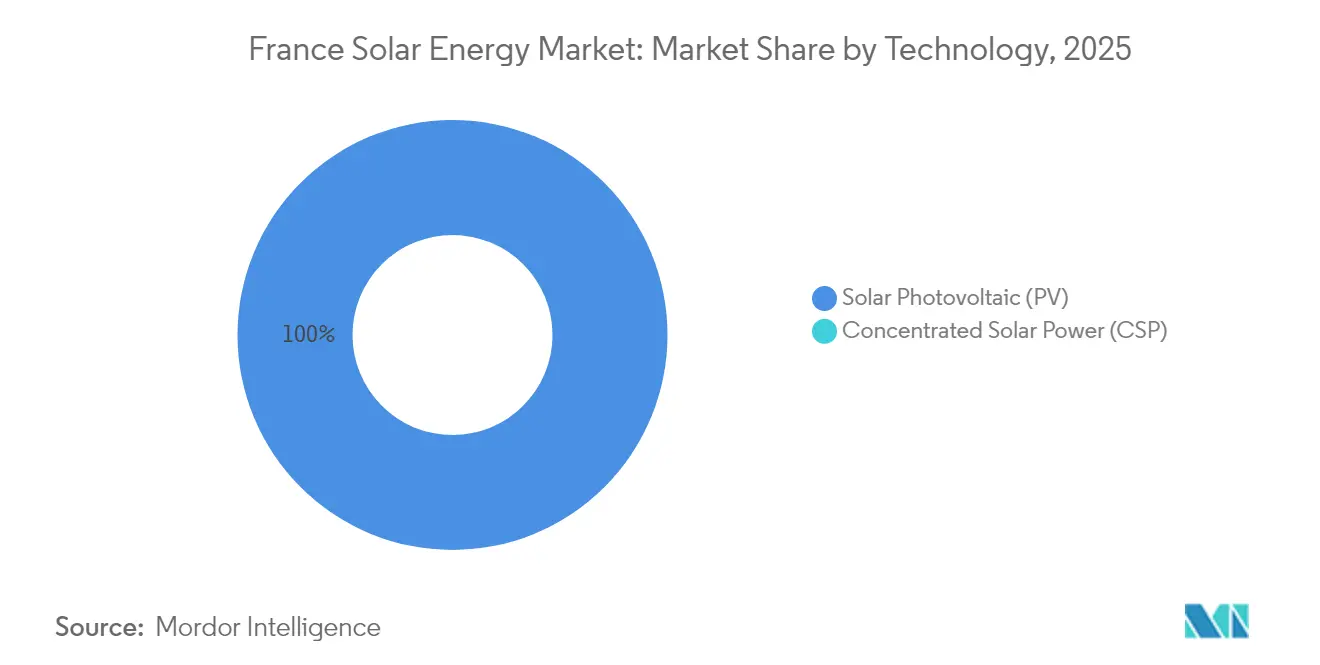
Solar photovoltaic accounted for 100.00% of installations, underscoring the absolute dominance of PV within the France solar energy market at 27.72 GW in 2025. Concentrated solar power (CSP) remains commercially absent because direct normal irradiance seldom exceeds 1,400 kWh/m², far below the threshold for CSP viability. Crystalline-silicon modules hold 95% share, while bifacial panels now appear in 45% of ground-mounted arrays, improving yields by 10-15%. Perovskite-silicon tandem cells reached 28% efficiency in pilot settings, hinting at future upgrades. Floating PV is small but growing on reservoirs where land is scarce, and CRE tenders continue to prioritize hybrid projects that integrate storage.
The France solar energy market benefits from rapid technology maturity, evidenced by single-axis tracker penetration of 60% in southern provinces and digital asset-management tools that raise performance ratios by 2-3 percentage points. Policy levers reinforce PV’s edge; 80% of auction capacity is allocated to ground-mounted and rooftop PV, with the rest reserved for hybrid or agri-PV designs. Looking ahead, domestic module factories such as Carbon’s 3.4 GW heterojunction facility improve supply-chain resilience and may satisfy local-content rules by 2026.

By Grid Type: On-Grid Systems Drive Scale
On-grid assets represented 99.03% of the 2025 France solar energy market share and are forecast to grow at a 20.02% CAGR to 2031, outpacing total additions because of CRE auction volumes and corporate PPAs. Utility-scale plants above 5 MW supplied 54.50% of on-grid capacity, whereas rooftop commercial systems captured 35.00% and residential 10.50%. Developers leverage CfDs for bankable revenue streams, while C&I clients deploy behind-the-meter arrays to dodge EUR 0.18/kWh retail tariffs and network fees.
Off-grid deployments stay below 1% of the France solar energy market size, limited to island territories and remote farms. However, rising diesel costs encourage hybrid mini-grids on Corsica, where EDF installed 12 MW of solar-battery capacity in 2024. Net-metering for surplus generation is capped at EUR 0.10/kWh, a rate under review as grid operators reassess cost-recovery mechanisms amid higher distributed penetration.
By End User: C&I Segment Accelerates on PPA Economics
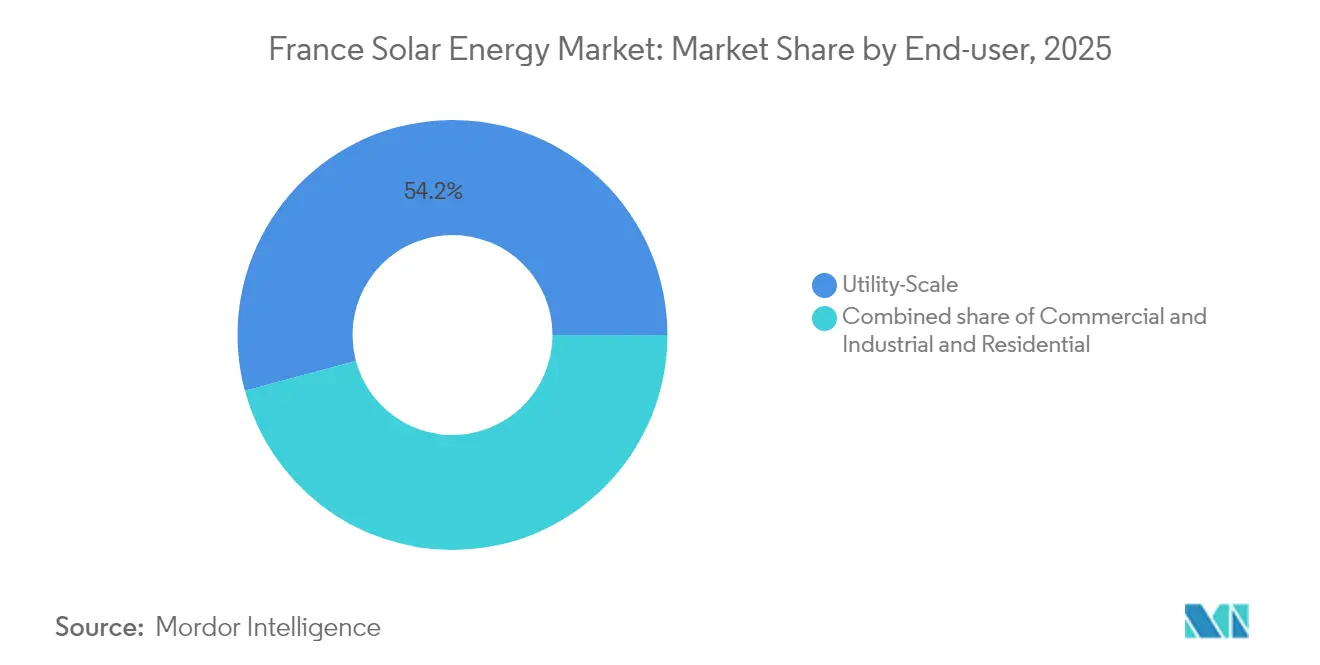
Utility-scale plants held a 54.18% France solar energy market share in 2025, but commercial and industrial sites show the fastest expansion at 24.05% CAGR through 2031, facilitated by mandatory rooftop rules and accessible third-party financing. Paybacks are now below six years as PV LCOE slips to EUR 0.08-0.10/kWh, well under retail tariffs. Corporate PPAs surged to 850 MW in 2024, closing the gap between green-power demand and supply.
Residential arrays add diversity yet contribute only 10.00% of capacity because average system sizes are under 5 kW, and financing choices remain scarce. Still, feed-in tariffs of EUR 0.13-0.17/kWh, coupled with rising electricity prices, foster a 14.58% CAGR in household uptake. Utility-scale growth continues at 16.44% CAGR, but land-use conflicts and permitting delays impose greater execution risk.
Geography Analysis
Southern regions, Occitanie, Provence-Alpes-Côte d’Azur, and Nouvelle-Aquitaine, made up 54.65% of national capacity in 2025 because irradiance exceeds 1,600 kWh/m² and land for utility-scale arrays is abundant. Occitanie alone operates 8 GW and targets 12 GW by 2030 through streamlined agri-PV rules that permit dual land use, yet grid queues create 12-18-month commissioning lags. Provence-Alpes-Côte d’Azur trials floating PV and requires EUR 1.2 billion of grid upgrades to absorb its 4.5 GW fleet. Nouvelle-Aquitaine is a hotspot for agri-PV pilots, tallying 250 MW of viticulture-compatible capacity in 2024.
Northern provinces, Île-de-France, Hauts-de-France, and Grand Est, account for 40.35% of installations. Île-de-France added 400 MW of rooftops in 2024 despite lower sun hours, propelled by APER compliance and data-center PPAs. Brownfield redevelopment drives utility-scale growth in Hauts-de-France and Grand Est, where 600 MW went online in 2024 on remediated industrial land. Corsica and overseas departments comprise 5.00% of capacity, with dedicated CRE tenders and tariffs of EUR 0.18-0.22/kWh to offset higher logistics costs.
The locational mix is set to rebalance modestly as rooftop mandates lift northern share, yet superior irradiance secures southern leadership. Regional permitting timelines still vary markedly: 10-12 months in Occitanie versus up to 18 months in Île-de-France, a disparity that influences site selection. RTE’s investment plan earmarks 60% of network expenditure for southern corridors, reinforcing the dominant role of these regions in the France solar energy market.
Regulatory Landscape
France supports solar mainly through the obligation d'achat and complément de rémunération framework, delivered via competitive tenders. The Commission de Regulation de l Energie (CRE) oversees tender design, tariff positions, and compliance expectations. Over time, the market has moved away from legacy feed-in tariffs toward 20-year contract-for-difference style auctioning, and Law No. 2023-175 (10 March 2023, acceleration of renewable energies) adds planning instruments such as renewable acceleration zones that affect siting and permitting pathways.
In 2026, CRE consultations pointed to tighter eligibility and evaluation rules for new PV volumes. This included resilience-related criteria for ground-mounted tenders aligned with EU Net-Zero Industry Act requirements (CRE opinion dated 16 April 2026) and an update direction for the S21 building/hangar/canopy tariff framework that emphasizes self-consumption and lower surplus remuneration (CRE opinion dated 29 April 2026). Beyond support design, compliance obligations remain a material factor: installations under supported purchase contracts require mandatory inspections by certified bodies at the producer's expense, reinforcing quality and grid-connection conformity as volumes scale.
Competitive Landscape
Market concentration is moderate. EDF Renewables, ENGIE, and TotalEnergies pursue scale via CfDs and PPAs, while Neoen, Voltalia, and Akuo Energy harness hybrid storage to differentiate bids. The top five developers control about 40% of the active pipeline, yet niches such as agri-PV and building-integrated PV allow regional specialists, Urbasolar, Photosol, to flourish. Neoen won 1.2 GW of contracts since 2022 by co-locating 100 MW batteries with solar arrays, meeting RTE’s dispatchability criteria. TotalEnergies leverages its retail arm to strike PPAs at EUR 50-55/MWh, locking in 15-year cash flows outside auction cycles.
Agri-PV represents fertile ground: Urbasolar and Photosol hold 30% of the 2024 pipeline by collaborating with farm cooperatives under new dual-use rules. BIPV remains nascent at 80 MW, hampered by limited module supply, but carries long-term promise as retrofits accelerate. Digitalization is the new battleground; asset-management platforms that use predictive algorithms raise energy yields and cut operating expenditure, lifting project IRR by up to 30 basis points. CRE’s innovation criteria reserve 20% of capacity for projects with storage or recycled components, rewarding developers with R&D muscle or ties to European factories like Carbon’s heterojunction line or Holosolis’ planned 5 GW plant.
France Solar Energy Industry Leaders
-
Engie SA
-
EDF Renewables
-
Albioma SA
-
TotalEnergies SE
-
Meeco AG
- *Disclaimer: Major Players sorted in no particular order
Market Opportunities and Future Outlook
The February 2026 PPE3 decree (multi-annual energy programming for 2026-2035) resets the policy envelope for French solar with a 48 GW target by 2030 and an indicated 55 to 80 GW range by 2035. It also structures public support around defined annual volumes, including a 2.9 GW per-year cap for new solar support through 2028 across ground-mounted and rooftop routes. For developers, this adds a more defined near-term route-to-market when they can secure permits and grid access under CRE tender schedules. It also pushes portfolio design toward higher system value, including dispatchability and reduced network impacts as negative price hours become more frequent.
White-space is also opening in areas that match PPE3 and APER priorities, particularly through the use of already artificialized land (rooftops, car parks, and degraded or brownfield sites) and agrivoltaics. Recent company activity provides a clear read on where build-outs are concentrating: Neoen announced construction starts in February 2026 for three solar farms (147 MWp, 48 MWp, and 35 MWp), targeting operation by 2028. Major developers such as TotalEnergies and ENGIE Green have continued to build on non-agricultural constrained land types, including airfield perimeters and former quarries. On the distributed side, the APER compliance window for large parking lots and roofs (2026-2028) supports turnkey and third-party ownership models, but the economics increasingly hinge on self-consumption as tariff structures for surplus injection face downward pressure linked to ongoing S21 reform discussions.
Recent Industry Developments
- June 2026: TotalEnergies inaugurated the 45 MWc Cere solar power plant in the Landes region, described as its largest installation in Nouvelle-Aquitaine. Bringing a larger single asset online strengthens its regional generation footprint and adds scale that can be paired with corporate offtake and broader renewables supply offerings.
- April 2026: ENGIE Green inaugurated the first 11 MWc tranche of a solar park at the Montbeugny airfield (Allier), within a project planned to reach 31.5 MWc. The phased delivery model accelerates early energy output while permitting and grid milestones progress for later tranches, and it illustrates the use of constrained land (airfield perimeter) to limit siting conflict.
- October 2024: ENGIE announced a EUR 500 million investment to develop 1 GW of solar and hybrid storage projects in Occitanie and Nouvelle-Aquitaine by 2027, targeting CRE tender participation and corporate PPA offtake. The portfolio mix of 600 MW solar and 400 MW of co-located storage reinforces the market shift toward hybrid designs that address grid-stability requirements while keeping auction bids competitive.
Research Methodology Framework and Report Scope
Market Definition and Coverage
For this study, the France solar energy market is sized on installed solar capacity that is operating in the country, tracked in gigawatts (GW) across grid connected and off grid projects.
Scope exclusions: We do not count broader power market revenues, carbon credits, or downstream electricity retail sales, and we also avoid mixing value (USD) with capacity (GW) in the same market total.
Segmentation Overview
- By Technology
- Solar Photovoltaic (PV)
- Concentrated Solar Power (CSP)
- By Grid Type
- On-Grid
- Off-Grid
- By End-User
- Utility-Scale
- Commercial and Industrial (C&I)
- Residential
- By Component (Qualitative Analysis)
- Solar Modules/Panels
- Inverters (String, Central, Micro)
- Mounting and Tracking Systems
- Balance-of-System and Electricals
- Energy Storage and Hybrid Integration
Data Sources, Market Sizing, and Validation
Desk Research
Desk research was used to set the factual base for the model, especially for historic capacity additions and policy driven targets. We relied on public sources such as IEA PVPS national survey publications, IRENA statistics, Eurostat energy datasets, and official publications from the French energy regulator and energy transition bodies (for example, grid connection and renewable progress reporting).
We also reviewed grid operator updates, project permitting notes, and public tender award summaries to understand what is likely to move from pipeline into commissioned capacity. Company annual reports, investor presentations, and reputable press were used to cross-check buildout timelines and the technology mix. Where public data was thin, a paid subscription for company financials, patent lookups, and shipment or trade statistics was used selectively to validate a few assumptions. These examples are indicative only, and many other sources were also consulted for data collection, validation, and clarification.
Primary Interviews and Surveys
Primary work focused on confirming how quickly projects move from award to grid connection, and what typical capacity ranges look like across utility scale and rooftop builds. We spoke with a mix of developers, EPC and installation participants, equipment and service providers, and buyers across residential, commercial, industrial, and utility settings to sanity check assumptions and fill gaps that desk sources do not resolve cleanly.
Respondent input was also used to pressure-test near term constraints such as connection queues and permitting pace, and to check how consistently policy programs are expected to continue. These points were then used to adjust scenario weights and the final view.
Distribution of primary research fieldwork respondents
| Company type | Respondent position |
|---|---|
| Top tier: 26% | CXOs: 14% |
| Mid tier: 56% | Functional/Unit leaders: 33% |
| Smaller Players: 18% | Managers: 53% |
Market-Sizing & Forecasting
The core sizing starts from a top-down build that reconstructs installed solar capacity using national and international capacity time series, grid connection signals, and tender and commissioning milestones, which are then translated into annual installed base levels in GW. To keep the totals realistic, selective bottom-up checks were added, such as sampling project pipelines by type, applying typical commissioning slippage rates, and cross-checking implied additions against observed procurement activity and installer throughput.
Key inputs used in the model include annual new PV additions, cumulative installed capacity, the share of on-grid versus off-grid systems, the mix between utility-scale and rooftop deployments, and expected connection lead times. Where data points were missing for a specific slice, we applied conservative interpolation anchored to known totals, then re-tested the results against expert feedback.
For forecasting, scenario analysis was used so that policy targets, tender cadence, and grid readiness could be translated into a practical range, and then narrowed into a base case after primary feedback aligned on the most likely build pace. Assumptions were reviewed year by year so sudden step changes were only applied when there was a clear program or permitting reason behind them.
Data Validation & Update Cycle
Outputs are validated through several checks before sign-off, including comparing implied annual additions against independent installation and grid-connection signals, and reviewing outliers that do not fit the expected permitting and construction cycle. When a variance is large, we re-check the source trail, re-run the calculations, and reconnect with relevant experts to confirm whether the shift is real or a timing artifact.
A second analyst review is completed to confirm scope alignment and arithmetic consistency, followed by a final read for any missing market events. The report is refreshed annually, and interim updates are triggered when material policy changes, major tender outcomes, or grid constraints materially change the near term outlook. Before delivery, a fresh pass is done so clients receive the most current view available.
Mordor Intelligence's France Solar Energy Market Sizing Compared With Other Published Estimates
Published market sizes for France solar can look far apart because some sources measure money flows while others measure physical capacity, and the year labels do not always represent the same point in the project cycle. Differences also come from whether figures include only photovoltaic deployments or also count related power market activity that sits outside solar capacity.
In practice, the biggest gap drivers are the unit of measure (GW installed base versus USD value), whether rooftop systems are counted at commissioning or at application, and how pipeline probability is handled for tenders and grid-queue projects. A faster refresh cadence and consistent treatment of on-grid and off-grid additions can also shift a current-year figure, especially when commissioning is lumpy across quarters.
Benchmark comparison
| Source | Market Size | Gaps in Research Methodology |
|---|---|---|
| Mordor Intelligence | USD 27.72 B (2025) | |
| Research Publisher A | USD 11.96 B (2023) | Uses a value-based definition (USD) for the solar market and applies a different base year, which can include equipment and service revenues rather than installed capacity added and operating in-country. |
| Research Publisher B | USD 2.50 B (2024) | Covers a narrower photovoltaic-only value pool and a different horizon, which typically excludes CSP and may treat project value recognition differently across development and commissioning stages. |
The table mainly shows a unit and scope mismatch rather than a simple disagreement on growth. By keeping the market total tied to installed capacity that is commissioned and operational, and then cross-checking the implied annual additions against grid and tender signals, the figure stays traceable to repeatable steps, which is the approach applied by Mordor Intelligence.
Key Questions Answered in the Report
How large is the France solar energy market in 2026?
Installed capacity is 27.72 GW in 2025 and is on track to reach 32.94 GW in 2026.
What is the expected capacity of solar power in France by 2031?
The France solar energy market size is forecast to reach 78.10 GW by 2031, based on the 18.84% CAGR over 2026-2031.
Which segment is growing fastest within French solar deployments?
Commercial and industrial rooftops and ground-mount systems expand at a 24.05% CAGR through 2031.
How do CfD auctions benefit solar developers?
They give 20-year price certainty, stabilize unlevered IRR at 7-8%, and reduce reliance on feed-in tariffs.
Where is most French solar capacity located?
Southern regions, Occitanie, Provence-Alpes-Côte d’Azur, and Nouvelle-Aquitaine, hold 54.65% of installations.