
Market Overview
| Study Period | 2020 - 2031 |
|---|---|
| Forecast Data Period | 2026 - 2031 |
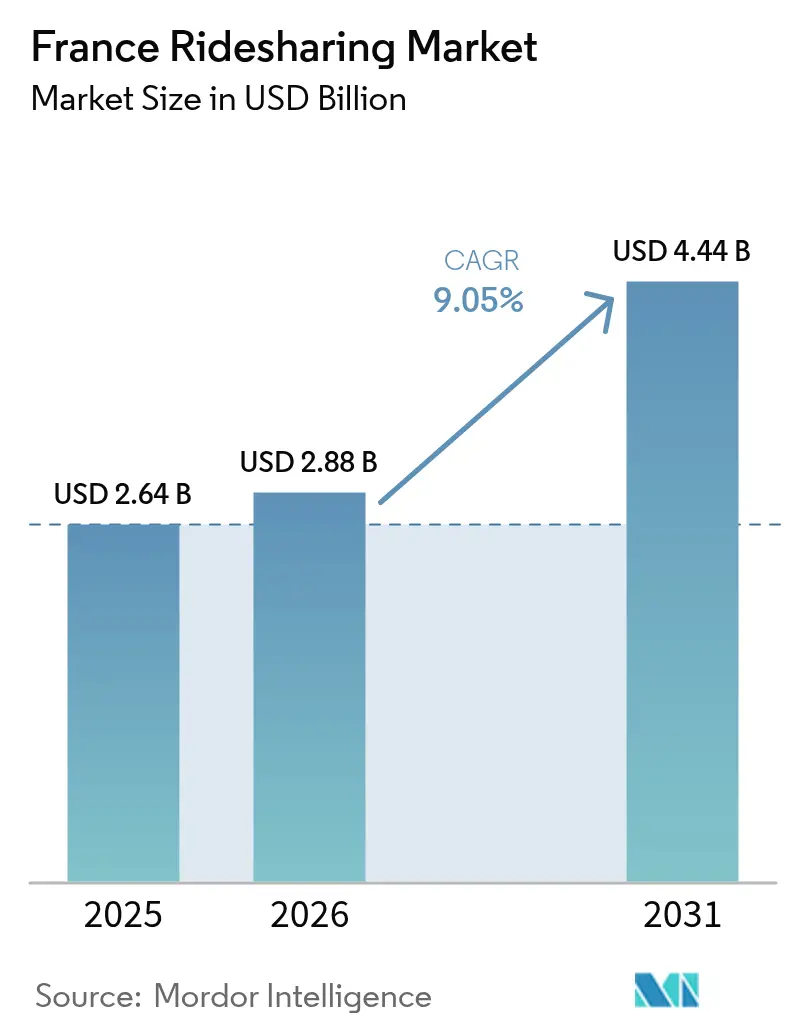
| Base Year Market Size (2025) | USD 2.64 Billion |
| Market Size (2026) | USD 2.88 Billion |
| Market Size (2031) | USD 4.44 Billion |
| Growth Rate (2026 - 2031) | 9.05% CAGR |
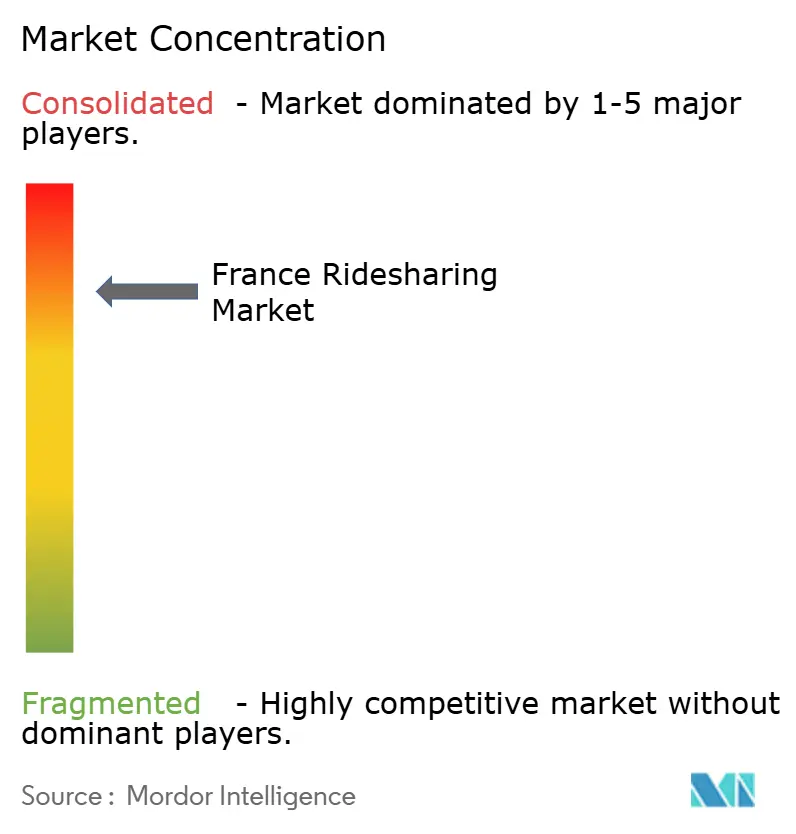
| Market Concentration | High |
Major Players *Disclaimer: Major Players sorted in no particular order Image © Mordor Intelligence. Reuse requires attribution under CC BY 4.0. | |
France Ridesharing Market Analysis by Mordor Intelligence
The France ridesharing market size was valued at USD 2.64 billion in 2025 and estimated to grow from USD 2.88 billion in 2026 to reach USD 4.44 billion by 2031, at a CAGR of 9.05% during the forecast period (2026-2031). Policy pressure for low-emission fleets, widening corporate mobility budgets, and the integration of ride-hailing services with public transit apps continue to redefine the competitive and economic landscape. Platform operators that scale electric-vehicle (EV) supply, embed payment wallets, and secure preferred placement inside Mobility-as-a-Service (MaaS) interfaces are capturing disproportionate volume and margin gains. A nationwide 5G footprint covering 93% of the population enables richer in-app features, including real-time carbon scoring that nudges users toward shared options. Paris’s EUR 18 per hour sport-utility-vehicle (SUV) parking fee and a dedicated périphérique car-sharing lane accelerate a modal shift toward on-demand rides, while Crit’Air diesel bans, effective January 2025, enforce fleet renewal toward battery-electric and hydrogen models. Fragmented competition, looming driver reclassification under the EU Platform Work Directive, and fast-rising insurance premiums temper otherwise robust demand.
Key Report Takeaways
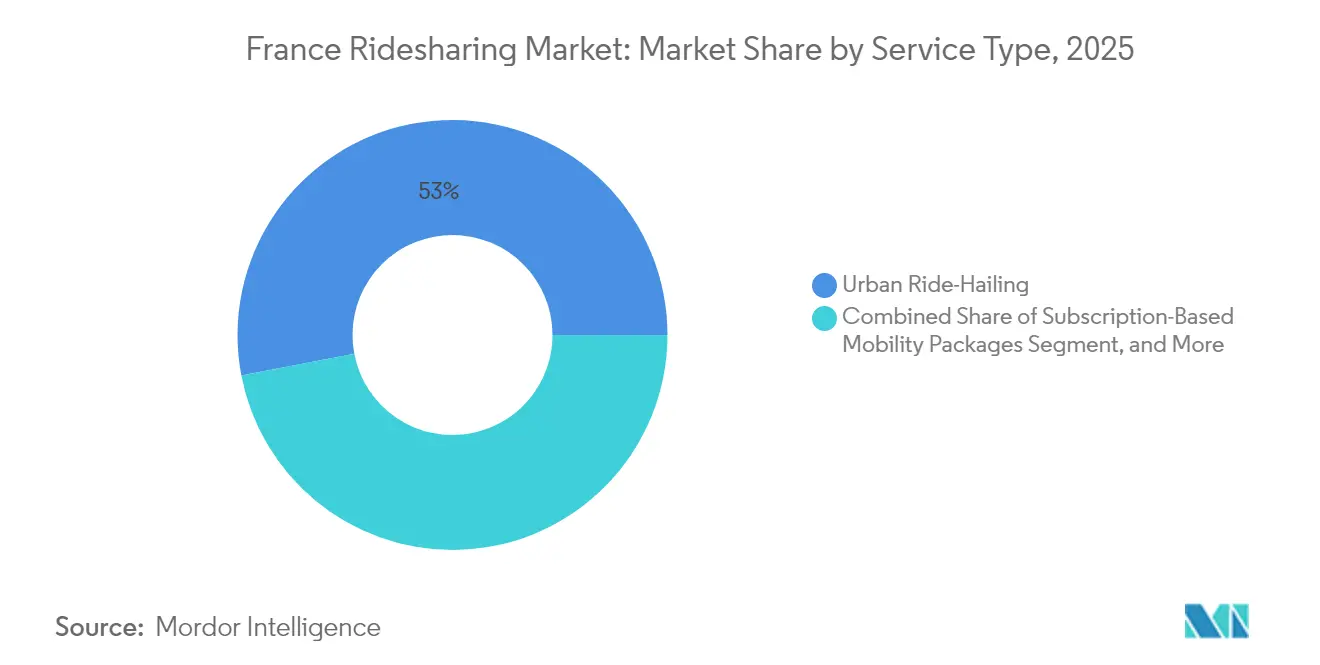
- By service type, urban ride-hailing held 53.02% of the France ridesharing market size in 2025, whereas subscription-based mobility packages are projected to rise at a 10.05% CAGR through 2031.
- By vehicle type, cars commanded 71.55% of the France ridesharing market size in 2025, while electric-vehicle bookings are forecast to expand at a 9.98% CAGR.
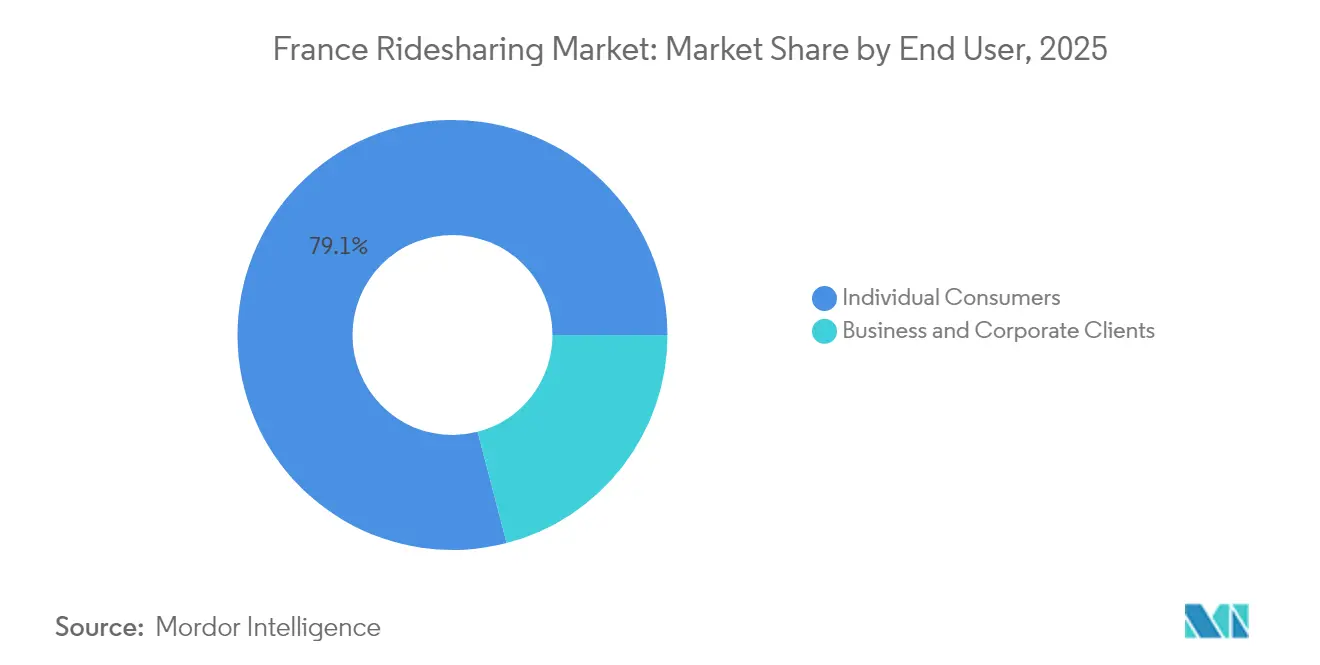
- By end user, individual consumers accounted for 79.05% of the France ridesharing market size in 2025, yet business and corporate clients are advancing at a 9.72% CAGR.
- By payment mode, card and wallet transactions captured 68.92% of the France ridesharing market size in 2025, and are expected to grow at a 9.85% CAGR, outpacing all other options.
Note: Market size and forecast figures in this report are generated using Mordor Intelligence’s proprietary estimation framework, updated with the latest available data and insights as of 2026.
France Ridesharing Market Trends and Insights
Drivers Impact Analysis*
| Driver | (~) % Impact on CAGR Forecast | Geographic Relevance | Impact Timeline |
|---|---|---|---|
| Government incentives for low-emission mobility | +1.8% | National focus in Paris, Lyon, Marseille, Toulouse | Medium term (2-4 years) |
| Rising urban congestion charges push shared mobility | +1.5% | Île-de-France core, spillover to Lyon, Nice, Bordeaux | Short term (≤ 2 years) |
| Widespread smartphone and 5G penetration | +1.2% | National | Short term (≤ 2 years) |
| Growing corporate adoption of mobility-as-a-service subscriptions | +1.4% | National, early gains in Paris, Lyon, Toulouse business districts | Medium term (2-4 years) |
| Integration of ride-hailing platforms with public-transit apps | +1.0% | Île-de-France, Lyon Métropole, Marseille Métropole | Medium term (2-4 years) |
| Expansion of electric-vehicle fleets in ridesharing | +1.6% | National, fastest in low-emission zones | Long term (≥ 4 years) |
| Source: Mordor Intelligence | |||
Government incentives for low-emission mobility
France channels EUR 50 million a year into its carpooling green fund, mandates 400,000 public chargers by 2030, and ties subsidies to Europe-assembled EVs.[1]“Loi d’Orientation des Mobilités,” Gouvernement, gouvernement.fr Platform fleets that meet zero-emission thresholds receive tax credits and EUR 100 driver bonuses per qualified shared ride, resulting in a 35% surge in BlaBlaCar registrations in 2024. Uber’s volume deal with BYD locks in discounted European-assembled vehicles, ensuring eligibility for the ecological bonus. Crit’Air diesel bans, covering Paris and 10 other low-emission zones, will take effect from January 2025, compelling operators to replace 18,000 affected vehicles or face EUR 10,000 penalties per unit annually. The resulting cost differential between compliant EV fleets and legacy diesel assets amplifies early-mover advantages in driver recruitment, pricing flexibility, and securing corporate contracts.
Rising urban congestion charges push shared mobility
Paris tripled SUV parking fees to EUR 18 per hour and introduced a périphérique car-sharing lane, which is expected to reduce single-occupancy commuter traffic by 15%. Lyon added a EUR 5 daily fee for non-resident cars entering its Presqu’île, exempting certified ride-hailing and carpooling trips. These local policies align with the EU Ambient Air Quality Directive, narrowing the economic gap between the operating costs of private cars and shared rides. Consumers now spend EUR 45 on a private trip from Paris’s 15th arrondissement to Charles de Gaulle versus EUR 30 for a shared ride. As congestion fees expand to Bordeaux and Nice, price elasticity continues to tilt demand toward the France ridesharing market.
Widespread smartphone and 5G penetration
Uber will deploy 25,000 of its 100,000 Europe-bound BYD EVs in France, targeting a 40% electric share by 2027 from 12% in 2024.[2]Barbara Lewis, “Uber Partners with BYD to Deploy 100,000 Electric Vehicles Across Europe,” Reuters, reuters.com Bolt financed 350 Tesla Model 3 cars at 30% below market lease rates, yielding 22% higher gross bookings per EV ride. HysetCo raised EUR 200 million (USD 226 million) in April 2024 to scale up to 10,000 hydrogen taxis by 2030, offering the advantage of five-minute refueling. The hurdle is infrastructure: only 12% of public chargers in Paris are fast units compatible with high-utilization fleets, and 46% of drivers lack access to home charging. Nevertheless, the LOM law’s 50% zero-emission fleet mandate by 2027 in cities with over 100,000 residents anchors long-term growth in electric bookings.
Growing corporate adoption of mobility-as-a-service subscriptions
French employers can now allocate up to EUR 600 per year in tax-exempt mobility budgets, marking a shift away from company car fleets. Uber for Business, Bolt Business, and BlaBlaCar Daily collectively service more than 2,000 corporate accounts, replacing reimbursement workflows with subscription packages that cut administrative overhead by 40% while meeting ISO 14001 reporting standards. Société Générale alone plans to retire 4,500 vehicles by 2026, redirecting EUR 300 per employee each month to on-demand ride credits. Platform dashboards that consolidate invoices, carbon metrics, and policy compliance are differentiating the France ridesharing market in the procurement cycles of large enterprises.
Restraints Impact Analysis*
| Restraint | (~) % Impact on CAGR Forecast | Geographic Relevance | Impact Timeline |
|---|---|---|---|
| Stringent labor classification regulations on gig workers | -1.2% | National, enforcement concentrated in Île-de-France | Short term (≤ 2 years) |
| Saturation in urban core markets limiting driver supply growth | -0.9% | Île-de-France, Lyon, Marseille | Medium term (2-4 years) |
| Escalating insurance premiums for ridesharing vehicles | -0.7% | National | Short term (≤ 2 years) |
| GDPR data-sharing compliance delays for MaaS integration | -0.5% | Small and mid-sized cities lacking robust IT infrastructure | Medium term (2-4 years) |
| Source: Mordor Intelligence | |||
Stringent labor classification regulations on gig workers
The EU Platform Work Directive 2024/2831 introduces a rebuttable presumption of employment, and France has already lifted the minimum driver wage to EUR 9.00 per hour plus employer social security contributions. Uber set aside EUR 45 million for potential reclassification liabilities, and Bolt froze new-driver onboarding in Paris pending legal clarity. The Autorité de la concurrence’s February 2025 opinion added further uncertainty by questioning collective-bargaining frameworks.[3]“Opinion on Collective Bargaining Agreements for Private-Hire Vehicle Drivers,” Autorité de la concurrence, autoritedelaconcurrence.fr Labor cost inflation of 20%-30% could lift average fares 12%-18%, compressing demand among price-sensitive riders and dampening the France ridesharing market’s near-term growth trajectory.
Saturation in urban core markets limiting driver supply growth
Île-de-France hosts 80% of France’s 61,500 taxis and 40,000 private-hire vehicles, and the region rejected new license issuances in 2024. Driver churn above 40% in Paris forces platforms to raise incentives by 25% annually to maintain coverage. Heetch and Karos therefore pivot toward peri-urban communes where taxi supply is sparse, posting 60% booking growth in 2024. While geographic diversification mitigates the constraint, limited driver availability in Paris and Lyon still caps peak-hour surge capacity, slowing the France ridesharing market’s ability to absorb incremental demand.
*Our forecasts treat driver/restraint impacts as directional, not additive. The impact forecasts reflect baseline growth, mix effects, and variable interactions.
Segment Analysis
By Service Type: Subscription Models Gain Corporate Traction
Subscription mobility packages are growing at a 10.05% CAGR, eclipsing the overall France ridesharing market. Urban ride-hailing services retained a 53.02% share in 2025, primarily driven by high utilization in Paris, Lyon, and Marseille. BlaBlaCar’s long-distance carpooling continues to benefit from the national EUR 100 driver bonus, while micro-transit shuttles fill suburban gaps in Toulouse and Nantes.
Corporate demand reshapes volume distribution: firms replacing fleet allowances with ride credits pump steady traffic into subscription tiers, stabilizing revenue cycles and increasing operator bargaining power with vehicle lessors. In contrast, legacy on-demand taxi segments struggle under licensing caps. Subscription bundles that merge ride-hailing with rail and bus tickets are gaining traction inside public-transit apps, embedding France ridesharing market services into daily commuter routines.


By Vehicle Type: Electric Vehicles Lead Fleet Transformation
Cars captured 71.55% of the France ridesharing market share in 2025, but electric bookings are accelerating at a 9.98% CAGR as Crit’Air bans remove older diesel vehicles. Two-wheeler shares spike during congestion peaks yet remain a niche at 8%. Vans and MPVs serve growing airport and corporate shuttle demand.
Subsidized EV leasing, guaranteed charger access, and lower maintenance costs tilt driver economics toward battery-electric options, while hydrogen taxis exploit five-minute refuels to maximize utilization. However, uneven fast-charging coverage keeps range anxiety high outside Paris. The mixed fleet composition is therefore likely to persist, although France ridesharing market size contributions from EV categories will continue to expand through 2031.
By End User: Corporate Clients Drive Premium Segment Growth
Individual consumers retained 79.05% of the booking value in 2025, while corporate accounts are pacing growth at a 9.72% CAGR. Business travelers book longer distances, request higher-class vehicles, and prioritize carbon reporting, lifting average ticket sizes.
Tax-exempt mobility budgets worth up to EUR 600 per employee, combined with in-app ISO 14001 dashboards, cater to corporate procurement needs. Meanwhile, individual riders exhibit greater price sensitivity, prompting platforms to deploy dynamic pricing and loyalty credits. The shift denotes a gradual reweighting of France ridesharing market size toward premium corporate revenue pools.
By Payment Mode: Digital Wallets Dominate Transaction Volume
Card and wallet transactions accounted for 68.92% of the booking value in 2025 and are growing at a 9.85% CAGR, driven by one-tap integrations with Apple Pay, Google Pay, and PayPal. Cash usage continues to decline, particularly in Paris, Lyon, and Marseille, where smartphone penetration exceeds the national average.
Subscription invoicing streamlines monthly settlements for corporate mobility packages, deepening stickiness while shrinking financing friction. Platforms that automate biometric authentication comply with the EU Payment Services Directive 2 without adding noticeable user friction, further entrenching digital payment behaviors across the France ridesharing market.
Geography Analysis
Île-de-France generated roughly 64.70% of the national booking value in 2025, driven by 12 million daily commuters and the presence of dense corporate headquarters. Dedicated car-sharing lanes and high SUV parking fees exacerbate shared-ride economics, while the Crit’Air diesel ban prompts rapid turnover of the EV fleet.
Lyon, Marseille, and Toulouse collectively account for 20.45% of bookings and are growing faster than the national rate thanks to lower saturation and municipal incentives. Lyon’s congestion fee and Marseille’s multimodal RTM app integration channel discretionary trips into shared modes, reinforcing regional demand.
Smaller cities, such as Nice, Bordeaux, and Nantes, account for the remaining 14.85% of booking value, which is constrained by higher car ownership and lower public transit integration. National 5G coverage gaps in Creuse and Lozère limit real-time matching, but the EUR 50 million carpooling green fund aims to stimulate supply in peri-urban zones. Platforms expanding beyond Paris hedge against core-city saturation and unlock untapped growth pockets in the France ridesharing market.
Regulatory Landscape
France ridesharing is regulated under the Transport Code, with core frameworks set by the 2014 Thevenoud Law and the 2016 Grandguillaume Law. These laws preserve taxis exclusive right to street hail (maraude) while confining VTC activity to prior reservation. All VTC operators must register on the Registre des exploitants de VTC (REVTC) for renewable five-year periods, and drivers must hold a professional card obtained through an examination process overseen by the Chambers of Trades and Crafts (CMA), alongside required medical authorization, insurance, and vehicle signage.
Regulatory tightening in 2026 increased enforcement risk and compliance workload. A law on combating social and fiscal fraud published in the Journal Officiel on June 26, 2026 increased maximum penalties for illegal practice (such as operating without registration or a professional card) to 3 years imprisonment and EUR 45,000 in fines. It also introduced new constraints, including prohibiting sub-letting of VTC operator registrations. Separately, the Autorite des relations sociales des plateformes d emploi (ARPE) continues to structure social dialogue and sector rules on transparency and account deactivation. Meanwhile, the Autorite de la concurrence has highlighted competition-law sensitivities around collective bargaining in its February 2025 opinion, leaving uncertainty around labor-cost frameworks.
Value Chain Analysis
The France ridesharing value chain begins with digital platforms that supply the marketplace layer, including app, matching, routing, dynamic pricing, payments, fraud controls, and customer support. This is followed by supply-side onboarding and compliance covering REVTC operator registration, professional driver card, insurance, and vehicle conformity. Upstream enablers include vehicle OEMs and lessors, fleet managers, insurers, charging and hydrogen-fueling ecosystems for low-emission fleets, and payment and identity providers supporting card and wallet flows and subscription invoicing. Downstream distribution increasingly runs through MaaS and public-transit integrations in large metros, supported by corporate portals that manage employee mobility budgets and consolidated invoicing.
Cost and performance bottlenecks concentrate in labor economics and regulatory reporting, vehicle financing, and insurance, alongside infrastructure constraints for high-utilization EV operations. ARPEs April 2025 analysis of activity indicators for 11 VTC platforms (including Uber, Bolt, Heetch, and others) reported a decline in real gross hourly income for drivers between 2023 and 2024, along with higher waiting times between jobs. The findings point to pressure points in marketplace balance and driver retention. As compliance expectations under LOM-era worker transparency rules and newer anti-fraud controls rise, platforms are shifting more spend toward automated verification, reporting, and risk controls, while pursuing fleet transition partnerships intended to improve total cost of ownership and access to low-emission zones.
Competitive Landscape
Market concentration remains moderate, with Uber, BlaBlaCar, and Heetch controlling around 55% of booking value. Uber’s discounted BYD supply and GPT-4o features drive scale efficiencies and user retention. BlaBlaCar expands into coach tickets via its Obilet acquisition, broadening its customer funnel and cross-selling opportunities. Heetch leverages low-commission structures to penetrate suburban zones, while Karos and COMIN exploit niches in peri-urban carpooling and low-cost driver commissions.
Uber and WeRide operate geofenced robotaxi pilots, while Bolt and Mobileye aim to launch driverless fleets by 2026. Regulatory sandboxes under the LOM law facilitate early commercialization, albeit within controlled zones. Insurance costs, labor reclassification, and charger density remain strategic pressure points that could reshape competitive hierarchies in the France ridesharing market over the next five years.
France Ridesharing Industry Leaders
Uber Technologies Inc.
Heetch SAS
Bolt Technology OÜ
Via Transportation Inc.
Lyft Inc.
- *Disclaimer: Major Players sorted in no particular order

Market Opportunities and Future Outlook
Low-emission fleet scaling remains a primary whitespace, particularly where municipal constraints and corporate procurement needs overlap. The LOM-linked trajectory toward higher zero-emission shares in larger cities, Paris-specific operating economics such as higher SUV parking fees and dedicated lanes, and targeted fleet programs provide concrete levers. Uber has outlined large EV allocation plans for France through its BYD sourcing, and in April 2026 it added a hydrogen pathway by investing into HysetCo to integrate hydrogen taxis into the Uber Paris platform. These steps create opportunities for OEMs, lessors, charging operators, and hydrogen ecosystem players to package vehicle, energy, and maintenance bundles aligned with high-duty-cycle ride-hailing economics.
A second opportunity area is compliance and workforce infrastructure that reduces friction under tightening social and fiscal controls. The June 26, 2026 anti-fraud law increases penalties and strengthens oversight for illegal practice. In parallel, ARPEs indicator tracking and ongoing debate around platform-worker status raises the value of automated onboarding, eligibility checks, income reporting, and auditable trip and payout records. Corporate subscription mobility also expands demand for enterprise-grade dashboards covering invoicing, policy controls, and carbon accounting, especially when integrated with MaaS and public-transit apps. At the same time, platform consolidation and portfolio rationalization, including BlaBlaCar announcing the closure of its bus operations in France by end-2026, highlights the commercial advantage of concentrating capital on higher-velocity digital marketplaces rather than asset-heavy segments.
Recent Industry Developments
- May 2026: Getaround Europe completed its merger with GoMore, forming a larger peer-to-peer carsharing network across 11 countries with France as a core revenue market. The combined footprint strengthens supply density and utilization, and increases cross-traffic between carsharing and ridesharing use cases (first-mile/last-mile and weekend replacement trips). It also raises the competitive bar for mobility super-app positioning and partnership discussions with MaaS aggregators.
- April 2026: Uber announced an investment via convertible bond into HysetCo to support integrating nearly 2,000 hydrogen vehicles into the Uber Paris platform over five years. The initiative broadens the platforms low-emission supply options in a city where regulatory and pricing signals are pushing fleet renewal. It also increases demand for hydrogen refueling access and fleet-operating services that can sustain high vehicle uptime.
- May 2025: Uber and WeRide entered a commercial agreement to pilot Level 4 autonomous ride-hailing services in select French cities under regulatory sandboxes. The partnership formalized a pathway for geofenced AV operations within France mobility framework and accelerated technical validation in complex urban environments. It also intensified competitive differentiation around safety, mapping, and regulatory readiness as platforms pursue future unit-economics improvements.


Research Methodology Framework and Report Scope
Market Definition and Coverage
For this study, the France ridesharing market is defined as the revenue generated from app or web-enabled ride bookings and shared trip services completed within France, including passenger fares and platform commissions that are tied to those trips.
Scope exclusions: We exclude private car ownership costs, public transit ticketing revenue, and micromobility rentals that are not priced as ridesharing trips.
Segmentation Overview
- By Service Type
- Urban Ride-Hailing
- Long-Distance Carpooling
- Micro-Transit Shuttle
- Subscription-Based Mobility Packages
- By Vehicle Type
- Cars
- Two-Wheelers
- Vans and MPVs
- Electric Vehicles
- By End User
- Individual Consumers
- Business and Corporate Clients
- By Payment Mode
- Card and Wallet
- Cash
- Subscription Invoicing
Data Sources, Market Sizing, and Validation
Desk Research
Desk research started with public mobility and economic datasets that help anchor demand and pricing trends in France. We reviewed government sources such as INSEE for population and income indicators, the French Ministry of Ecological Transition for transport and mobility context, and Eurostat for cross-checks on travel activity and inflation-linked inputs. We also used open regulatory and sector references such as European Commission mobility pages, plus academic and peer-reviewed studies that discuss ride pooling adoption and urban mobility behavior.
On the supply side, we reviewed company filings and investor materials to understand take rates, service launches, and pricing direction, then compared those signals with what interviewees later confirmed. Where required, we used paid subscriptions that provide company financials and news, patent databases, and import and trade data to reduce gaps on technology adoption, fleet shifts, and macro indicators that affect trip volumes. The sources listed here are illustrative, and we also used other public references to collect data, validate assumptions, and clarify open questions.
Primary Interviews and Surveys
Primary work focused on validating what drives ridesharing revenue in France, especially how trip frequency, average fare per trip, and platform commission patterns change across major cities versus smaller urban areas. We spoke with a mix of platform-side, fleet and driver-side, and corporate mobility stakeholders, then used short surveys to sanity check adoption trends, pooling mix, and seasonality impacts before finalizing assumptions.
Distribution of primary research fieldwork respondents
| Company type | Respondent position | Region |
|---|---|---|
| Top tier: 33% | CXOs: 19% | |
| Mid tier: 47% | Functional/Unit leaders: 31% | |
| Smaller Players: 20% | Managers: 50% |
Market-Sizing & Forecasting
The market size is built using a top-down approach, where France travel and mobility activity is translated into a ridesharing demand pool, then converted into annual revenue using pricing and commission logic. To keep results grounded, we corroborate with selective bottom-up checks, such as sampled average fare per trip multiplied by estimated trips, along with channel checks on commission ranges and pooling share.
Key inputs used in the model include active user base and penetration trends, trips per user per month, the mix of solo rides versus pooled rides, average trip distance and time (which influences fare levels), and commission or take rate trends. We also incorporated inflation effects on fares and driver payouts. When variables are not directly observable, we fill gaps using ranges gathered from interviews and public references, then set a conservative midpoint and stress-test it in scenarios.
For forecasting, we run scenario analysis around three practical levers: pace of regulatory changes, fuel and electricity cost direction, and adoption of pooled options in dense cities. The forward path is aligned with interview consensus on how quickly pricing normalizes and how supply availability changes, before locking the final year values.
Data Validation & Update Cycle
To validate outputs, we compare the modeled revenue curve against independent signals such as reported mobility demand trends, inflation and wage movement, and observable changes in service availability across major French cities. When we see large variances, we recheck the assumptions behind trip frequency, fares, and commission rates, then complete a second analyst review before sign-off.
The report is refreshed annually, and interim updates are triggered when material events occur, such as a major policy change, a sharp fare shift, or a meaningful change in pooling adoption. Before delivery, an analyst does a fresh pass on key inputs so clients receive the latest updated view.
Mordor Intelligence's France Ridesharing Market Sizing Compared With Other Published Estimates
Published market numbers can vary because firms do not always count the same revenue streams, and they may also use different base years and currency timing. Differences also come from how trip volumes are reconstructed and how aggressive the assumptions are on pricing growth.
For France ridesharing, the biggest gap drivers usually sit around whether long-distance carpooling and corporate mobility programs are included, whether the metric is consumer spend versus platform revenue, and how pooling discounts are treated in average fare calculations. Some sources also rely on user and ARPU-style metrics, which can understate value when price tiers, airport trips, and dynamic pricing are rising.
Benchmark comparison
| Source | Market Size | Gaps in Research Methodology |
|---|---|---|
| Mordor Intelligence | USD 2.64 B (2025) | |
| Digital Statistics Publisher A | USD 1.65 B (2024) | Often presented as ride-hailing revenue only, with a user and ARPU lens, which can exclude corporate programs and may not fully capture pooling mix and dynamic fare variability across cities. |
| Press Release Publisher B | USD 2.47 B (2027) | Reports the absolute growth amount over a period, not a single-year market value, so it is not directly comparable unless the starting-year size and scope are made explicit. |
The table shows that scope and metric choices explain most of the spread, not only the forecast view. When corporate usage and broader ridesharing formats are counted as completed trip revenue inside France, the size tends to land higher, which is the treatment applied by Mordor Intelligence.


Key Questions Answered in the Report
How large is the France ridesharing market in 2026?
The market is valued at USD 2.88 billion in 2026 and is forecast to reach USD 4.44 billion by 2031.
What is driving growth in French corporate ridesharing demand?
Tax-exempt mobility budgets of up to EUR 600 per employee and the shift away from company-car fleets are accelerating corporate subscriptions that bundle ride-hailing, carpooling, and micro-transit credits.
How will new labor rules affect ridesharing platforms?
The EU Platform Work Directive could raise driver labor costs by 20%-30%, potentially lifting fares 12%-18% and pressuring platform margins.
What role do electric vehicles play in fleet expansion?
EV bookings are growing at a 9.98% CAGR, supported by Crit’Air diesel bans, subsidy eligibility for Europe-assembled models, and volume deals such as Uber’s 25,000 BYD cars allocated to France.
Which cities outside Paris are showing the fastest ridesharing growth?
Lyon, Marseille, and Toulouse collectively outpace the national average thanks to congestion fees, transit-app integration, and municipal support for shared mobility services.
How are payment preferences changing among French riders?
Card and wallet payments dominate 68.92% of booking value and are expanding at a 9.85% CAGR, while cash usage continues to decline, especially in major urban centers.
Page last updated on:






