
Market Overview
| Study Period | 2019 - 2031 |
|---|---|
| Forecast Data Period | 2026 - 2031 |
| Base Year Market Size (2025) | USD 30.56 Billion |
| Market Size (2026) | USD 34.17 Billion |
| Market Size (2031) | USD 54.36 Billion |
| Growth Rate (2026 - 2031) | 11.83% CAGR |
| Market Concentration | Medium |
Major Players
*Disclaimer: Major Players sorted in no particular order Image © Mordor Intelligence. Reuse requires attribution under CC BY 4.0. |
|
France Electric Vehicles Market Analysis by Mordor Intelligence
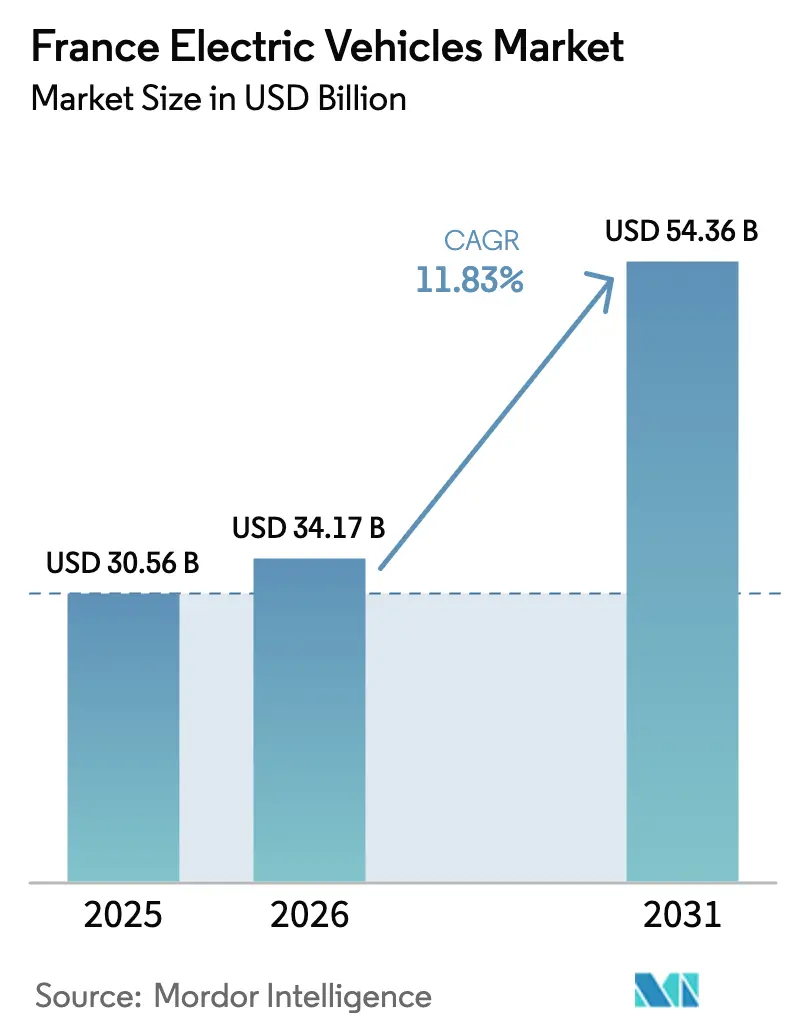
The French electric vehicle market size is expected to grow from USD 30.56 billion in 2025 to USD 34.17 billion in 2026 and is forecast to reach USD 54.36 billion by 2031 at 11.83% CAGR over 2026-2031. Incentives like the ecological bonus, an add-on for European-sourced battery cells, and reduced road-tax bands are narrowing purchase price gaps and boosting demand. The installation of rapid chargers, large-scale battery-cell production, and corporate fleet mandates have created economies of scale, reducing the total cost of ownership. Battery packs now priced below a certain threshold are hastening the shift towards parity with traditional cars. Additionally, domestic gigafactories in Hauts-de-France and Nouvelle-Aquitaine provide OEMs a buffer against supply shocks. Partnerships between automakers, utilities, and mobility platforms are not only accelerating the electrification of shared fleets but also opening up new revenue avenues, including vehicle-to-grid services.
Key Report Takeaways
- By propulsion type, battery-electric vehicles account for 67.65% of the French electric vehicle market share in 2025; fuel-cell electric vehicles are forecast to grow at a 18.37% CAGR through 2031.
- By vehicle type, passenger cars accounted for 95.26% of the French electric vehicle market in 2025, while heavy trucks are expected to record the highest projected CAGR of 17.03% from 2026 to 2031.
- By charging type, AC units with a capacity of 22 kW or higher held a 73.92% share in 2025; ultra-fast DC chargers with a capacity above 150 kW are expected to expand at a 13.62% CAGR through 2031.
- By end-use, private ownership accounted for 78.88% of the 2025 volume, while shared mobility is projected to grow at an 18.56% CAGR through 2031.
- By battery capacity, 50–75 kWh packs controlled 49.04% share in 2025; packs above 75 kWh are expected to post a 13.61% CAGR through 2031.
Note: Market size and forecast figures in this report are generated using Mordor Intelligence’s proprietary estimation framework, updated with the latest available data and insights as of January 2026.
France Electric Vehicles Market Trends and Insights
Drivers Impact Analysis*
| Driver | (~)% Impact on CAGR Forecast | Geographic Relevance | Impact Timeline |
|---|---|---|---|
| Robust Purchase and Tax Incentives | +2.8% | Île-de-France, Auvergne-Rhône-Alpes, Provence-Alpes-Côte d'Azur, Hauts-de-France | Short term (≤ 2 years) |
| Fast-Charger Roll-Out | +2.3% | Nouvelle-Aquitaine, Occitanie, Grand Est, Pays de la Loire, Bretagne | Medium term (2-4 years) |
| Lithium-Ion Battery Cost | +2.0% | Hauts-de-France, Nouvelle-Aquitaine, Auvergne-Rhône-Alpes | Medium term (2-4 years) |
| Corporate Fleet Electrification | +1.5% | Île-de-France, Auvergne-Rhône-Alpes, Provence-Alpes-Côte d'Azur | Short term (≤ 2 years) |
| Second-Life Battery Resale | +0.9% | Centre-Val de Loire, Hauts-de-France, Nouvelle-Aquitaine | Long term (≥ 4 years) |
| Vehicle-to-Grid Revenue Streams | +0.7% | Île-de-France, Auvergne-Rhône-Alpes, Provence-Alpes-Côte d'Azur | Long term (≥ 4 years) |
| Source: Mordor Intelligence | |||
Robust Purchase and Tax Incentives
In 2025, government rebates for qualifying battery electric cars effectively reduced up-front costs and boosted registrations. A social-leasing initiative, set at EUR 100 (USD 117.87) monthly, enabled 50,000 low-income households to access electric vehicles, especially in urban areas. Localized cell production at Stellantis ACC and Verkor plants not only satisfies the incentive's origin stipulation but also strengthens supply chains. Although bonus amounts will decrease post-2026, falling battery prices are expected to counterbalance the diminishing subsidies. This policy framework not only propels immediate sales but also steers the market towards sustainable cost competitiveness in the long run.
Nationwide Fast-Charger Roll-Out
Public-private grants underpin corridor and workplace charging, lifting installed ports to roughly 147,000 by late 2025. Ultra-fast DC hubs from Mobilize and other networks triple charging speed for 75 kWh packs, improving convenience for long-distance travel. Regional disparities persist, yet the planned 25,000 ultra-rapid ports by 2030 will narrow gaps along the Atlantic and Mediterranean highways. Dynamic in-road wireless charging pilots on the A10 near Paris validate solutions for heavy trucks at highway speed. Sustained expansion prevents charging queues from constraining fleet growth in high-penetration zones.
Lithium-Ion Battery Cost Curve Compression
Pack prices fell significantly in 2025, breaching USD 115/kWh and bringing total-cost parity within sight for mass-market cars by 2027. Automakers shift toward lithium-iron-phosphate chemistries that trade energy density for affordability in models such as the Scenic E-Tech. Domestic gigafactories scaling from 13 GWh to 40 GWh mitigate currency and freight risk. Supply-chain initiatives, including a nickel-cobalt refinery scheduled for 2028, aim to localize upstream value and buffer volatility in raw materials. The result is a steady erosion of sticker-price premiums versus internal-combustion vehicles.
Corporate Fleet Electrification Mandates
The mobility-orientation law obliges fleets with more than 100 vehicles to reach a 40% low-emission share by 2027 and 70% by 2030[1]"LOM Law: everything you need to know about renewing vehicle fleets", SoFLEET, sofleet.eu. Compliance drives bulk procurement of vans and trucks, spurring OEM volume and stabilizing residual values. Heavy-truck adoption is accelerating in low-emission zones such as Paris, Lyon, and Marseille, where diesel restrictions are tightening. Dedicated truck-stop charging and 400-kilometer battery ranges enable regional logistics without route disruption. Non-compliant fleets face fines and reputational risk, reinforcing the conversion trend.
Restraints Impact Analysis*
| Restraint | (~)% Impact on CAGR Forecast | Geographic Relevance | Impact Timeline |
|---|---|---|---|
| Higher EV Sticker Price vs ICE | -1.8% | Hauts-de-France, Nouvelle-Aquitaine, Bretagne, Normandie | Short term (≤ 2 years) |
| Uneven Rural Charging Coverage | -1.2% | Bretagne, Normandie, Centre-Val de Loire, Bourgogne-Franche-Comté | Medium term (2-4 years) |
| Supply Bottlenecks | -0.8% | Hauts-de-France, Nouvelle-Aquitaine, Auvergne-Rhône-Alpes | Long term (≥ 4 years) |
| Dealership Capability Gap | -0.5% | Occitanie, Grand Est, Pays de la Loire | Short term (≤ 2 years) |
| Source: Mordor Intelligence | |||
Higher Up-Front EV Sticker Price vs ICE
Average battery-electric cars retailed a significant price premium over internal-combustion equivalents. Incentives close only part of the gap for households in regions where the median income trails the national average by more than 10%. Entry-level models priced below EUR 25,000 (USD 29,467) capture a limited share, leaving most buyers in higher price bands. Automaker price cuts signal competitive pressure yet threaten margins. Until battery prices fall near USD 100/kWh, price-sensitive consumers, especially in rural departments, will postpone purchases.
Uneven Rural Charging Coverage
Department-level charging density varies widely, with several low-population areas hosting fewer than 150 chargers. Highway and workplace grant programs favor urban corridors, leaving secondary roads underserved. Range anxiety discourages rural households that rely on public infrastructure rather than home parking. The high capital costs of ultra-fast DC units limit private investment in sparsely populated areas. Unless municipal budgets or cooperative models bridge the gap, regional adoption will lag.
*Our forecasts treat driver/restraint impacts as directional, not additive. The impact forecasts reflect baseline growth, mix effects, and variable interactions.
Segment Analysis
By Propulsion Type: Hydrogen Gains as BEVs Plateau
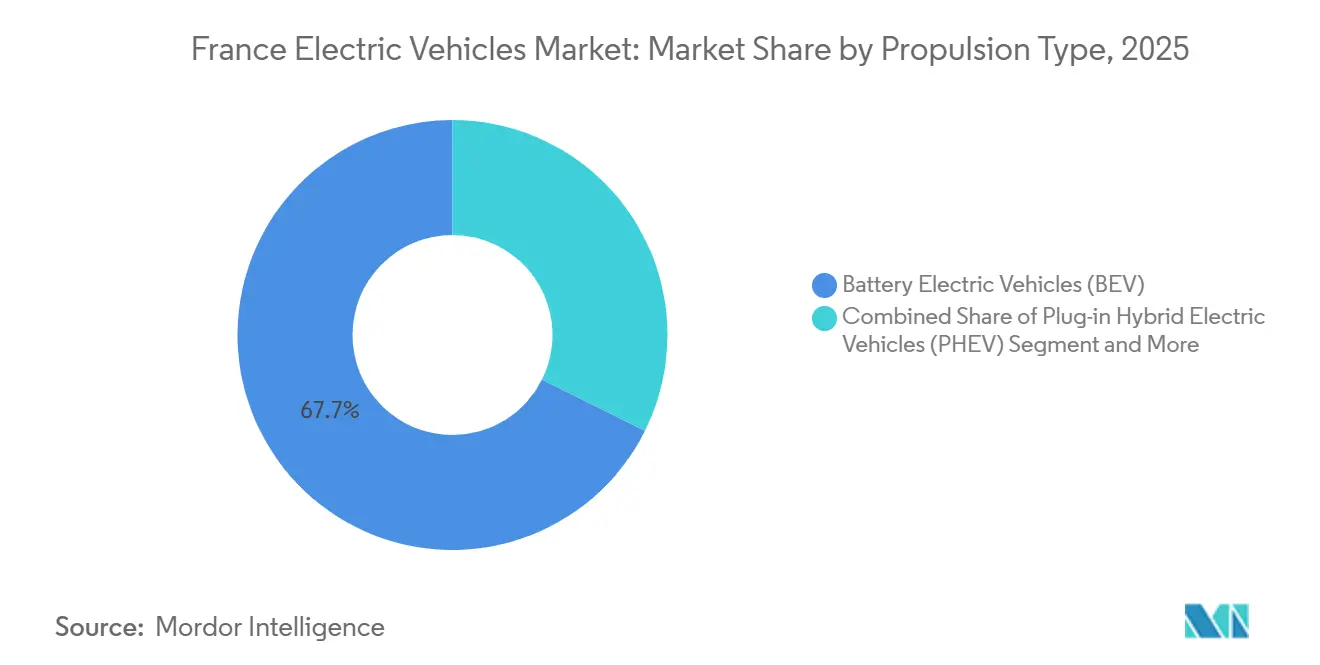
Battery-electric vehicles commanded a 67.65% share in 2025, on the back of dense charging grids in metropolitan areas. Fuel-cell electric vehicles scale at an 18.37% CAGR, supported by EUR 9 billion in hydrogen funding and a target of 1,000 refueling stations by 2030. Domestic production of fuel-cell van models at Hordain offers a 400-kilometer range with five-minute refueling, making it suitable for logistics operators. Plug-in hybrids decline as buyers migrate to pure-battery formats once infrastructure anxiety subsides.
Fuel-cell adoption centers on heavy-duty and high-utilization fleets where payload preservation outweighs hydrogen costs. Passenger fuel-cell models remain scarce, yet supplier capacity for stacks and tanks has matured. Government station targets imply investment of EUR 3-5 million (USD 3.54-5.89 million) per site, challenging but achievable if electrolyzer projects align with surplus renewable generation. Hydrogen, therefore, supplements rather than displaces the dominant battery segment in the French electric vehicle market.


By Vehicle Type: Heavy Trucks Outpace Passenger Surge
Passenger cars accounted for 95.26% of 2025 registrations, driven by broad model variety, falling battery prices, and consumer familiarity with home charging. Heavy trucks, starting from a low 2,000-unit base, post a 17.03% CAGR as freight companies navigate low-emission zones in Paris, Lyon, and Marseille, triggering mandatory diesel phase-outs. High-capacity chargers sited every 60–80 kilometers along the A7 and A10 corridors reduce dwell times to 45 minutes, making 400-kilometer electric drayage runs commercially viable. Municipal subsidies for electric refuse, construction, and delivery vehicles further widen the addressable market. As a result, freight electrification begins to narrow the historical gap in volume between commercial and passenger demand in the French electric vehicle market.
Light commercial vehicles, including the Renault Kangoo E-Tech and Citroën ë-Berlingo, appeal to artisans who can charge vans overnight at depots in Hauts-de-France and Nouvelle-Aquitaine. City and inter-city buses, powered by Alstom’s Aptis and Iveco’s E-Way platforms, reached 0.8% share as municipalities enforced zero-emission public-transport targets. Rapid truck uptake is attracting battery-leasing models that capex-shift packs off carrier balance sheets and guarantee end-of-life value recovery. Truck manufacturer Scania has revealed that its electric trucks are expected to start using the commercially available Megawatt Charging System (MCS) in early 2026[2]"Scania launches MCS rapid charging solution at EVS38 – a new era for heavy electric transport", Scania. Meanwhile, dedicated pilots for the MCS, set for 2026, aim to reduce dwell times to under 30 minutes, paving the way for genuine long-haul electrification. Together, these developments hint at a significant boost for the freight segments in France's electric vehicle market.
By Charging Type: Ultra-fast Infrastructure Emerges as Growth Leader
AC charging above 22 kW held a 73.92% share in 2025 because its average hardware cost fits residential, workplace, and curbside budgets. Ultra-fast DC ports over 150 kW deliver a 13.62% CAGR, enabling 75 kWh packs to reach approximately 80% state of charge in under 20 minutes and supporting high-turnover business models such as ride-hailing. Highway clusters along the Paris-Lyon-Marseille corridor reduce intercity travel times and support the use of electric trucks. The expanding network also anchors tourist flows toward Provence-Alpes-Côte d’Azur and Nouvelle-Aquitaine, where seasonal peaks once strained slower public chargers. Consequently, charging infrastructure diversity widens the market’s demographic reach while sustaining balanced growth.
Dynamic in-road wireless pilots on the A10 confirm the technical feasibility of continuous charging at highway speeds, though capital intensity delays large-scale deployment. AC remains the default for daily residential and workplace cycles, benefiting from lower tariffs and ample dwell time. At the same time, DC ultra-fast serves time-critical travel segments that demand quick turnarounds. New tariff structures that reward off-peak charging encourage users to split energy intake between slow overnight top-ups and rapid daytime boosts. Sustained roll-out of both technologies will underpin seamless nationwide coverage for the France electric vehicle market.
By End-Use: Shared Mobility Scales Fastest
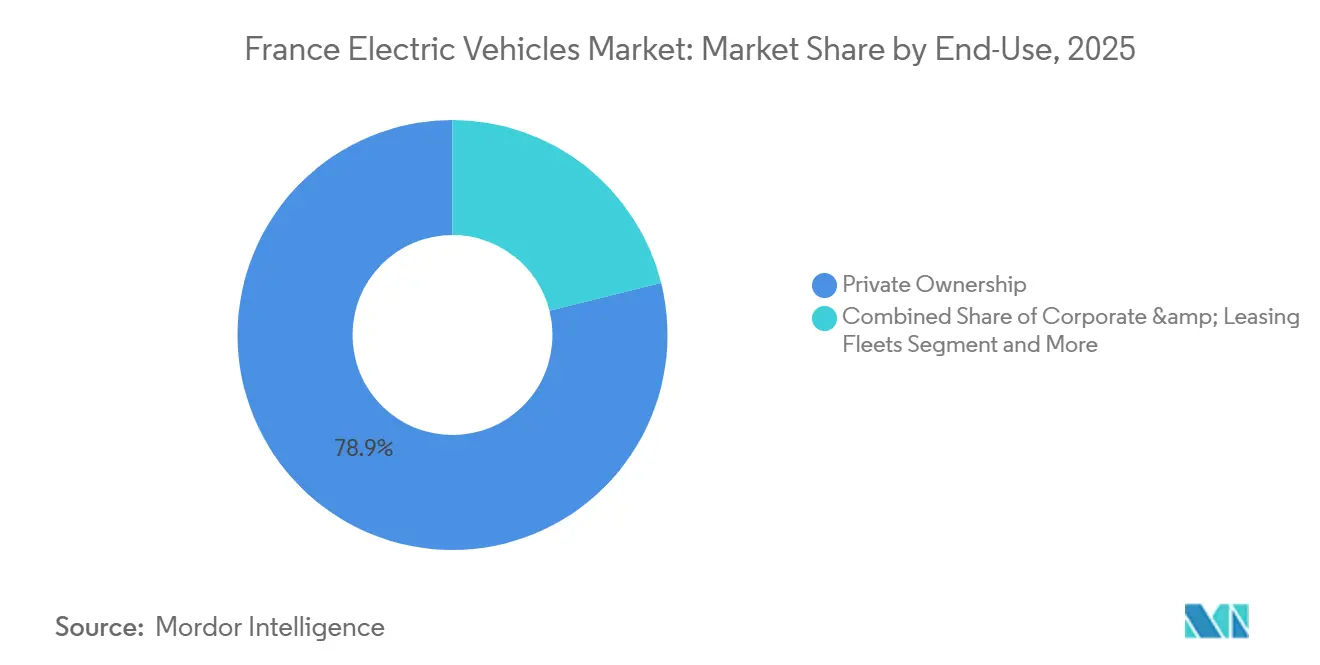
Private Ownership retained a 78.88% share in 2025, buoyed by strong household demand in Île-de-France and Auvergne-Rhône-Alpes, where public charging density is significantly high. Corporate leasing fleets face quotas that climb to 70% low-emission share by 2030, propelling bulk orders for vans and pool cars. Government and municipal fleets accounted for 4.5%, driven by clean-air mandates covering taxis, refuse trucks, and public-service vehicles. Shared mobility is projected to grow fastest as app-based operators expand electric fleets to cut operating costs and qualify for city access perks. This mix demonstrates the market’s shift from early-adopter households to more diversified, utilization-heavy customer groups.
Ride-hailing platforms in Paris and Lyon offer electric-only booking options, attracting environmentally conscious passengers who are willing to pay a modest fare premium. Car-sharing schemes leverage discounted residential parking licenses and congestion charge exemptions, allowing fleets to scale profitably in high-density districts. Peer-to-peer rental apps add idle, privately owned EVs to the supply pool, boosting utilization rates and soaking up residual capacity. Government fleet commitments guarantee a robust secondary market for three- to five-year-old EVs, supporting residual values and lowering lease prices for subsequent owners. Together, these factors accelerate the transition toward service-based mobility models within the France electric vehicle market share landscape.
By Battery Capacity: Larger Packs Gain Share
Battery packs of 50–75 kWh held 49.04% share in 2025, balancing 350- to 450-kilometer range with price points near EUR 35,000 (USD 41,254) for mainstream buyers. Sub-EUR 30,000 (USD 35,360) models like the upcoming Renault 5 leverage lithium-iron-phosphate cells to position within this sweet spot. Packs above 75 kWh post a 13.61% CAGR as premium SUVs and executive sedans demand 550-kilometer ranges and rapid 250 kW charging capability. Cities with dense ultra-fast infrastructure, notably Paris and Marseille, exhibit higher uptake of these larger-capacity vehicles. The tiered battery landscape, therefore, aligns closely with regional income gradients and charging network maturity.
By 2027, ongoing innovations in cell chemistry are set to drive the cost of mid-range kWh packs below EUR 100 (USD 117.87) per kWh, solidifying their central role in the French electric vehicle market. OEMs are delving into high-manganese and semi-solid electrolyte formats, eyeing substantial energy-density boosts without the use of cobalt. In Île-de-France, premium buyers are opting for larger kWh packs, ideal for long-distance commutes and trips to second homes in Provence or Brittany. Meanwhile, micro-city cars equipped with smaller kWh packs cater to low-income, urban-centric users prioritizing sticker price over range. These micro-cars gain added traction from the EUR 100 (USD 117.87) monthly social-leasing program. This dynamic has birthed a three-tier capacity structure, adeptly aligning with France's varied mobility patterns.
Geography Analysis
Île-de-France captured the majority of 2025 registrations due to incomes significantly above the national median and over 25,000 public charging ports. Zero-emission zone mandates in Paris and the presence of abundant corporate headquarters create a virtuous cycle of private and fleet demand. Ultra-fast charger density supports high utilization among ride-hailing operators, while vehicle-to-grid pilots leverage the region’s tariff spreads. Auvergne-Rhône-Alpes benefits from electric power-train manufacturing clusters in Lyon and early adoption by local logistics fleets. High-altitude road networks around the Alps highlight the importance of range retention in cold conditions, prompting widespread installation of 150 kW chargers along the A43 and A48 motorways.
Provincial cities such as Grenoble incentivize curbside AC charging through discounted parking fees and expanded residential access. Provence-Alpes-Côte d’Azur's share is driven by tourist traffic and solar-rich grids that align with daytime charging economics. Coastal highway corridors host dense ultra-fast hubs, enabling long-range trips into neighboring Spain and Italy. Municipal fleet electrification in Marseille and Nice anchors public demand, while high solar generation creates intraday price volatility, maximizing vehicle-to-grid earnings.
Hauts-de-France, Nouvelle-Aquitaine, and Occitanie together accounted for 25% of volume, aided by ADVENIR-funded highway corridors yet constrained by rural charging gaps. Bretagne and Normandie lagged at under 10% combined share, reflecting low charger deployment in sparsely populated cantons. Targeted public funding schemes and community energy cooperatives aim to close these regional disparities and unlock consistent nationwide growth of the French electric vehicle market.
Regulatory Landscape
France has shifted EV consumer support from a direct ecological bonus to an Energy Savings Certificates (EEC) mechanism. The bonus for new passenger EVs ends on July 1, 2025, while related aid moves under the TRA-EQ-117 scheme. A reinforced Coup de pouce premium also includes an additional top-up since October 1, 2025 for vehicles assembled in Europe with European-made batteries, which ties affordability to localized supply chains.
Eligibility is governed by an environmental score framework set through ministerial decrees and orders from the Ministries responsible for Economy, Energy, Ecology, and Transport. Criteria updates are reflected in Ministerial Orders dated April 15, 2026 and July 15, 2026. Separately, the automotive sector strategic contract (CSF 2024-2027), signed May 6, 2024, formalizes state-industry coordination on the transition and aligns policy support with industrial and workforce priorities.
Value Chain Analysis
France's EV value chain covers vehicle design and assembly, battery cells and packs, charging hardware and services, and end-of-life reuse and recycling. Localization across upstream and midstream stages is being reinforced by the Northern France battery corridor, anchored by ACC's Douvrin gigafactory and Verkor's battery cell industrialization in Dunkirk, alongside AESC activity in the wider ecosystem. This helps OEMs and Tier-1 suppliers manage supply risks as production scales.
Materials processing is also moving closer to vehicle and cell clusters through the Neomat project (Orano and XTC New Energy) in Dunkirk, focused on cathode active materials (CAM) and precursors (PCAM). Industry coordination and capability building are supported by bodies such as PFA, CCFA, FIEV, CSIAM, and Avere-France, while workforce readiness is addressed through initiatives including the Battery Training Center in Douvrin and Renault Group's ReKnow University to reduce after-sales and high-voltage skill gaps.
Competitive Landscape
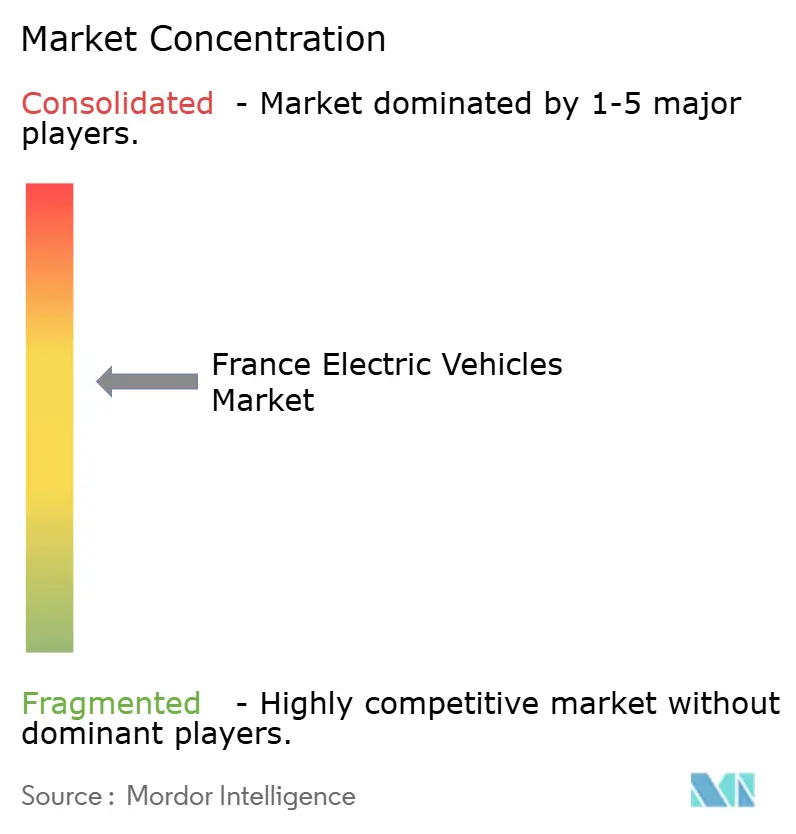
The France electric vehicle market exhibits moderate concentration, yet this oligopoly faces erosion from Chinese entrants BYD and MG Motor (SAIC), which rank France as their third-largest destination. Domestic leaders hold strong but face sharper import rivalry. Renault Group sold 277,297 electric units domestically in 2024 on the back of the Renault 5 and Megane E-Tech lines. Stellantis placed 452,900 electrified models across Peugeot, Citroën, and DS, and invested EUR 1.5 billion (~USD 1.7 billion) in Leapmotor International to accelerate the development of low-cost platforms.
Tesla sustains brand equity but trims margins through price cuts to defend share. Volkswagen and Hyundai trail domestic incumbents due to limited France-specific production, opening room for challengers. Chinese brands BYD and MG Motor evaluate domestic assembly sites, leveraging cost-competitive models to chip away at the premium defined by import duties.
White-space opportunities cluster below EUR 25,000 (USD 29,467), where only two high-volume models compete, and in passenger fuel-cell cars, where no mainstream entries exist. Technology differentiation now centers on bidirectional charging; Renault’s Mobilize offers certified vehicle-to-grid services, a feature absent from Tesla’s French line-up. Compliance with ISO 15118-20 from 2027 will level the technical playing field and reward OEMs that accelerate integration across model ranges.
France Electric Vehicles Industry Leaders
-
Volkswagen AG
-
Renault S.A.
-
Tesla Inc.
-
Hyundai Motor Group
-
Stellantis N.V.
- *Disclaimer: Major Players sorted in no particular order

Market Opportunities and Future Outlook
Affordability-led demand pools remain a key whitespace as France refines consumer support tools and eligibility rules. One concrete anchor is the renewal of the social leasing program effective July 16, 2026 for households below a defined reference tax income per share threshold (EUR 16,880). The program rewards OEMs and lessors that can package competitive monthly payments with compliant configurations, and it reinforces the importance of domestic and European sourcing in securing subsidized volumes.
Industrial clustering in Hauts-de-France supports opportunities across localized battery supply, materials, and vehicle production, particularly where capacity additions shorten supply lines and improve origin-compliant bill-of-materials. Market signals include ACC's Douvrin ramp at 13 GWh initial capacity with a stated target of 40 GWh by 2030, Verkor's 16 GWh cell factory opening in Dunkirk (December 2025) to supply Renault Group, and the Neomat CAM plant in Dunkirk scheduled for 2028 operations.
Recent Industry Developments
- July 2026: Volkswagen Group launches ID Polo Trend in France at starting price around €24,995 with EDF-backed Coup de Pouce support and related ecosystem push. The price competitive city EV expansion strengthens demand dynamics in the French market. The initiative intensifies competition with Renault in mass-market EVs and aligns local production and charging ecosystem.
- July 2026: Renault S.A. production milestone: one million Made-in-France electric vehicles since 2010. The milestone reflects domestic EV capacity and advances brand parity. It reinforces Renaults leadership in French EV output and supports domestic supply-chain investments and policy alignment.
- June 2026: Stellantis N.V. investment of over €1 billion in France to produce three new Peugeot models at Mulhouse plant, starting 2029. The investment signals major capacity expansion for electrified and conventional models in France. It strengthens Stellantis footprint in France and portfolio diversification into new EV/crossover platforms.


Research Methodology Framework and Report Scope
Market Definition and Coverage
For this methodology, the France electric vehicles market is defined as the sales value of new road vehicles sold in France that use an electric powertrain, counted at the vehicle level in USD terms.
Scope exclusions: Used vehicle transactions and the value of charging equipment and installation services are excluded from this market sizing.
Segmentation Overview
-
By Propulsion Type
- Battery Electric Vehicles (BEV)
- Plug-in Hybrid Electric Vehicles (PHEV)
- Fuel-Cell Electric Vehicles (FCEV)
-
By Vehicle Type
-
Passenger Cars
- Hatchback
- Sedan
- SUV (Sports Utility Vehicle)
- MUV (Multi Utility Vehicle)
-
Commercial Vehicles
- Light Commercial Vehicles (LCV)
- Heavy Trucks
- City & Inter-city Buses
-
Passenger Cars
-
By Charging Type
- AC (greater than equals) 22 kW (Normal)
- DC 22-150 kW (Fast)
- DC Less than 150 kW (Ultra-fast)
-
By End-use
- Private Ownership
- Corporate & Leasing Fleets
- Government & Municipal Fleets
- Shared Mobility (Car-share/Ride-hail)
-
By Battery Capacity
- Less than 50 kWh
- 50-75 kWh
- Above 75 kWh
Data Sources, Market Sizing, and Validation
Desk Research
Desk research starts with building a clean view of EV supply and demand signals in France, which later helps us avoid double counting and unrealistic price steps. We typically reference official registrations and stock indicators and then align them with policy timing, since incentives and eligibility rules can change the mix quickly.
For public sources, we rely on items such as national and EU vehicle registration and fleet statistics, releases from France's transport and energy ministries, European Alternative Fuels Observatory dashboards, and trade bodies that track charging points and the electrified parc. We also use company filings, investor presentations, and reputable press to understand model launches, pricing moves, and capacity plans, then cross check with paid subscriptions focused on company financials, patent filings, and shipment level import export data when it is relevant for sanity checks. The sources named here are illustrative only, and many other references are reviewed to collect data, validate figures, and clarify assumptions.
Primary Interviews and Surveys
Primary inputs come from structured expert interviews and surveys across the France EV ecosystem, including vehicle sales channels, fleet operators, and supporting service providers, so gaps left by public data can be closed with practical checks. We use these discussions to confirm adoption drivers, typical discounting, model mix shifts, and the timing of incentive changes, and then revisit outliers when respondents describe different dynamics by customer type.
Distribution of primary research fieldwork respondents
| Company type | Respondent position | Region |
|---|---|---|
| Top tier: 38% | CXOs: 15% | |
| Mid tier: 45% | Functional/Unit leaders: 41% | |
| Smaller Players: 17% | Managers: 44% |
Market-Sizing & Forecasting
Sizing begins with a top-down build where France registration volumes are reconstructed by electric powertrain category and then translated into value using observed average selling prices (ASPs) that reflect incentives and real world discounting. To keep the totals grounded, the output is then checked with selective bottom-up approximations, like sampled ASP times unit volumes for key vehicle classes and channel checks on quarterly sell-in and fleet buying cycles.
The model uses practical inputs that tend to move this market, such as annual BEV registrations, the passenger car versus light commercial vehicle mix, the eligible incentive amounts and thresholds, average battery size and its impact on vehicle pricing, and the public charging rollout pace that supports utilization confidence. For forecasting, scenario analysis is used so we can reflect alternative paths for incentive design, interest rates, and supply availability, and then those scenarios are filtered through what experts expect to be realistic in France over the forecast window. When a data point is missing for a small niche, it is filled through peer country reference ranges and then tightened using interview feedback, before totals are finalized.
Data Validation & Update Cycle
Validation is done in multiple passes, where the modeled market value is compared against independent signals like registration trends, price ladder movements, and policy timing, so unusual jumps can be explained and corrected. If a variance cannot be explained by mix or ASP changes, we re-check source alignment and, when needed, re-contact experts to confirm what changed in the market.
Before sign-off, the model and assumptions go through analyst review steps that look for currency conversion consistency, year-to-year continuity, and logical relationships between volumes and pricing. The report is refreshed annually, and interim updates are triggered when material events occur, such as incentive redesigns or major supply constraints. Right before delivery, a final pass is completed so clients receive the latest updated view.
Mordor Intelligence's France Electric Vehicles Market Sizing Compared With Other Published Estimates
Published market values for France electric vehicles can look far apart, even when everyone is talking about the same country, because the counted items and the pricing logic are not always the same. Differences usually show up when one study mixes vehicles with adjacent revenue pools, or when list prices are used even though real transaction prices move with incentives and discounts.
The main gap comes from whether charging hardware and installation, or even electrified two wheelers, are added into the same value pool, and that scope choice can lift the total quickly. Another driver is how prices are handled, because using sticker prices and not normalizing for the ecological bonus and typical dealer discounts tends to overstate value, and Mordor Intelligence treats this by modeling vehicle ASPs net of incentive effects before extending them by registrations.
Benchmark comparison
| Source | Market Size | Gaps in Research Methodology |
|---|---|---|
| Mordor Intelligence | USD 34.17 B (2026) | |
| Global Consultancy A | USD 40.03 B (2024) | Uses a wider value pool that can include charging equipment and other electrified mobility, and it relies more on list prices rather than net ASP logic tied to incentives. |
| Industry Databook B | USD 14.20 B (2023) | Counts a narrower set of vehicles, often limited to passenger cars, and it can report earlier-stage revenue definitions that do not match end market vehicle transaction value. |
The comparison shows that most of the spread is explained by what gets included in the value pool and how ASPs are constructed from real purchase conditions. By keeping the scope at the vehicle sale level and by applying repeatable checks against registrations and incentive timing, the final number stays traceable to clear steps that can be reviewed and updated.


Key Questions Answered in the Report
How large was the France electric vehicle market in 2025?
In 2025, the French electric vehicle market reached a size of USD 30.56 billion.
Which vehicle type is growing fastest in France?
Heavy trucks post the highest growth, advancing at a 17.03% CAGR as freight operators respond to low-emission zone rules.
What share do battery electric cars hold?
Battery electric vehicles accounted for 67.65% of registrations in 2025, far ahead of plug-in hybrids and fuel-cell models.
How many public chargers does France have?
The network exceeded 147,000 ports in late 2025, with ultra-fast units above 150 kW expanding rapidly along major highways.
Page last updated on:






