| Study Period | 2017 - 2030 |
| Base Year For Estimation | 2024 |
| Forecast Data Period | 2025 - 2030 |
| Market Size (2025) | USD 4.95 Billion |
| Market Size (2030) | USD 5.99 Billion |
| CAGR (2025 - 2030) | 3.92 % |
| Market Concentration | Low |
Major Players*Disclaimer: Major Players sorted in no particular order |

Forage Seed Market Analysis
The Forage Seed Market size is estimated at 4.95 billion USD in 2025, and is expected to reach 5.99 billion USD by 2030, growing at a CAGR of 3.92% during the forecast period (2025-2030).
The forage seed market industry is experiencing significant transformation driven by evolving agricultural practices and increasing global livestock production demands. The expansion of commercial dairy farming and intensive livestock operations has created substantial pressure on forage production systems worldwide. This trend is particularly evident in emerging economies where rising meat consumption and dairy product demand are reshaping agricultural landscapes. The livestock sector's growth is reflected in recent statistics, with countries like Brazil reporting over 372.8 million cattle heads in 2022, marking a 4.2% increase from previous years. These developments have prompted agricultural stakeholders to seek more efficient and productive forage solutions.
Industry players are making substantial investments in research and development to enhance forage seeds quality and production efficiency. A notable example is DLF Seeds' USD 4.6 million investment in state-of-the-art mixing and distribution facilities, demonstrating the industry's commitment to technological advancement. These investments are primarily focused on developing hybrid varieties with improved traits such as disease resistance, drought tolerance, and enhanced nutritional content. The industry is witnessing increased collaboration between private seed companies and research institutions to develop innovative forage varieties that can withstand diverse environmental conditions while maintaining high productivity.
Global cultivation patterns reveal significant changes in forage production systems, with the total area under forage crop cultivation reaching 80.4 million hectares in 2022. This expansion reflects the growing recognition of forage crops' importance in sustainable agriculture and livestock production systems. Farmers are increasingly adopting advanced cultivation techniques and precision agriculture technologies to optimize forage production. The integration of digital technologies and smart farming practices is enabling more efficient resource utilization and better crop management, leading to improved yields and quality.
The market structure is characterized by a mix of large multinational corporations and regional players, with increasing emphasis on research and development capabilities. Companies are focusing on developing region-specific varieties that cater to local environmental conditions and farming practices. The industry is witnessing a trend toward consolidation through strategic partnerships and acquisitions, as companies seek to expand their product portfolios and geographical presence. This competitive landscape is driving innovation in seed development and production technologies, leading to the introduction of more sophisticated and high-performing forage seeds varieties.
Global Forage Seed Market Trends
Alfalfa dominates due to its ability to produce high forage yield under different weather and soil conditions.
- Globally, the area under forage crop cultivation reached 80.4 million ha in 2022, which increased by 4.3% between 2017 and 2022. This is due to the expansion of the global livestock industry, driven by increasing demand for meat and dairy products, which has led to a higher demand for forage crops as feed. Among the forage crops, alfalfa is a dominant crop in terms of cultivation area. It accounted for 39.2% of the global forage crop acreage in 2022. This is because of alfalfa's exceptional capacity to produce abundant protein and attractive forage under various weather and soil conditions.
- North America accounted for the major area under forage crop cultivation in the world, with a share of 29.7% in 2022. The United States alone held 59.8% of the region's forage acreage in 2022. This is mainly due to increased demand from the animal feed industry in the country.
- In the Asia-Pacific region, the total area under forage crop cultivation increased by 7.6% between 2017 and 2022. India has the largest area under forage crops, with 52.2% in 2022. The main factors increasing cultivation in the country are the high livestock population and rising demand for animal feed.
- Europe is one of the largest producers of Forages in the world. The total forage cultivation area in the region reached 9.1 million ha in 2022, which increased by 4.6% between 2017 and 2022 due to rising feed demand from livestock. Forage corn and alfalfa have the largest area under cultivation, accounting for 63.5% and 35.4% of the overall European forage cultivation area in 2022. Therefore, increased demand from the animal feed industry and the growing livestock population are estimated to drive the expansion of forage cultivation.

Understand The Key Trends Shaping This Market
Download PDF
Increasing demand for fodder in livestock farming is driving the usage of forage seeds with disease resistance, wider adaptability, and early maturity traits
- Alfalfa and forage corn are the major forage crops because of their benefits to livestock rearing, such as more digestibility and high protein. They also allow farmers to attain higher yields with good quality. Wider adaptability for alfalfa was the largest adopted trait as there have been weather changes, increased demand for early maturity, and low lignin content in a single product to minimize the usage of different inputs. Additionally, wider adaptability was the most adopted trait in the global market, especially in South America, as it had a regional market share of 35.4% in 2022. It is the most adopted crop because of the changing agro-climatic conditions, field stress, and growing crop cultivation in different regions.
- Companies such as Bayer, DLF, and Barenbrug have introduced many varieties of alfalfa and forage corn, such as Alfalfa (DKC 3218, DKC 3204, Debalto, and Marcamo), as well as forage corn (Daisy, Fado, and Power 4.2). These varieties can withstand diverse environmental conditions, adapt to various soil types, and withstand field stress and heat conditions. The EU Commission's REFORMA project (2016-2020) aimed to develop advanced breeding techniques and introduce new alfalfa cultivars.
- There is an increase in the demand for seeds with early maturity and high starch content traits as they offer a shorter growing period, allowing farmers to harvest earlier. High starch content in forage corn enhances its nutritional value for animal feed. Therefore, the companies are expected to produce such varieties in larger quantities during the forecast period.
- To prevent the increasing losses from diseases and increase productivity in a shorter period, the seeds with traits such as disease resistance and early maturity drive the market.

OTHER KEY INDUSTRY TRENDS COVERED IN THE REPORT
- Hybrid breeding dominates the global forage seed market due to its ability to enhance forage crop productivity, quality, and disease resistance
Segment Analysis: Breeding Technology
Hybrids Segment in Global Forage Seed Market
The hybrids segment dominates the global forage seed market, commanding approximately 73% of the total market share in 2024. This significant market position is primarily driven by the superior traits offered by hybrid seeds, including enhanced disease resistance, improved yield potential, and consistent performance in meeting modern agricultural demands. The segment's dominance is particularly strong in developed markets where farmers have shown a strong preference for hybrid seeds due to their ability to offer higher yields and better resistance to various soil and weather conditions. The adoption of hybrids is especially high in forage corn and alfalfa cultivation, where farmers seek varieties with multiple beneficial traits such as drought tolerance, disease resistance, and higher nutritional content. Non-transgenic hybrids constitute the majority of this segment, particularly in regions where GM crops face regulatory restrictions, while transgenic hybrids are gaining traction in markets where they are approved for commercial cultivation.
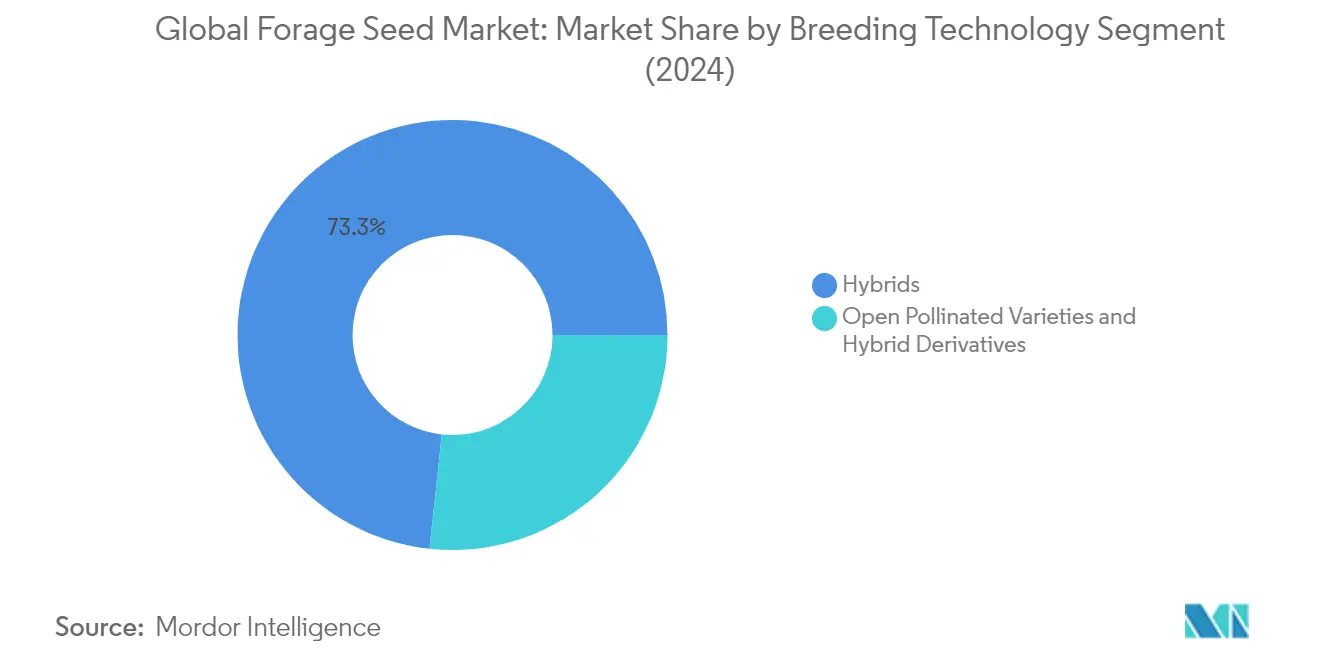
Open Pollinated Varieties & Hybrid Derivatives Segment in Global Forage Seed Market
The Open Pollinated Varieties (OPV) and Hybrid Derivatives segment is projected to experience the fastest growth in the forage seed market, with an estimated CAGR of approximately 4% during 2024-2029. This growth trajectory is driven by several factors, including the segment's appeal to small-scale farmers due to lower input costs and reduced dependence on hybrid seed imports. The segment's expansion is particularly notable in developing regions where farmers prefer these varieties for their ability to maintain genetic diversity and adapt to local growing conditions. The increasing focus on sustainable agriculture practices and the growing demand for cost-effective farming solutions are further propelling the segment's growth. Additionally, the segment is benefiting from ongoing research and development activities aimed at improving the performance and yield potential of open-pollinated varieties, making them more competitive with hybrid alternatives.
Segment Analysis: Crop
Alfalfa Segment in Global Forage Seed Market
Alfalfa dominates the global forage seed market, accounting for approximately 39% of the total market value in 2024. The segment's strong market position is primarily attributed to its exceptional capacity to produce abundant protein and attractive forage under various weather and soil conditions. Alfalfa's versatility and adaptability to different climatic conditions make it particularly appealing to farmers worldwide. The crop's ability to be harvested 10-12 times per crop season, combined with its high nutritional protein content, has established it as a preferred choice among dairy farmers and livestock producers. The segment's growth is further supported by increasing demand from the dairy industry and the rising adoption of high-yielding varieties that offer improved drought resistance and enhanced digestibility characteristics.
Forage Sorghum Segment in Global Forage Seed Market
The forage sorghum segment is experiencing rapid growth in the global forage seed market, projected to expand at approximately 4% CAGR from 2024 to 2029. This growth is primarily driven by the increasing demand for forage sorghum due to the development of dual-purpose varieties and the rising preference for sorghum silage in livestock feeding systems. The segment's expansion is further supported by the availability of highly nutritious varieties and sorghum's natural ability to thrive in water-scarce conditions. The crop's quick and rapid growth characteristics, combined with its exceptional hardiness and high energy content, make it an increasingly attractive option for farmers looking to optimize their forage production while managing water resources effectively.
Remaining Segments in Crop Segmentation
The forage crop seeds market's remaining segments include forage corn and other forage crops, each playing vital roles in the global livestock feed industry. Forage corn has established itself as a crucial segment due to its high palatability and superior digestibility characteristics, making it particularly valuable for silage production. The other forage crops segment, which includes various grass types and legumes, contributes to market diversity by offering farmers different options for specific regional conditions and feeding requirements. These segments collectively enhance the market's ability to meet diverse agricultural needs across different geographical regions and farming systems.
Forage Seed Market Geography Segment Analysis
Forage Seed Market in Africa
The African forage seed market demonstrates significant potential driven by the expanding livestock industry and rising demand for high-quality forage seeds. The region's diverse climatic conditions support various forage crops, with countries like South Africa, Egypt, Ethiopia, Ghana, Kenya, Nigeria, and Tanzania playing crucial roles in market development. The growing adoption of hybrid seeds and an increasing focus on improving feed quality for livestock are key factors shaping market dynamics across the continent.
Forage Seed Market in South Africa
South Africa dominates the African forage seed market, holding approximately 40% share in 2024. The country's leadership position is attributed to its advanced agricultural practices and well-established livestock industry. Major forage production regions include Jankempdorp, Hopetown, Jacobsdal, and Douglas, where alfalfa cultivation is particularly prominent. The country's robust distribution network and increasing adoption of hybrid seeds further strengthen its market position.
Forage Seed Market in Ethiopia
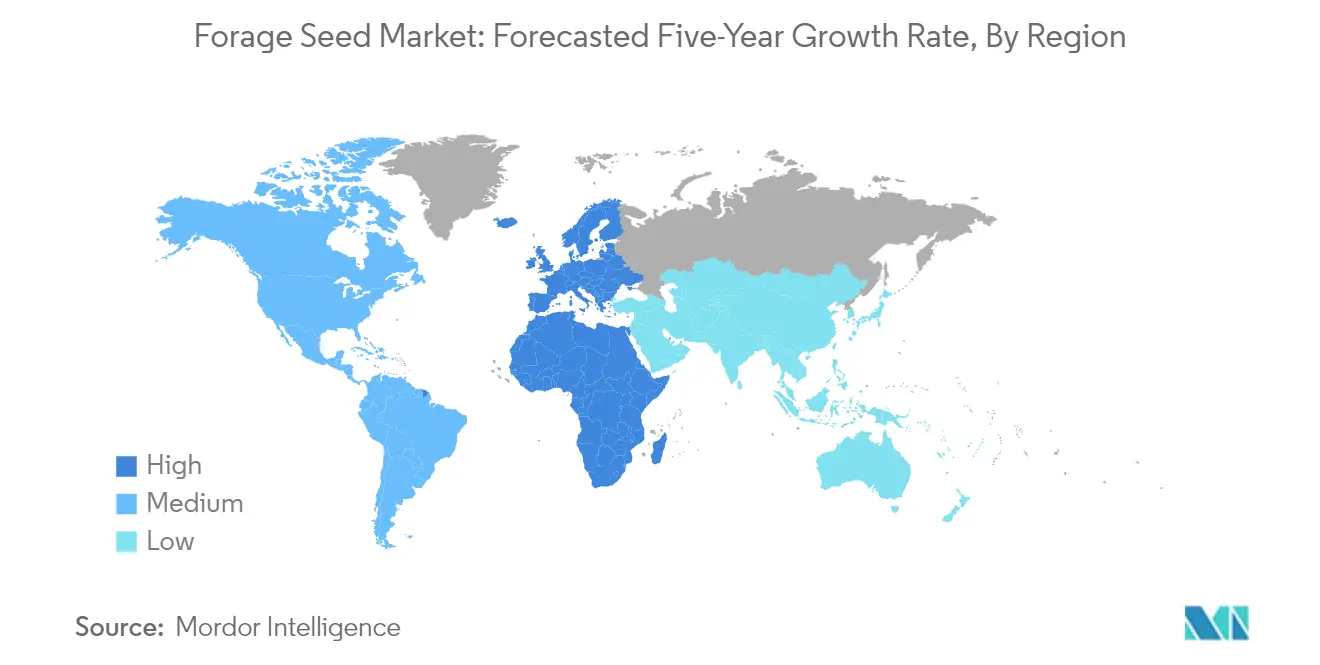
Ethiopia emerges as the fastest-growing market in Africa, with a projected growth rate of approximately 3% during 2024-2029. The country's expanding dairy and livestock sectors drive this growth, supported by favorable government policies promoting forage crop cultivation. Ethiopian farmers are increasingly adopting improved seed varieties and modern agricultural practices, contributing to market expansion. The country's diverse agro-ecological zones provide suitable conditions for various forage crops, enabling year-round production.
Forage Seed Market in Asia-Pacific
The Asia-Pacific forage seed market exhibits strong growth potential, characterized by increasing demand from the dairy and livestock sectors. The region encompasses diverse markets including Japan, India, Australia, China, Bangladesh, Indonesia, Myanmar, Pakistan, Philippines, Thailand, and Vietnam. The market is driven by technological advancements in seed development and growing awareness about high-quality animal feed among farmers.
Forage Seed Market in Japan
Japan leads the Asia-Pacific market, commanding approximately 49% market share in 2024. The country's dominance is supported by advanced agricultural practices and strong government initiatives to increase forage self-sufficiency. Japanese farmers demonstrate high adoption rates of improved seed varieties, particularly in forage corn and alfalfa cultivation, supported by robust research and development infrastructure.
Forage Seed Market in Iran
Iran shows remarkable growth potential with an expected growth rate of approximately 7% during 2024-2029. The country's expanding livestock sector and increasing focus on domestic forage production drive market growth. Iranian farmers are increasingly adopting modern cultivation techniques and improved seed varieties, particularly in alfalfa and forage corn production, supported by government initiatives to enhance agricultural productivity.
Forage Seed Market in Europe
Europe represents a mature forage seeds market, with a strong focus on sustainable agricultural practices and high-quality animal feed production. The region encompasses key markets including France, Germany, Italy, Netherlands, Poland, Romania, Russia, Spain, Turkey, Ukraine, and the United Kingdom. The market benefits from advanced seed development technologies and strong research infrastructure.
Forage Seed Market in France
The forage seed market in France maintains its position as the largest market in Europe, driven by its extensive livestock industry and advanced agricultural practices. The country's leadership in forage corn production and strong focus on research and development contribute to its market dominance. French farmers demonstrate high adoption rates of improved seed varieties, supported by robust agricultural policies and infrastructure.
Forage Seed Market in United Kingdom
The forage seed market in the UK emerges as the fastest-growing market in Europe, driven by increasing demand for high-quality animal feed and a growing emphasis on sustainable farming practices. The country's focus on improving grassland management and increasing adoption of improved forage varieties contributes to market growth. British farmers are increasingly investing in premium seed varieties to enhance feed quality and livestock productivity.
Forage Seed Market in Middle East
The Middle Eastern forage seeds market demonstrates significant growth potential, driven by increasing demand for animal feed and government initiatives to enhance domestic forage production. Iran and Saudi Arabia are the key markets in the region, with Iran emerging as both the largest and fastest-growing market. The region's focus on improving agricultural productivity and reducing dependence on imported feed continues to drive market expansion.
Forage Seed Market in North America
The North American forage seed market is characterized by advanced agricultural practices and high adoption of improved seed varieties. The region comprises Canada, Mexico, and the United States, with Canada emerging as the largest market and Mexico showing the fastest growth. The market benefits from strong research infrastructure, technological advancement in seed development, and an increasing focus on sustainable farming practices.
Forage Seed Market in South America
The South American forage seed market shows robust growth potential, driven by expanding livestock industries and an increasing focus on improved animal nutrition. The region includes Argentina and Brazil, with Brazil dominating as the largest market while Argentina demonstrates the fastest growth. The market benefits from favorable climatic conditions, extensive grazing lands, and increasing adoption of improved forage varieties.
Get Analysis on Important Geographic Markets
Download PDF
Forage Seed Industry Overview
Top Companies in Forage Seed Market
The forage seed market is characterized by companies actively pursuing innovation in seed development, focusing on traits like drought tolerance, disease resistance, and improved nutritional content. Major players are investing significantly in research and development to create high-yielding varieties adapted to diverse climatic conditions. Strategic moves in the industry primarily revolve around mergers and acquisitions to expand geographical presence and strengthen product portfolios, particularly evident in developed markets. Companies are also emphasizing operational agility through investments in advanced breeding technologies and production facilities. Market leaders are expanding their distribution networks and forming partnerships with local distributors to enhance market penetration while simultaneously developing region-specific varieties to meet local farming requirements.
Market Dominated by Global Agricultural Conglomerates
The forage seed market exhibits a moderately fragmented structure with a mix of global agricultural conglomerates and specialized seed companies. Global players leverage their extensive research capabilities and established distribution networks to maintain market leadership, while regional specialists thrive by offering locally adapted varieties and providing specialized technical support to farmers. The market is characterized by a strong presence of European and North American companies that have built their positions through decades of research and development in forage crop genetics.
The industry has witnessed significant consolidation through strategic acquisitions, particularly in developed markets where companies seek to acquire complementary product portfolios and research capabilities. Market leaders are increasingly focusing on vertical integration, controlling everything from breeding and production to distribution and technical support. Regional players maintain their relevance through deep local market knowledge and strong relationships with farming communities, often specializing in specific crop varieties suited to local conditions.
Innovation and Localization Drive Future Success
Success in the forage seeds market increasingly depends on companies' ability to develop climate-resilient varieties while maintaining cost competitiveness. Companies need to invest in advanced breeding technologies and maintain robust research pipelines to create varieties that offer higher yields and better resistance to pests and diseases. The ability to provide comprehensive technical support to farmers and establish strong distribution networks will be crucial for market expansion. Companies must also focus on developing sustainable and environmentally friendly varieties to align with evolving regulatory requirements and changing farmer preferences.
Market contenders can gain ground by focusing on niche segments and underserved regions, particularly in emerging markets where the adoption of commercial seeds is growing. Success will depend on building strong relationships with local farming communities and offering tailored solutions that address specific regional challenges. Companies must also consider the increasing consolidation in the livestock industry, which affects demand patterns, and prepare for potential regulatory changes regarding seed certification and genetic modification. The ability to adapt to changing environmental regulations and sustainability requirements will be crucial for long-term success in the market. Additionally, pasture seed companies are focusing on the field count in seed technology to enhance their product offerings and meet specific regional needs.
Forage Seed Market Leaders
-
Bayer AG
-
Corteva Agriscience
-
DLF
-
Land O’Lakes Inc.
-
Royal Barenbrug Group
- *Disclaimer: Major Players sorted in no particular order

Need More Details on Market Players and Competitors?
Download PDF
Forage Seed Market News
- March 2023: PGG Wrightson Seeds, a subsidiary of DLF, successfully developed the new GT07 phalaris variety. This variety exhibits greater persistence and market potential, particularly under Australia's changing climate conditions. The development of GT07 was made possible through collaboration with CSIRO's breeding program.
- March 2023: Barenbrug entered an agreement to acquire the UK seed specialist Watson Group, which is expected to enable Barenbrug to continue growing in the grass-seed marketplace in the United Kingdom.
- March 2023: DLF expanded its presence in New Zealand by opening a new seed processing and storage facility. This strategic investment aims to enhance seed processing capabilities and improve storage capacity in the country, allowing DLF to better serve the agricultural sector and meet the growing demand for high-quality seeds in New Zealand.
Free With This Report
We provide a complimentary and exhaustive set of data points on regional and country-level metrics that present the fundamental structure of the industry. Presented in the form of 90+ free charts, the section covers difficult-to-find data from various regions regarding the area under cultivation for different crops within the scope


Forage Seed Market Report - Table of Contents
1. EXECUTIVE SUMMARY & KEY FINDINGS
2. REPORT OFFERS
3. INTRODUCTION
- 3.1 Study Assumptions & Market Definition
- 3.2 Scope of the Study
- 3.3 Research Methodology
4. KEY INDUSTRY TRENDS
-
4.1 Area Under Cultivation
- 4.1.1 Row Crops
-
4.2 Most Popular Traits
- 4.2.1 Alfalfa & Forage Corn
-
4.3 Breeding Techniques
- 4.3.1 Row Crops
- 4.4 Regulatory Framework
- 4.5 Value Chain & Distribution Channel Analysis
5. MARKET SEGMENTATION (includes market size in Value in USD, Forecasts up to 2030 and analysis of growth prospects)
-
5.1 Breeding Technology
- 5.1.1 Hybrids
- 5.1.1.1 Non-Transgenic Hybrids
- 5.1.1.2 Transgenic Hybrids
- 5.1.1.2.1 Herbicide Tolerant Hybrids
- 5.1.1.2.2 Other Traits
- 5.1.2 Open Pollinated Varieties & Hybrid Derivatives
-
5.2 Crop
- 5.2.1 Alfalfa
- 5.2.2 Forage Corn
- 5.2.3 Forage Sorghum
- 5.2.4 Other Forage Crops
-
5.3 Region
- 5.3.1 Africa
- 5.3.1.1 By Breeding Technology
- 5.3.1.2 By Crop
- 5.3.1.3 By Country
- 5.3.1.3.1 Egypt
- 5.3.1.3.2 Ethiopia
- 5.3.1.3.3 Ghana
- 5.3.1.3.4 Kenya
- 5.3.1.3.5 Nigeria
- 5.3.1.3.6 South Africa
- 5.3.1.3.7 Tanzania
- 5.3.1.3.8 Rest of Africa
- 5.3.2 Asia-Pacific
- 5.3.2.1 By Breeding Technology
- 5.3.2.2 By Crop
- 5.3.2.3 By Country
- 5.3.2.3.1 Australia
- 5.3.2.3.2 Bangladesh
- 5.3.2.3.3 China
- 5.3.2.3.4 India
- 5.3.2.3.5 Indonesia
- 5.3.2.3.6 Japan
- 5.3.2.3.7 Myanmar
- 5.3.2.3.8 Pakistan
- 5.3.2.3.9 Philippines
- 5.3.2.3.10 Thailand
- 5.3.2.3.11 Vietnam
- 5.3.2.3.12 Rest of Asia-Pacific
- 5.3.3 Europe
- 5.3.3.1 By Breeding Technology
- 5.3.3.2 By Crop
- 5.3.3.3 By Country
- 5.3.3.3.1 France
- 5.3.3.3.2 Germany
- 5.3.3.3.3 Italy
- 5.3.3.3.4 Netherlands
- 5.3.3.3.5 Poland
- 5.3.3.3.6 Romania
- 5.3.3.3.7 Russia
- 5.3.3.3.8 Spain
- 5.3.3.3.9 Turkey
- 5.3.3.3.10 Ukraine
- 5.3.3.3.11 United Kingdom
- 5.3.3.3.12 Rest of Europe
- 5.3.4 Middle East
- 5.3.4.1 By Breeding Technology
- 5.3.4.2 By Crop
- 5.3.4.3 By Country
- 5.3.4.3.1 Iran
- 5.3.4.3.2 Saudi Arabia
- 5.3.4.3.3 Rest of Middle East
- 5.3.5 North America
- 5.3.5.1 By Breeding Technology
- 5.3.5.2 By Crop
- 5.3.5.3 By Country
- 5.3.5.3.1 Canada
- 5.3.5.3.2 Mexico
- 5.3.5.3.3 United States
- 5.3.5.3.4 Rest of North America
- 5.3.6 South America
- 5.3.6.1 By Breeding Technology
- 5.3.6.2 By Crop
- 5.3.6.3 By Country
- 5.3.6.3.1 Argentina
- 5.3.6.3.2 Brazil
- 5.3.6.3.3 Rest of South America
6. COMPETITIVE LANDSCAPE
- 6.1 Key Strategic Moves
- 6.2 Market Share Analysis
- 6.3 Company Landscape
-
6.4 Company Profiles
- 6.4.1 Advanta Seeds - UPL
- 6.4.2 Ampac Seed Company
- 6.4.3 Bayer AG
- 6.4.4 Corteva Agriscience
- 6.4.5 DLF
- 6.4.6 KWS SAAT SE & Co. KGaA
- 6.4.7 Land O’Lakes Inc.
- 6.4.8 RAGT Group
- 6.4.9 Royal Barenbrug Group
- 6.4.10 S&W Seed Co.
- *List Not Exhaustive
7. KEY STRATEGIC QUESTIONS FOR SEEDS CEOS
8. APPENDIX
-
8.1 Global Overview
- 8.1.1 Overview
- 8.1.2 Porter’s Five Forces Framework
- 8.1.3 Global Value Chain Analysis
- 8.1.4 Global Market Size and DROs
- 8.2 Sources & References
- 8.3 List of Tables & Figures
- 8.4 Primary Insights
- 8.5 Data Pack
- 8.6 Glossary of Terms
You Can Purchase Parts Of This Report. Check Out Prices For Specific Sections
Get Price Break-up Now
List of Tables & Figures
- Figure 1:
- AREA UNDER CULTIVATION OF ROW CROPS, HECTARE, GLOBAL, 2017-2022
- Figure 2:
- VALUE SHARE OF MAJOR ALFALFA TRAITS, %, GLOBAL, 2022
- Figure 3:
- VALUE SHARE OF MAJOR FORAGE CORN TRAITS, %, GLOBAL, 2022
- Figure 4:
- VALUE SHARE OF ROW CROPS BREEDING TECHNIQUES, %, GLOBAL, 2022
- Figure 5:
- VOLUME OF FORAGE CROPS SEED, METRIC TON, GLOBAL, 2017 - 2030
- Figure 6:
- VALUE OF FORAGE CROPS SEED, USD, GLOBAL, 2017 - 2030
- Figure 7:
- VOLUME OF FORAGE CROPS SEED BY BREEDING TECHNOLOGY CATEGORIES, METRIC TON, GLOBAL, 2017 - 2030
- Figure 8:
- VALUE OF FORAGE CROPS SEED BY BREEDING TECHNOLOGY CATEGORIES, USD, GLOBAL, 2017 - 2030
- Figure 9:
- VOLUME SHARE OF FORAGE CROPS SEED BY BREEDING TECHNOLOGY CATEGORIES, %, GLOBAL, 2017 VS 2023 VS 2030
- Figure 10:
- VALUE SHARE OF FORAGE CROPS SEED BY BREEDING TECHNOLOGY CATEGORIES, %, GLOBAL, 2017 VS 2023 VS 2030
- Figure 11:
- VOLUME OF FORAGE CROPS SEED BY HYBRIDS CATEGORIES, METRIC TON, GLOBAL, 2017 - 2030
- Figure 12:
- VALUE OF FORAGE CROPS SEED BY HYBRIDS CATEGORIES, USD, GLOBAL, 2017 - 2030
- Figure 13:
- VOLUME SHARE OF FORAGE CROPS SEED BY HYBRIDS CATEGORIES, %, GLOBAL, 2017 VS 2023 VS 2030
- Figure 14:
- VALUE SHARE OF FORAGE CROPS SEED BY HYBRIDS CATEGORIES, %, GLOBAL, 2017 VS 2023 VS 2030
- Figure 15:
- VOLUME OF NON-TRANSGENIC HYBRIDS FORAGE CROPS SEED, METRIC TON, GLOBAL, 2017 - 2030
- Figure 16:
- VALUE OF NON-TRANSGENIC HYBRIDS FORAGE CROPS SEED, USD, GLOBAL, 2017 - 2030
- Figure 17:
- VALUE SHARE OF NON-TRANSGENIC HYBRIDS FORAGE CROPS SEED BY CROP, %, GLOBAL, 2023 AND 2030
- Figure 18:
- VOLUME OF FORAGE CROPS SEED BY TRANSGENIC HYBRIDS CATEGORIES, METRIC TON, GLOBAL, 2017 - 2030
- Figure 19:
- VALUE OF FORAGE CROPS SEED BY TRANSGENIC HYBRIDS CATEGORIES, USD, GLOBAL, 2017 - 2030
- Figure 20:
- VOLUME SHARE OF FORAGE CROPS SEED BY TRANSGENIC HYBRIDS CATEGORIES, %, GLOBAL, 2017 VS 2023 VS 2030
- Figure 21:
- VALUE SHARE OF FORAGE CROPS SEED BY TRANSGENIC HYBRIDS CATEGORIES, %, GLOBAL, 2017 VS 2023 VS 2030
- Figure 22:
- VOLUME OF HERBICIDE TOLERANT HYBRIDS FORAGE CROPS SEED, METRIC TON, GLOBAL, 2017 - 2030
- Figure 23:
- VALUE OF HERBICIDE TOLERANT HYBRIDS FORAGE CROPS SEED, USD, GLOBAL, 2017 - 2030
- Figure 24:
- VALUE SHARE OF HERBICIDE TOLERANT HYBRIDS FORAGE CROPS SEED BY CROP, %, GLOBAL, 2023 AND 2030
- Figure 25:
- VOLUME OF OTHER TRAITS FORAGE CROPS SEED, METRIC TON, GLOBAL, 2017 - 2030
- Figure 26:
- VALUE OF OTHER TRAITS FORAGE CROPS SEED, USD, GLOBAL, 2017 - 2030
- Figure 27:
- VALUE SHARE OF OTHER TRAITS FORAGE CROPS SEED BY CROP, %, GLOBAL, 2023 AND 2030
- Figure 28:
- VOLUME OF OPEN POLLINATED VARIETIES & HYBRID DERIVATIVES FORAGE CROPS SEED, METRIC TON, GLOBAL, 2017 - 2030
- Figure 29:
- VALUE OF OPEN POLLINATED VARIETIES & HYBRID DERIVATIVES FORAGE CROPS SEED, USD, GLOBAL, 2017 - 2030
- Figure 30:
- VALUE SHARE OF OPEN POLLINATED VARIETIES & HYBRID DERIVATIVES FORAGE CROPS SEED BY CROP, %, GLOBAL, 2023 AND 2030
- Figure 31:
- VOLUME OF FORAGE CROPS SEED BY CROP CATEGORIES, METRIC TON, GLOBAL, 2017 - 2030
- Figure 32:
- VALUE OF FORAGE CROPS SEED BY CROP CATEGORIES, USD, GLOBAL, 2017 - 2030
- Figure 33:
- VOLUME SHARE OF FORAGE CROPS SEED BY CROP CATEGORIES, %, GLOBAL, 2017 VS 2023 VS 2030
- Figure 34:
- VALUE SHARE OF FORAGE CROPS SEED BY CROP CATEGORIES, %, GLOBAL, 2017 VS 2023 VS 2030
- Figure 35:
- VOLUME OF ALFALFA SEED, METRIC TON, GLOBAL, 2017 - 2030
- Figure 36:
- VALUE OF ALFALFA SEED, USD, GLOBAL, 2017 - 2030
- Figure 37:
- VALUE SHARE OF ALFALFA SEED BY BREEDING TECHNOLOGY, %, GLOBAL, 2023 AND 2030
- Figure 38:
- VOLUME OF FORAGE CORN SEED, METRIC TON, GLOBAL, 2017 - 2030
- Figure 39:
- VALUE OF FORAGE CORN SEED, USD, GLOBAL, 2017 - 2030
- Figure 40:
- VALUE SHARE OF FORAGE CORN SEED BY BREEDING TECHNOLOGY, %, GLOBAL, 2023 AND 2030
- Figure 41:
- VOLUME OF FORAGE SORGHUM SEED, METRIC TON, GLOBAL, 2017 - 2030
- Figure 42:
- VALUE OF FORAGE SORGHUM SEED, USD, GLOBAL, 2017 - 2030
- Figure 43:
- VALUE SHARE OF FORAGE SORGHUM SEED BY BREEDING TECHNOLOGY, %, GLOBAL, 2023 AND 2030
- Figure 44:
- VOLUME OF OTHER FORAGE CROPS SEED, METRIC TON, GLOBAL, 2017 - 2030
- Figure 45:
- VALUE OF OTHER FORAGE CROPS SEED, USD, GLOBAL, 2017 - 2030
- Figure 46:
- VALUE SHARE OF OTHER FORAGE CROPS SEED BY BREEDING TECHNOLOGY, %, GLOBAL, 2023 AND 2030
- Figure 47:
- VOLUME OF FORAGE CROPS SEED BY REGION, METRIC TON, GLOBAL, 2017 - 2030
- Figure 48:
- VALUE OF FORAGE CROPS SEED BY REGION, USD, GLOBAL, 2017 - 2030
- Figure 49:
- VOLUME SHARE OF FORAGE CROPS SEED BY REGION, %, GLOBAL, 2017 VS 2023 VS 2030
- Figure 50:
- VALUE SHARE OF FORAGE CROPS SEED BY REGION, %, GLOBAL, 2017 VS 2023 VS 2030
- Figure 51:
- VOLUME OF FORAGE CROPS SEED BY BREEDING TECHNOLOGY CATEGORIES, METRIC TON, AFRICA, 2017 - 2030
- Figure 52:
- VALUE OF FORAGE CROPS SEED BY BREEDING TECHNOLOGY CATEGORIES, USD, AFRICA, 2017 - 2030
- Figure 53:
- VOLUME SHARE OF FORAGE CROPS SEED BY BREEDING TECHNOLOGY CATEGORIES, %, AFRICA, 2017 VS 2023 VS 2030
- Figure 54:
- VALUE SHARE OF FORAGE CROPS SEED BY BREEDING TECHNOLOGY CATEGORIES, %, AFRICA, 2017 VS 2023 VS 2030
- Figure 55:
- VOLUME OF FORAGE CROPS SEED BY CROP CATEGORIES, METRIC TON, AFRICA, 2017 - 2030
- Figure 56:
- VALUE OF FORAGE CROPS SEED BY CROP CATEGORIES, USD, AFRICA, 2017 - 2030
- Figure 57:
- VOLUME SHARE OF FORAGE CROPS SEED BY CROP CATEGORIES, %, AFRICA, 2017 VS 2023 VS 2030
- Figure 58:
- VALUE SHARE OF FORAGE CROPS SEED BY CROP CATEGORIES, %, AFRICA, 2017 VS 2023 VS 2030
- Figure 59:
- VOLUME OF FORAGE CROPS SEED BY COUNTRY, METRIC TON, AFRICA, 2017 - 2030
- Figure 60:
- VALUE OF FORAGE CROPS SEED BY COUNTRY, USD, AFRICA, 2017 - 2030
- Figure 61:
- VOLUME SHARE OF FORAGE CROPS SEED BY COUNTRY, %, AFRICA, 2017 VS 2023 VS 2030
- Figure 62:
- VALUE SHARE OF FORAGE CROPS SEED BY COUNTRY, %, AFRICA, 2017 VS 2023 VS 2030
- Figure 63:
- VOLUME OF EGYPT FORAGE CROPS SEED, METRIC TON, AFRICA, 2017 - 2030
- Figure 64:
- VALUE OF EGYPT FORAGE CROPS SEED, USD, AFRICA, 2017 - 2030
- Figure 65:
- VALUE SHARE OF EGYPT FORAGE CROPS SEED BY CROP, %, AFRICA, 2023 AND 2030
- Figure 66:
- VOLUME OF ETHIOPIA FORAGE CROPS SEED, METRIC TON, AFRICA, 2017 - 2030
- Figure 67:
- VALUE OF ETHIOPIA FORAGE CROPS SEED, USD, AFRICA, 2017 - 2030
- Figure 68:
- VALUE SHARE OF ETHIOPIA FORAGE CROPS SEED BY CROP, %, AFRICA, 2023 AND 2030
- Figure 69:
- VOLUME OF GHANA FORAGE CROPS SEED, METRIC TON, AFRICA, 2017 - 2030
- Figure 70:
- VALUE OF GHANA FORAGE CROPS SEED, USD, AFRICA, 2017 - 2030
- Figure 71:
- VALUE SHARE OF GHANA FORAGE CROPS SEED BY CROP, %, AFRICA, 2023 AND 2030
- Figure 72:
- VOLUME OF KENYA FORAGE CROPS SEED, METRIC TON, AFRICA, 2017 - 2030
- Figure 73:
- VALUE OF KENYA FORAGE CROPS SEED, USD, AFRICA, 2017 - 2030
- Figure 74:
- VALUE SHARE OF KENYA FORAGE CROPS SEED BY CROP, %, AFRICA, 2023 AND 2030
- Figure 75:
- VOLUME OF NIGERIA FORAGE CROPS SEED, METRIC TON, AFRICA, 2017 - 2030
- Figure 76:
- VALUE OF NIGERIA FORAGE CROPS SEED, USD, AFRICA, 2017 - 2030
- Figure 77:
- VALUE SHARE OF NIGERIA FORAGE CROPS SEED BY CROP, %, AFRICA, 2023 AND 2030
- Figure 78:
- VOLUME OF SOUTH AFRICA FORAGE CROPS SEED, METRIC TON, AFRICA, 2017 - 2030
- Figure 79:
- VALUE OF SOUTH AFRICA FORAGE CROPS SEED, USD, AFRICA, 2017 - 2030
- Figure 80:
- VALUE SHARE OF SOUTH AFRICA FORAGE CROPS SEED BY CROP, %, AFRICA, 2023 AND 2030
- Figure 81:
- VOLUME OF TANZANIA FORAGE CROPS SEED, METRIC TON, AFRICA, 2017 - 2030
- Figure 82:
- VALUE OF TANZANIA FORAGE CROPS SEED, USD, AFRICA, 2017 - 2030
- Figure 83:
- VALUE SHARE OF TANZANIA FORAGE CROPS SEED BY CROP, %, AFRICA, 2023 AND 2030
- Figure 84:
- VOLUME OF REST OF AFRICA FORAGE CROPS SEED, METRIC TON, AFRICA, 2017 - 2030
- Figure 85:
- VALUE OF REST OF AFRICA FORAGE CROPS SEED, USD, AFRICA, 2017 - 2030
- Figure 86:
- VALUE SHARE OF REST OF AFRICA FORAGE CROPS SEED BY CROP, %, AFRICA, 2023 AND 2030
- Figure 87:
- VOLUME OF FORAGE CROPS SEED BY BREEDING TECHNOLOGY CATEGORIES, METRIC TON, ASIA-PACIFIC, 2017 - 2030
- Figure 88:
- VALUE OF FORAGE CROPS SEED BY BREEDING TECHNOLOGY CATEGORIES, USD, ASIA-PACIFIC, 2017 - 2030
- Figure 89:
- VOLUME SHARE OF FORAGE CROPS SEED BY BREEDING TECHNOLOGY CATEGORIES, %, ASIA-PACIFIC, 2017 VS 2023 VS 2030
- Figure 90:
- VALUE SHARE OF FORAGE CROPS SEED BY BREEDING TECHNOLOGY CATEGORIES, %, ASIA-PACIFIC, 2017 VS 2023 VS 2030
- Figure 91:
- VOLUME OF FORAGE CROPS SEED BY CROP CATEGORIES, METRIC TON, ASIA-PACIFIC, 2017 - 2030
- Figure 92:
- VALUE OF FORAGE CROPS SEED BY CROP CATEGORIES, USD, ASIA-PACIFIC, 2017 - 2030
- Figure 93:
- VOLUME SHARE OF FORAGE CROPS SEED BY CROP CATEGORIES, %, ASIA-PACIFIC, 2017 VS 2023 VS 2030
- Figure 94:
- VALUE SHARE OF FORAGE CROPS SEED BY CROP CATEGORIES, %, ASIA-PACIFIC, 2017 VS 2023 VS 2030
- Figure 95:
- VOLUME OF FORAGE CROPS SEED BY COUNTRY, METRIC TON, ASIA-PACIFIC, 2017 - 2030
- Figure 96:
- VALUE OF FORAGE CROPS SEED BY COUNTRY, USD, ASIA-PACIFIC, 2017 - 2030
- Figure 97:
- VOLUME SHARE OF FORAGE CROPS SEED BY COUNTRY, %, ASIA-PACIFIC, 2017 VS 2023 VS 2030
- Figure 98:
- VALUE SHARE OF FORAGE CROPS SEED BY COUNTRY, %, ASIA-PACIFIC, 2017 VS 2023 VS 2030
- Figure 99:
- VOLUME OF AUSTRALIA FORAGE CROPS SEED, METRIC TON, ASIA-PACIFIC, 2017 - 2030
- Figure 100:
- VALUE OF AUSTRALIA FORAGE CROPS SEED, USD, ASIA-PACIFIC, 2017 - 2030
- Figure 101:
- VALUE SHARE OF AUSTRALIA FORAGE CROPS SEED BY CROP, %, ASIA-PACIFIC, 2023 AND 2030
- Figure 102:
- VOLUME OF BANGLADESH FORAGE CROPS SEED, METRIC TON, ASIA-PACIFIC, 2017 - 2030
- Figure 103:
- VALUE OF BANGLADESH FORAGE CROPS SEED, USD, ASIA-PACIFIC, 2017 - 2030
- Figure 104:
- VALUE SHARE OF BANGLADESH FORAGE CROPS SEED BY CROP, %, ASIA-PACIFIC, 2023 AND 2030
- Figure 105:
- VOLUME OF CHINA FORAGE CROPS SEED, METRIC TON, ASIA-PACIFIC, 2017 - 2030
- Figure 106:
- VALUE OF CHINA FORAGE CROPS SEED, USD, ASIA-PACIFIC, 2017 - 2030
- Figure 107:
- VALUE SHARE OF CHINA FORAGE CROPS SEED BY CROP, %, ASIA-PACIFIC, 2023 AND 2030
- Figure 108:
- VOLUME OF INDIA FORAGE CROPS SEED, METRIC TON, ASIA-PACIFIC, 2017 - 2030
- Figure 109:
- VALUE OF INDIA FORAGE CROPS SEED, USD, ASIA-PACIFIC, 2017 - 2030
- Figure 110:
- VALUE SHARE OF INDIA FORAGE CROPS SEED BY CROP, %, ASIA-PACIFIC, 2023 AND 2030
- Figure 111:
- VOLUME OF INDONESIA FORAGE CROPS SEED, METRIC TON, ASIA-PACIFIC, 2017 - 2030
- Figure 112:
- VALUE OF INDONESIA FORAGE CROPS SEED, USD, ASIA-PACIFIC, 2017 - 2030
- Figure 113:
- VALUE SHARE OF INDONESIA FORAGE CROPS SEED BY CROP, %, ASIA-PACIFIC, 2023 AND 2030
- Figure 114:
- VOLUME OF JAPAN FORAGE CROPS SEED, METRIC TON, ASIA-PACIFIC, 2017 - 2030
- Figure 115:
- VALUE OF JAPAN FORAGE CROPS SEED, USD, ASIA-PACIFIC, 2017 - 2030
- Figure 116:
- VALUE SHARE OF JAPAN FORAGE CROPS SEED BY CROP, %, ASIA-PACIFIC, 2023 AND 2030
- Figure 117:
- VOLUME OF MYANMAR FORAGE CROPS SEED, METRIC TON, ASIA-PACIFIC, 2017 - 2030
- Figure 118:
- VALUE OF MYANMAR FORAGE CROPS SEED, USD, ASIA-PACIFIC, 2017 - 2030
- Figure 119:
- VALUE SHARE OF MYANMAR FORAGE CROPS SEED BY CROP, %, ASIA-PACIFIC, 2023 AND 2030
- Figure 120:
- VOLUME OF PAKISTAN FORAGE CROPS SEED, METRIC TON, ASIA-PACIFIC, 2017 - 2030
- Figure 121:
- VALUE OF PAKISTAN FORAGE CROPS SEED, USD, ASIA-PACIFIC, 2017 - 2030
- Figure 122:
- VALUE SHARE OF PAKISTAN FORAGE CROPS SEED BY CROP, %, ASIA-PACIFIC, 2023 AND 2030
- Figure 123:
- VOLUME OF PHILIPPINES FORAGE CROPS SEED, METRIC TON, ASIA-PACIFIC, 2017 - 2030
- Figure 124:
- VALUE OF PHILIPPINES FORAGE CROPS SEED, USD, ASIA-PACIFIC, 2017 - 2030
- Figure 125:
- VALUE SHARE OF PHILIPPINES FORAGE CROPS SEED BY CROP, %, ASIA-PACIFIC, 2023 AND 2030
- Figure 126:
- VOLUME OF THAILAND FORAGE CROPS SEED, METRIC TON, ASIA-PACIFIC, 2017 - 2030
- Figure 127:
- VALUE OF THAILAND FORAGE CROPS SEED, USD, ASIA-PACIFIC, 2017 - 2030
- Figure 128:
- VALUE SHARE OF THAILAND FORAGE CROPS SEED BY CROP, %, ASIA-PACIFIC, 2023 AND 2030
- Figure 129:
- VOLUME OF VIETNAM FORAGE CROPS SEED, METRIC TON, ASIA-PACIFIC, 2017 - 2030
- Figure 130:
- VALUE OF VIETNAM FORAGE CROPS SEED, USD, ASIA-PACIFIC, 2017 - 2030
- Figure 131:
- VALUE SHARE OF VIETNAM FORAGE CROPS SEED BY CROP, %, ASIA-PACIFIC, 2023 AND 2030
- Figure 132:
- VOLUME OF REST OF ASIA-PACIFIC FORAGE CROPS SEED, METRIC TON, ASIA-PACIFIC, 2017 - 2030
- Figure 133:
- VALUE OF REST OF ASIA-PACIFIC FORAGE CROPS SEED, USD, ASIA-PACIFIC, 2017 - 2030
- Figure 134:
- VALUE SHARE OF REST OF ASIA-PACIFIC FORAGE CROPS SEED BY CROP, %, ASIA-PACIFIC, 2023 AND 2030
- Figure 135:
- VOLUME OF FORAGE CROPS SEED BY BREEDING TECHNOLOGY CATEGORIES, METRIC TON, EUROPE, 2017 - 2030
- Figure 136:
- VALUE OF FORAGE CROPS SEED BY BREEDING TECHNOLOGY CATEGORIES, USD, EUROPE, 2017 - 2030
- Figure 137:
- VOLUME SHARE OF FORAGE CROPS SEED BY BREEDING TECHNOLOGY CATEGORIES, %, EUROPE, 2017 VS 2023 VS 2030
- Figure 138:
- VALUE SHARE OF FORAGE CROPS SEED BY BREEDING TECHNOLOGY CATEGORIES, %, EUROPE, 2017 VS 2023 VS 2030
- Figure 139:
- VOLUME OF FORAGE CROPS SEED BY CROP CATEGORIES, METRIC TON, EUROPE, 2017 - 2030
- Figure 140:
- VALUE OF FORAGE CROPS SEED BY CROP CATEGORIES, USD, EUROPE, 2017 - 2030
- Figure 141:
- VOLUME SHARE OF FORAGE CROPS SEED BY CROP CATEGORIES, %, EUROPE, 2017 VS 2023 VS 2030
- Figure 142:
- VALUE SHARE OF FORAGE CROPS SEED BY CROP CATEGORIES, %, EUROPE, 2017 VS 2023 VS 2030
- Figure 143:
- VOLUME OF FORAGE CROPS SEED BY COUNTRY, METRIC TON, EUROPE, 2017 - 2030
- Figure 144:
- VALUE OF FORAGE CROPS SEED BY COUNTRY, USD, EUROPE, 2017 - 2030
- Figure 145:
- VOLUME SHARE OF FORAGE CROPS SEED BY COUNTRY, %, EUROPE, 2017 VS 2023 VS 2030
- Figure 146:
- VALUE SHARE OF FORAGE CROPS SEED BY COUNTRY, %, EUROPE, 2017 VS 2023 VS 2030
- Figure 147:
- VOLUME OF FRANCE FORAGE CROPS SEED, METRIC TON, EUROPE, 2017 - 2030
- Figure 148:
- VALUE OF FRANCE FORAGE CROPS SEED, USD, EUROPE, 2017 - 2030
- Figure 149:
- VALUE SHARE OF FRANCE FORAGE CROPS SEED BY CROP, %, EUROPE, 2023 AND 2030
- Figure 150:
- VOLUME OF GERMANY FORAGE CROPS SEED, METRIC TON, EUROPE, 2017 - 2030
- Figure 151:
- VALUE OF GERMANY FORAGE CROPS SEED, USD, EUROPE, 2017 - 2030
- Figure 152:
- VALUE SHARE OF GERMANY FORAGE CROPS SEED BY CROP, %, EUROPE, 2023 AND 2030
- Figure 153:
- VOLUME OF ITALY FORAGE CROPS SEED, METRIC TON, EUROPE, 2017 - 2030
- Figure 154:
- VALUE OF ITALY FORAGE CROPS SEED, USD, EUROPE, 2017 - 2030
- Figure 155:
- VALUE SHARE OF ITALY FORAGE CROPS SEED BY CROP, %, EUROPE, 2023 AND 2030
- Figure 156:
- VOLUME OF NETHERLANDS FORAGE CROPS SEED, METRIC TON, EUROPE, 2017 - 2030
- Figure 157:
- VALUE OF NETHERLANDS FORAGE CROPS SEED, USD, EUROPE, 2017 - 2030
- Figure 158:
- VALUE SHARE OF NETHERLANDS FORAGE CROPS SEED BY CROP, %, EUROPE, 2023 AND 2030
- Figure 159:
- VOLUME OF POLAND FORAGE CROPS SEED, METRIC TON, EUROPE, 2017 - 2030
- Figure 160:
- VALUE OF POLAND FORAGE CROPS SEED, USD, EUROPE, 2017 - 2030
- Figure 161:
- VALUE SHARE OF POLAND FORAGE CROPS SEED BY CROP, %, EUROPE, 2023 AND 2030
- Figure 162:
- VOLUME OF ROMANIA FORAGE CROPS SEED, METRIC TON, EUROPE, 2017 - 2030
- Figure 163:
- VALUE OF ROMANIA FORAGE CROPS SEED, USD, EUROPE, 2017 - 2030
- Figure 164:
- VALUE SHARE OF ROMANIA FORAGE CROPS SEED BY CROP, %, EUROPE, 2023 AND 2030
- Figure 165:
- VOLUME OF RUSSIA FORAGE CROPS SEED, METRIC TON, EUROPE, 2017 - 2030
- Figure 166:
- VALUE OF RUSSIA FORAGE CROPS SEED, USD, EUROPE, 2017 - 2030
- Figure 167:
- VALUE SHARE OF RUSSIA FORAGE CROPS SEED BY CROP, %, EUROPE, 2023 AND 2030
- Figure 168:
- VOLUME OF SPAIN FORAGE CROPS SEED, METRIC TON, EUROPE, 2017 - 2030
- Figure 169:
- VALUE OF SPAIN FORAGE CROPS SEED, USD, EUROPE, 2017 - 2030
- Figure 170:
- VALUE SHARE OF SPAIN FORAGE CROPS SEED BY CROP, %, EUROPE, 2023 AND 2030
- Figure 171:
- VOLUME OF TURKEY FORAGE CROPS SEED, METRIC TON, EUROPE, 2017 - 2030
- Figure 172:
- VALUE OF TURKEY FORAGE CROPS SEED, USD, EUROPE, 2017 - 2030
- Figure 173:
- VALUE SHARE OF TURKEY FORAGE CROPS SEED BY CROP, %, EUROPE, 2023 AND 2030
- Figure 174:
- VOLUME OF UKRAINE FORAGE CROPS SEED, METRIC TON, EUROPE, 2017 - 2030
- Figure 175:
- VALUE OF UKRAINE FORAGE CROPS SEED, USD, EUROPE, 2017 - 2030
- Figure 176:
- VALUE SHARE OF UKRAINE FORAGE CROPS SEED BY CROP, %, EUROPE, 2023 AND 2030
- Figure 177:
- VOLUME OF UNITED KINGDOM FORAGE CROPS SEED, METRIC TON, EUROPE, 2017 - 2030
- Figure 178:
- VALUE OF UNITED KINGDOM FORAGE CROPS SEED, USD, EUROPE, 2017 - 2030
- Figure 179:
- VALUE SHARE OF UNITED KINGDOM FORAGE CROPS SEED BY CROP, %, EUROPE, 2023 AND 2030
- Figure 180:
- VOLUME OF REST OF EUROPE FORAGE CROPS SEED, METRIC TON, EUROPE, 2017 - 2030
- Figure 181:
- VALUE OF REST OF EUROPE FORAGE CROPS SEED, USD, EUROPE, 2017 - 2030
- Figure 182:
- VALUE SHARE OF REST OF EUROPE FORAGE CROPS SEED BY CROP, %, EUROPE, 2023 AND 2030
- Figure 183:
- VOLUME OF FORAGE CROPS SEED BY BREEDING TECHNOLOGY CATEGORIES, METRIC TON, MIDDLE EAST, 2017 - 2030
- Figure 184:
- VALUE OF FORAGE CROPS SEED BY BREEDING TECHNOLOGY CATEGORIES, USD, MIDDLE EAST, 2017 - 2030
- Figure 185:
- VOLUME SHARE OF FORAGE CROPS SEED BY BREEDING TECHNOLOGY CATEGORIES, %, MIDDLE EAST, 2017 VS 2023 VS 2030
- Figure 186:
- VALUE SHARE OF FORAGE CROPS SEED BY BREEDING TECHNOLOGY CATEGORIES, %, MIDDLE EAST, 2017 VS 2023 VS 2030
- Figure 187:
- VOLUME OF FORAGE CROPS SEED BY CROP CATEGORIES, METRIC TON, MIDDLE EAST, 2017 - 2030
- Figure 188:
- VALUE OF FORAGE CROPS SEED BY CROP CATEGORIES, USD, MIDDLE EAST, 2017 - 2030
- Figure 189:
- VOLUME SHARE OF FORAGE CROPS SEED BY CROP CATEGORIES, %, MIDDLE EAST, 2017 VS 2023 VS 2030
- Figure 190:
- VALUE SHARE OF FORAGE CROPS SEED BY CROP CATEGORIES, %, MIDDLE EAST, 2017 VS 2023 VS 2030
- Figure 191:
- VOLUME OF FORAGE CROPS SEED BY COUNTRY, METRIC TON, MIDDLE EAST, 2017 - 2030
- Figure 192:
- VALUE OF FORAGE CROPS SEED BY COUNTRY, USD, MIDDLE EAST, 2017 - 2030
- Figure 193:
- VOLUME SHARE OF FORAGE CROPS SEED BY COUNTRY, %, MIDDLE EAST, 2017 VS 2023 VS 2030
- Figure 194:
- VALUE SHARE OF FORAGE CROPS SEED BY COUNTRY, %, MIDDLE EAST, 2017 VS 2023 VS 2030
- Figure 195:
- VOLUME OF IRAN FORAGE CROPS SEED, METRIC TON, MIDDLE EAST, 2017 - 2030
- Figure 196:
- VALUE OF IRAN FORAGE CROPS SEED, USD, MIDDLE EAST, 2017 - 2030
- Figure 197:
- VALUE SHARE OF IRAN FORAGE CROPS SEED BY CROP, %, MIDDLE EAST, 2023 AND 2030
- Figure 198:
- VOLUME OF SAUDI ARABIA FORAGE CROPS SEED, METRIC TON, MIDDLE EAST, 2017 - 2030
- Figure 199:
- VALUE OF SAUDI ARABIA FORAGE CROPS SEED, USD, MIDDLE EAST, 2017 - 2030
- Figure 200:
- VALUE SHARE OF SAUDI ARABIA FORAGE CROPS SEED BY CROP, %, MIDDLE EAST, 2023 AND 2030
- Figure 201:
- VOLUME OF REST OF MIDDLE EAST FORAGE CROPS SEED, METRIC TON, MIDDLE EAST, 2017 - 2030
- Figure 202:
- VALUE OF REST OF MIDDLE EAST FORAGE CROPS SEED, USD, MIDDLE EAST, 2017 - 2030
- Figure 203:
- VALUE SHARE OF REST OF MIDDLE EAST FORAGE CROPS SEED BY CROP, %, MIDDLE EAST, 2023 AND 2030
- Figure 204:
- VOLUME OF FORAGE CROPS SEED BY BREEDING TECHNOLOGY CATEGORIES, METRIC TON, NORTH AMERICA, 2017 - 2030
- Figure 205:
- VALUE OF FORAGE CROPS SEED BY BREEDING TECHNOLOGY CATEGORIES, USD, NORTH AMERICA, 2017 - 2030
- Figure 206:
- VOLUME SHARE OF FORAGE CROPS SEED BY BREEDING TECHNOLOGY CATEGORIES, %, NORTH AMERICA, 2017 VS 2023 VS 2030
- Figure 207:
- VALUE SHARE OF FORAGE CROPS SEED BY BREEDING TECHNOLOGY CATEGORIES, %, NORTH AMERICA, 2017 VS 2023 VS 2030
- Figure 208:
- VOLUME OF FORAGE CROPS SEED BY CROP CATEGORIES, METRIC TON, NORTH AMERICA, 2017 - 2030
- Figure 209:
- VALUE OF FORAGE CROPS SEED BY CROP CATEGORIES, USD, NORTH AMERICA, 2017 - 2030
- Figure 210:
- VOLUME SHARE OF FORAGE CROPS SEED BY CROP CATEGORIES, %, NORTH AMERICA, 2017 VS 2023 VS 2030
- Figure 211:
- VALUE SHARE OF FORAGE CROPS SEED BY CROP CATEGORIES, %, NORTH AMERICA, 2017 VS 2023 VS 2030
- Figure 212:
- VOLUME OF FORAGE CROPS SEED BY COUNTRY, METRIC TON, NORTH AMERICA, 2017 - 2030
- Figure 213:
- VALUE OF FORAGE CROPS SEED BY COUNTRY, USD, NORTH AMERICA, 2017 - 2030
- Figure 214:
- VOLUME SHARE OF FORAGE CROPS SEED BY COUNTRY, %, NORTH AMERICA, 2017 VS 2023 VS 2030
- Figure 215:
- VALUE SHARE OF FORAGE CROPS SEED BY COUNTRY, %, NORTH AMERICA, 2017 VS 2023 VS 2030
- Figure 216:
- VOLUME OF CANADA FORAGE CROPS SEED, METRIC TON, NORTH AMERICA, 2017 - 2030
- Figure 217:
- VALUE OF CANADA FORAGE CROPS SEED, USD, NORTH AMERICA, 2017 - 2030
- Figure 218:
- VALUE SHARE OF CANADA FORAGE CROPS SEED BY CROP, %, NORTH AMERICA, 2023 AND 2030
- Figure 219:
- VOLUME OF MEXICO FORAGE CROPS SEED, METRIC TON, NORTH AMERICA, 2017 - 2030
- Figure 220:
- VALUE OF MEXICO FORAGE CROPS SEED, USD, NORTH AMERICA, 2017 - 2030
- Figure 221:
- VALUE SHARE OF MEXICO FORAGE CROPS SEED BY CROP, %, NORTH AMERICA, 2023 AND 2030
- Figure 222:
- VOLUME OF UNITED STATES FORAGE CROPS SEED, METRIC TON, NORTH AMERICA, 2017 - 2030
- Figure 223:
- VALUE OF UNITED STATES FORAGE CROPS SEED, USD, NORTH AMERICA, 2017 - 2030
- Figure 224:
- VALUE SHARE OF UNITED STATES FORAGE CROPS SEED BY CROP, %, NORTH AMERICA, 2023 AND 2030
- Figure 225:
- VOLUME OF REST OF NORTH AMERICA FORAGE CROPS SEED, METRIC TON, NORTH AMERICA, 2017 - 2030
- Figure 226:
- VALUE OF REST OF NORTH AMERICA FORAGE CROPS SEED, USD, NORTH AMERICA, 2017 - 2030
- Figure 227:
- VALUE SHARE OF REST OF NORTH AMERICA FORAGE CROPS SEED BY CROP, %, NORTH AMERICA, 2023 AND 2030
- Figure 228:
- VOLUME OF FORAGE CROPS SEED BY BREEDING TECHNOLOGY CATEGORIES, METRIC TON, SOUTH AMERICA, 2017 - 2030
- Figure 229:
- VALUE OF FORAGE CROPS SEED BY BREEDING TECHNOLOGY CATEGORIES, USD, SOUTH AMERICA, 2017 - 2030
- Figure 230:
- VOLUME SHARE OF FORAGE CROPS SEED BY BREEDING TECHNOLOGY CATEGORIES, %, SOUTH AMERICA, 2017 VS 2023 VS 2030
- Figure 231:
- VALUE SHARE OF FORAGE CROPS SEED BY BREEDING TECHNOLOGY CATEGORIES, %, SOUTH AMERICA, 2017 VS 2023 VS 2030
- Figure 232:
- VOLUME OF FORAGE CROPS SEED BY CROP CATEGORIES, METRIC TON, SOUTH AMERICA, 2017 - 2030
- Figure 233:
- VALUE OF FORAGE CROPS SEED BY CROP CATEGORIES, USD, SOUTH AMERICA, 2017 - 2030
- Figure 234:
- VOLUME SHARE OF FORAGE CROPS SEED BY CROP CATEGORIES, %, SOUTH AMERICA, 2017 VS 2023 VS 2030
- Figure 235:
- VALUE SHARE OF FORAGE CROPS SEED BY CROP CATEGORIES, %, SOUTH AMERICA, 2017 VS 2023 VS 2030
- Figure 236:
- VOLUME OF FORAGE CROPS SEED BY COUNTRY, METRIC TON, SOUTH AMERICA, 2017 - 2030
- Figure 237:
- VALUE OF FORAGE CROPS SEED BY COUNTRY, USD, SOUTH AMERICA, 2017 - 2030
- Figure 238:
- VOLUME SHARE OF FORAGE CROPS SEED BY COUNTRY, %, SOUTH AMERICA, 2017 VS 2023 VS 2030
- Figure 239:
- VALUE SHARE OF FORAGE CROPS SEED BY COUNTRY, %, SOUTH AMERICA, 2017 VS 2023 VS 2030
- Figure 240:
- VOLUME OF ARGENTINA FORAGE CROPS SEED, METRIC TON, SOUTH AMERICA, 2017 - 2030
- Figure 241:
- VALUE OF ARGENTINA FORAGE CROPS SEED, USD, SOUTH AMERICA, 2017 - 2030
- Figure 242:
- VALUE SHARE OF ARGENTINA FORAGE CROPS SEED BY CROP, %, SOUTH AMERICA, 2023 AND 2030
- Figure 243:
- VOLUME OF BRAZIL FORAGE CROPS SEED, METRIC TON, SOUTH AMERICA, 2017 - 2030
- Figure 244:
- VALUE OF BRAZIL FORAGE CROPS SEED, USD, SOUTH AMERICA, 2017 - 2030
- Figure 245:
- VALUE SHARE OF BRAZIL FORAGE CROPS SEED BY CROP, %, SOUTH AMERICA, 2023 AND 2030
- Figure 246:
- VOLUME OF REST OF SOUTH AMERICA FORAGE CROPS SEED, METRIC TON, SOUTH AMERICA, 2017 - 2030
- Figure 247:
- VALUE OF REST OF SOUTH AMERICA FORAGE CROPS SEED, USD, SOUTH AMERICA, 2017 - 2030
- Figure 248:
- VALUE SHARE OF REST OF SOUTH AMERICA FORAGE CROPS SEED BY CROP, %, SOUTH AMERICA, 2023 AND 2030
- Figure 249:
- MOST ACTIVE COMPANIES BY NUMBER OF STRATEGIC MOVES, COUNT, GLOBAL, 2017-2023
- Figure 250:
- MOST ADOPTED STRATEGIES, COUNT, GLOBAL, 2017-2023
- Figure 251:
- VALUE SHARE OF MAJOR PLAYERS, %, GLOBAL
Forage Seed Industry Segmentation
Hybrids, Open Pollinated Varieties & Hybrid Derivatives are covered as segments by Breeding Technology. Alfalfa, Forage Corn, Forage Sorghum are covered as segments by Crop. Africa, Asia-Pacific, Europe, Middle East, North America, South America are covered as segments by Region.| Breeding Technology | Hybrids | Non-Transgenic Hybrids | ||
| Transgenic Hybrids | Herbicide Tolerant Hybrids | |||
| Other Traits | ||||
| Open Pollinated Varieties & Hybrid Derivatives | ||||
| Crop | Alfalfa | |||
| Forage Corn | ||||
| Forage Sorghum | ||||
| Other Forage Crops | ||||
| Region | Africa | By Breeding Technology | ||
| By Crop | ||||
| By Country | Egypt | |||
| Ethiopia | ||||
| Ghana | ||||
| Kenya | ||||
| Nigeria | ||||
| South Africa | ||||
| Tanzania | ||||
| Rest of Africa | ||||
| Asia-Pacific | By Breeding Technology | |||
| By Crop | ||||
| Australia | ||||
| Bangladesh | ||||
| China | ||||
| India | ||||
| Indonesia | ||||
| Japan | ||||
| Myanmar | ||||
| Pakistan | ||||
| Philippines | ||||
| Thailand | ||||
| Vietnam | ||||
| Rest of Asia-Pacific | ||||
| Europe | By Breeding Technology | |||
| By Crop | ||||
| France | ||||
| Germany | ||||
| Italy | ||||
| Netherlands | ||||
| Poland | ||||
| Romania | ||||
| Russia | ||||
| Spain | ||||
| Turkey | ||||
| Ukraine | ||||
| United Kingdom | ||||
| Rest of Europe | ||||
| Middle East | By Breeding Technology | |||
| By Crop | ||||
| Iran | ||||
| Saudi Arabia | ||||
| Rest of Middle East | ||||
| North America | By Breeding Technology | |||
| By Crop | ||||
| Canada | ||||
| Mexico | ||||
| United States | ||||
| Rest of North America | ||||
| South America | By Breeding Technology | |||
| By Crop | ||||
| Argentina | ||||
| Brazil | ||||
| Rest of South America | ||||
Need A Different Region or Segment?
Customize Now
Market Definition
- Commercial Seed - For the purpose of this study, only commercial seeds have been included as part of the scope. Farm-saved Seeds, which are not commercially labeled are excluded from scope, even though a minor percentage of farm-saved seeds are exchanged commercially among farmers. The scope also excludes vegetatively reproduced crops and plant parts, which may be commercially sold in the market.
- Crop Acreage - While calculating the acreage under different crops, the Gross Cropped Area has been considered. Also known as Area Harvested, according to the Food & Agricultural Organization (FAO), this includes the total area cultivated under a particular crop across seasons.
- Seed Replacement Rate - Seed Replacement Rate is the percentage of area sown out of the total area of crop planted in the season by using certified/quality seeds other than the farm-saved seed.
- Protected Cultivation - The report defines protected cultivation as the process of growing crops in a controlled environment. This includes greenhouses, glasshouses, hydroponics, aeroponics, or any other cultivation system that protects the crop against any abiotic stress. However, cultivation in an open field using plastic mulch is excluded from this definition and is included under open field.
| Keyword | Definition |
|---|---|
| Row Crops | These are usually the field crops which include the different crop categories like grains & cereals, oilseeds, fiber crops like cotton, pulses, and forage crops. |
| Solanaceae | These are the family of flowering plants which includes tomato, chili, eggplants, and other crops. |
| Cucurbits | It represents a gourd family consisting of about 965 species in around 95 genera. The major crops considered for this study include Cucumber & Gherkin, Pumpkin and squash, and other crops. |
| Brassicas | It is a genus of plants in the cabbage and mustard family. It includes crops such as carrots, cabbage, cauliflower & broccoli. |
| Roots & Bulbs | The roots and bulbs segment includes onion, garlic, potato, and other crops. |
| Unclassified Vegetables | This segment in the report includes the crops which don’t belong to any of the above-mentioned categories. These include crops such as okra, asparagus, lettuce, peas, spinach, and others. |
| Hybrid Seed | It is the first generation of the seed produced by controlling cross-pollination and by combining two or more varieties, or species. |
| Transgenic Seed | It is a seed that is genetically modified to contain certain desirable input and/or output traits. |
| Non-Transgenic Seed | The seed produced through cross-pollination without any genetic modification. |
| Open-Pollinated Varieties & Hybrid Derivatives | Open-pollinated varieties produce seeds true to type as they cross-pollinate only with other plants of the same variety. |
| Other Solanaceae | The crops considered under other Solanaceae include bell peppers and other different peppers based on the locality of the respective countries. |
| Other Brassicaceae | The crops considered under other brassicas include radishes, turnips, Brussels sprouts, and kale. |
| Other Roots & Bulbs | The crops considered under other roots & bulbs include Sweet Potatoes and cassava. |
| Other Cucurbits | The crops considered under other cucurbits include gourds (bottle gourd, bitter gourd, ridge gourd, Snake gourd, and others). |
| Other Grains & Cereals | The crops considered under other grains & cereals include Barley, Buck Wheat, Canary Seed, Triticale, Oats, Millets, and Rye. |
| Other Fibre Crops | The crops considered under other fibers include Hemp, Jute, Agave fibers, Flax, Kenaf, Ramie, Abaca, Sisal, and Kapok. |
| Other Oilseeds | The crops considered under other oilseeds include Ground nut, Hempseed, Mustard seed, Castor seeds, safflower seeds, Sesame seeds, and Linseeds. |
| Other Forage Crops | The crops considered under other forages include Napier grass, Oat grass, White clover, Ryegrass, and Timothy. Other forage crops were considered based on the locality of the respective countries. |
| Pulses | Pigeon peas, Lentils, Broad and horse beans, Vetches, Chickpeas, Cowpeas, Lupins, and Bambara beans are the crops considered under pulses. |
| Other Unclassified Vegetables | The crops considered under other unclassified vegetables include Artichokes, Cassava Leaves, Leeks, Chicory, and String beans. |
Need More Details on Market Definition?
Ask a Question
Research Methodology
Mordor Intelligence follows a four-step methodology in all our reports.
- Step-1: IDENTIFY KEY VARIABLES: In order to build a robust forecasting methodology, the variables and factors identified in Step-1 are tested against available historical market numbers. Through an iterative process, the variables required for market forecast are set and the model is built on the basis of these variables.
- Step-2: Build a Market Model: Market-size estimations for the forecast years are in nominal terms. Inflation is not a part of the pricing, and the average selling price (ASP) is kept constant throughout the forecast period.
- Step-3: Validate and Finalize: In this important step, all market numbers, variables and analyst calls are validated through an extensive network of primary research experts from the market studied. The respondents are selected across levels and functions to generate a holistic picture of the market studied.
- Step-4: Research Outputs: Syndicated Reports, Custom Consulting Assignments, Databases, and Subscription Platforms

Get More Details On Research Methodology
Download PDF


