
Foot Orthotic Insoles Market Size and Share
Market Overview
| Study Period | 2020 - 2031 |
|---|---|
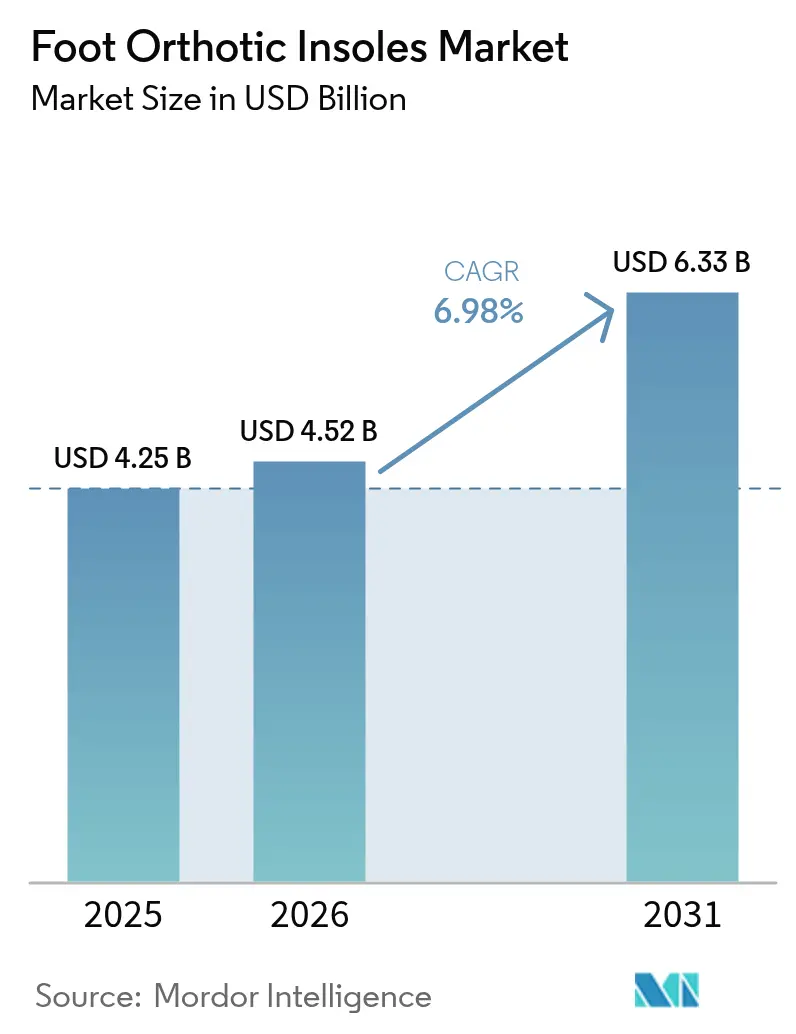
| Market Size (2026) | USD 4.52 Billion |
| Market Size (2031) | USD 6.33 Billion |
| Growth Rate (2026 - 2031) | 6.98 % |
| Fastest Growing Market | Asia-Pacific |
| Largest Market | North America |
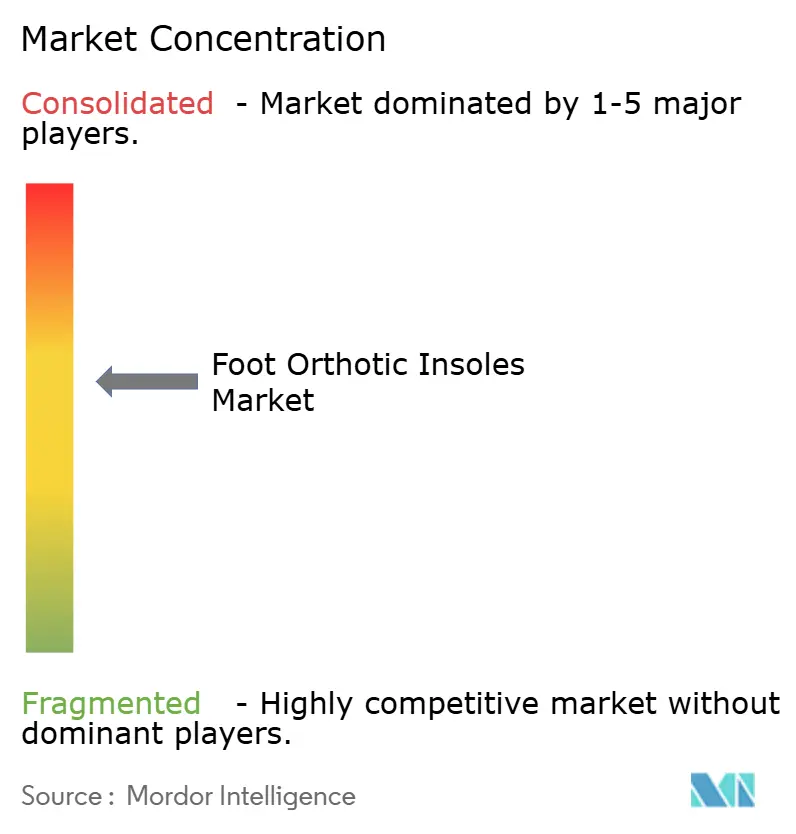
| Market Concentration | Medium |
Major Players *Disclaimer: Major Players sorted in no particular order Image © Mordor Intelligence. Reuse requires attribution under CC BY 4.0. | |
Foot Orthotic Insoles Market Analysis by Mordor Intelligence
The Foot Orthotic Insoles Market size was valued at USD 4.25 billion in 2025 and is estimated to grow from USD 4.52 billion in 2026 to reach USD 6.33 billion by 2031, at a CAGR of 6.98% during the forecast period (2026-2031).
Consistent demand stems from an aging population, escalating diabetes prevalence, and the rapid arrival of consumer-friendly scanning tools that compress fitting times and lower costs. Retailers now deploy AI kiosks that convert roughly one-third of walk-ins by matching real-time gait data with stocked SKUs, while smartphone LiDAR applications enable sub-millimeter home scans that feed the same design engines. These tools divert purchases away from clinic-only channels toward mass retail and direct-to-consumer sites, reshaping the competitive playbook. Material innovation adds momentum: carbon-fiber plates have proven energy-return benefits that resonate with runners, and thermoplastics support in-store heat molding that satisfies shoppers who refuse multi-week waits. Supply chains are adapting as well; EVA remains cost-efficient, yet composite inputs and lattice printing reduce scrap by up to 40%, helping brands protect margin against resin price swings.
Key Report Takeaways
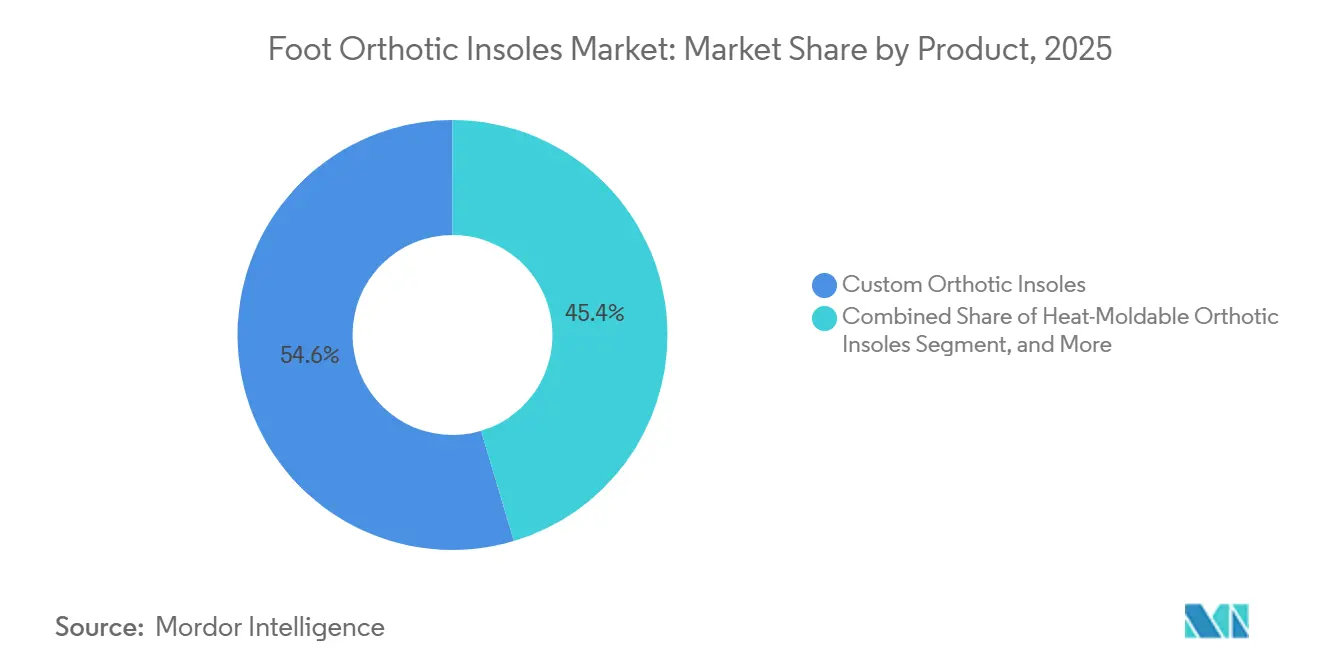
- By product type, custom orthotic insoles held 54.62% of foot orthotics insoles market share in 2025, while heat-moldable variants are expanding at a 7.52% CAGR to 2031.
- By material, EVA foam retained 28.91% share of the foot orthotics insoles market size in 2025; composite carbon fiber is forecast to grow at an 8.24% CAGR through 2031.
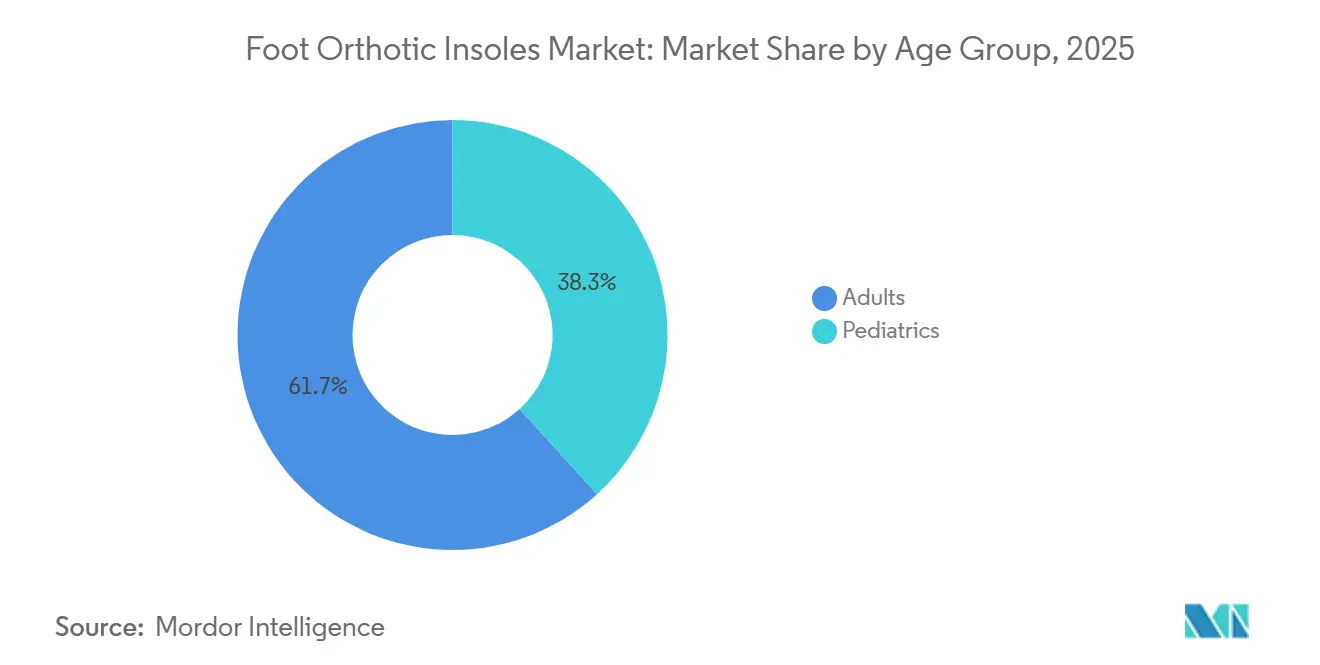
- By age group, adults accounted for 61.72% of 2025 revenue, whereas the pediatric segment is projected to advance at an 8.72% CAGR between 2026-2031.
- By application, medical indications dominated with 57.84% share in 2025, yet sports and athletics are on track for a 9.05% CAGR to 2031.
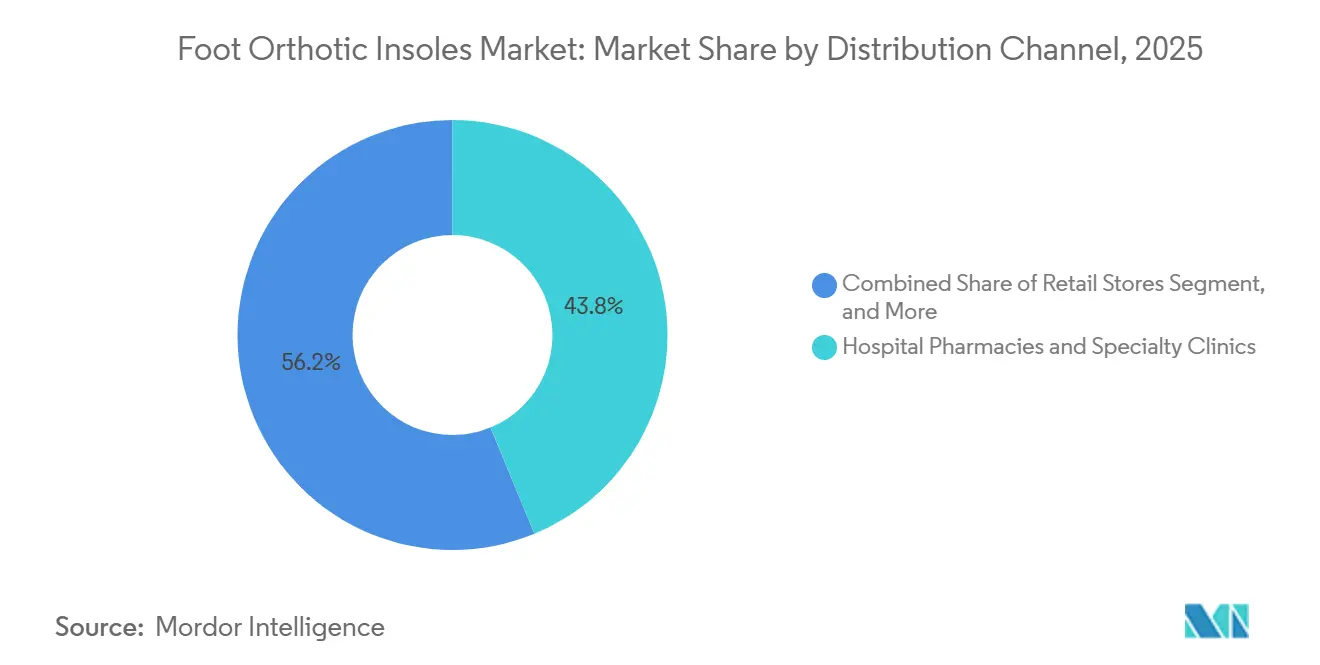
- By distribution channel, hospital pharmacies and specialty clinics captured 43.78% of 2025 sales, but online pharmacies are poised for an 11.99% CAGR over the same horizon.
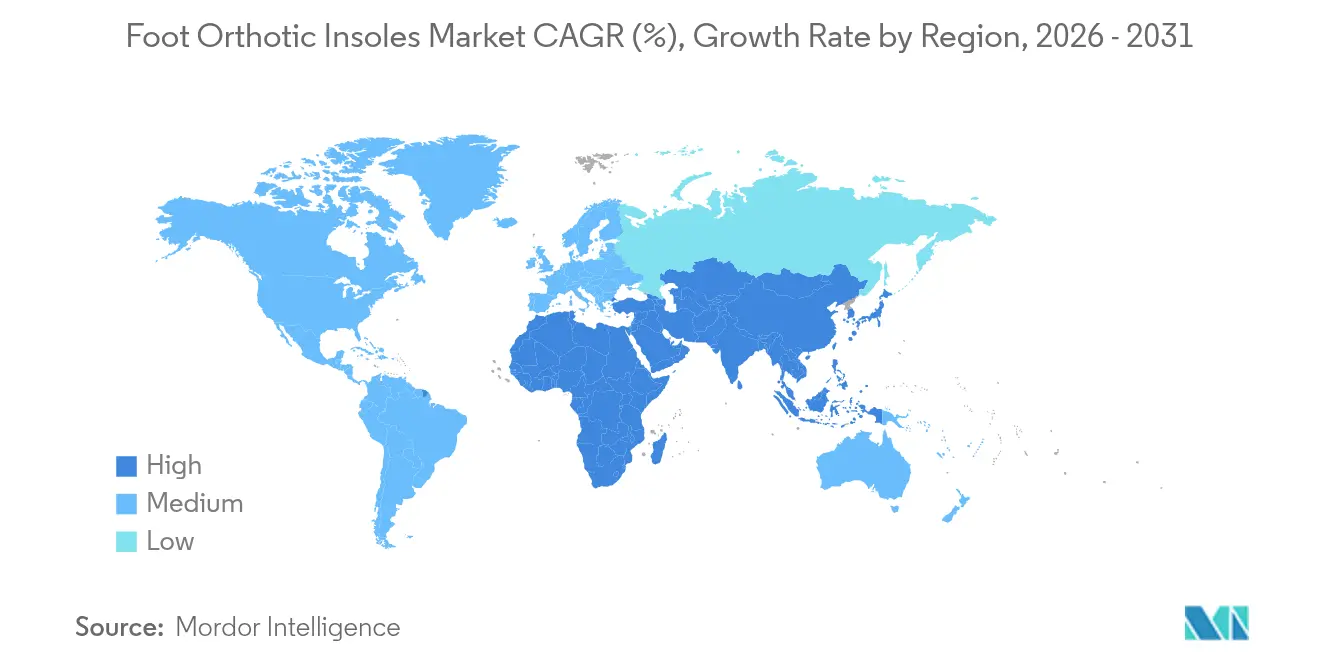
- By geography, North America accounted for 39.18% of the value in 2025; Asia-Pacific is the fastest-growing region, with a 7.99% CAGR through 2031.
Note: Market size and forecast figures in this report are generated using Mordor Intelligence’s proprietary estimation framework, updated with the latest available data and insights as of 2026.
Market Trends and Insights
Drivers Impact Analysis of Foot Orthotic Insoles Market*
| Driver | (~) % Impact on CAGR Forecast | Geographic Relevance | Impact Timeline |
|---|---|---|---|
| Ageing Demographic & Diabetes Prevalence | +1.8% | North America, Europe, urban Asia-Pacific | Long term (≥ 4 years) |
| Sports & Recreational Participation Boom | +1.2% | North America, Europe, expanding Asia-Pacific | Medium term (2-4 years) |
| Rapid Adoption of 3-D Scanning/Printing | +1.5% | North America, Europe early; Asia-Pacific scaling | Medium term (2-4 years) |
| AI-Enabled Retail Foot-Scan Kiosks | +0.9% | North America, Europe, pilot Asia-Pacific | Short term (≤ 2 years) |
| Employer-Funded Anti-Fatigue Programs | +0.6% | North America, Western Europe | Medium term (2-4 years) |
| Smartphones’ LiDAR Foot-Scan APIs | +1.0% | Digitally mature markets worldwide | Short term (≤ 2 years) |
| Source: Mordor Intelligence | |||
Ageing Demographic & Diabetes Prevalence
Global residents aged 60 and older are projected to reach 1.4 billion by 2030, and many experience plantar fasciitis, arthritis, or neuropathy that restricts mobility.[1] Diabetes prevalence is expected to hit 1.3 billion cases by 2050, intensifying pressure to prevent foot ulcers through pressure-redistributing insoles.[2] Medicare Part B covers 80% of allowable costs for custom orthoses prescribed for diabetic patients, effectively underwriting U.S. demand. Because older adults with diabetes face compounded gait challenges, insurers and clinicians align on early orthotic intervention, turning this demographic trend into a structural pull for the foot orthotics insoles market. As national health systems elsewhere follow the reimbursement template, baseline growth continues through 2031.
Sports & Recreational Participation Boom
Strava recorded 135 million users posting 15.3 billion activities in 2024, proof that running, cycling, and hiking have become daily habits across age brackets.[3] Athletes proactively pursue orthoses to delay fatigue and protect joints, a pattern reinforced by peer-reviewed studies showing that carbon-fiber inserts reduce energy loss during gait by nearly 10%. Superfeet and Brooks embed carbon plates at the factory, repositioning insoles as performance components rather than aftermarket add-ons. Margins improve because shoppers accept footwear package premiums instead of stand-alone device surcharges. As sports normalization rises in emerging Asia-Pacific metros, retailers replicate North American merchandising practices, widening the demand funnel for foot orthotic insoles.
Rapid Adoption of 3-D Scanning and Printing
Volumental’s cloud engine completes a foot scan in under 1 minute and integrates directly with point-of-sale software, eliminating the plaster cast entirely. Aetrex priced its Zoe Pro scanner at USD 1,995, a level accessible to mid-tier shoe stores, enabling instant personal recommendations. On the production side, Formlabs stereolithography lines print lattice midsoles that mirror EVA stiffness but cut material waste by 40%. Retailers, therefore, pivot to just-in-time custom output that shortens wait times from weeks to days and lets consumers co-design color or arch height. Clinical trials confirm biomechanical equivalence between 3-D-printed and conventionally milled orthoses, sweeping aside the final quality objection.
AI-Enabled Retail Foot-Scan Kiosks
In-store kiosks powered by machine-vision algorithms interpret pressure maps and suggest SKUs in less than 120 seconds. U.S. pharmacy chains deploying these systems record conversion lifts of 30% because the recommendation appears authoritative and instant. Early adopters in Europe report similar gains, especially when kiosks print a digital voucher redeemable online. Low hardware costs and cloud-based updates encourage rapid rollout across athletic specialty and pharmacy formats. For the foot orthotics insoles market, kiosks dissolve the referral bottleneck and hand retailers a credible biomechanical service without podiatrists on staff.
Restraints Impact Analysis of Foot Orthotic Insoles Market*
| Restraint | (~) % Impact on CAGR Forecast | Geographic Relevance | Impact Timeline |
|---|---|---|---|
| Limited consumer awareness in low-income regions | -0.9% | Emerging Asia, Latin America, Africa | Long term (≥ 4 years) |
| High cost of fully custom devices & weak reimbursement | -1.2% | Global, price-sensitive markets | Medium term (2-4 years) |
| Biomechanical risks from DTC comfort-only inserts | -0.6% | Developed markets | Short term (≤ 2 years) |
| Supply volatility in EVA & specialty polymers | -0.8% | Global; Asia-Pacific supply hubs | Short term (≤ 2 years) |
| Source: Mordor Intelligence | |||
High Cost & Limited Reimbursement
Custom pairs sell for USD 200-800, a bracket far above cash-pay comfort inserts. Medicare reimburses only diabetic indications, excluding sports or general wellness uses, and private insurers mirror those rules. Outside North America and Western Europe, insurance penetration is low, so consumers compare custom quotes to USD 50 drugstore alternatives. Margins compress, and vendors experiment with vertical integration to shave lead times and bill to flexible spending accounts, as seen in the Bilt Labs-Health-E Commerce partnership, which accesses 70 million FSA/HSA members. Until broader reimbursement arrives, the pricing gap restrains the foot orthotic insole market, particularly in middle-income economies.
Counterfeit/Low-Quality Products
Online marketplaces list imitation insoles priced under USD 10 that mimic branded packaging without biomechanical testing. These products underperform, sometimes aggravating foot pain, which erodes trust in legitimate brands. Authorities in China and India have stepped up border seizures, yet enforcement remains uneven. Recognized labels use serialized QR codes and warranty registration to authenticate inventory, but consumer education lags. Persistence of gray imports therefore drags on perceived value and slows upgrade cycles within the foot orthotics insoles market.
*Our forecasts treat driver/restraint impacts as directional, not additive. The impact forecasts reflect baseline growth, mix effects, and variable interactions.
Foot Orthotic Insoles Market Segment Analysis
By Product Type:
Heat-Moldable Gains on Custom’s Convenience GapCustom orthotic insoles accounted for 54.62% of 2025 revenue, yet heat-moldable models are projected to post a 7.52% CAGR, the highest among product types, as shoppers substitute immediate in-store fitting for multi-week lab waits. The foot orthotics insole market, which is attached to custom formats, still benefits from diabetic reimbursement, but convenience-oriented buyers tilt toward thermoplastic units that personalize in minutes.
Thermoplastics soften at 80-100 °C, so footwear associates can shape arches on the sales floor, and loyalty apps then store fit data for re-order prompts, reinforcing brand lock-in. Prefabricated insoles plug the value gap at USD 30-80 and enjoy pharmacy impulse placement, while hybrid lines such as Aetrex Lynco L2200 merge prefab arches with heat-moldable heel cups. As the category blurs, regulators continue to group all versions under the same Class I umbrella, leaving marketing language around “custom” loosely defined, intensifying the branding race in the foot orthotics insoles market.

By Material:
Carbon Fiber Disrupts EVA’s Cost DominanceEVA foam held 28.91% of 2025 revenue thanks to its low unit cost, but composite carbon fiber is set to advance at an 8.24% CAGR as elite and recreational runners pursue weight savings and rebound. Carbon’s premium positioning raises average selling price, expanding the foot orthotics insoles market size even when pair counts stay flat.
Biomechanics research shows carbon inserts trim energy loss during running stride by nearly a tenth, a measurable edge that justifies USD 80-150 ticket prices for performance models. Thermoplastic sheets supply heat-moldable lines, while gel and silicone dominate diabetic care for pressure redistribution. Leather remains a dress-shoe niche, valued for breathability more than support. Brand acquisitions of material suppliers, as OttoBock accomplished in 2024, signal a pivot toward upstream control that shields gross margin and accelerates prototyping in the foot orthotics insoles market.
By Age Group:
Pediatric Segment Gains Clinical ValidationAdults accounted for 61.72% of 2025 consumption, but pediatric pairs are forecast to grow at an 8.72% CAGR after randomized trials confirmed that orthoses ease pain in flexible flatfoot cases. Growth in children forces shorter replacement cycles, injecting recurring volume into the foot orthotics insoles market share equation.
Subscription models bundle scans with periodic refits, helping parents budget for natural foot growth and giving vendors predictable revenue. Colorful finishes and low-profile molds address compliance hurdles by ensuring devices fit school and athletic shoes. Evidence that prefabricated designs achieve results comparable to bespoke pairs in many pediatric cases also broadens access among budget-constrained households.
By Application:
Sports Segment Outpaces Medical’s Reimbursement AdvantageMedical indications controlled 57.84% of receipts in 2025, yet the sports and athletics lane is on track for a 9.05% CAGR, the swiftest among applications. Factory-installed plates in Brooks Glycerin exemplify how brands bake orthotic tech into mainstream footwear, pulling unit demand into first purchases rather than aftermarket add-ons.
Occupational safety programs are seeing steady uptake as human resources teams link anti-fatigue gear with reduced injury claims, and personal-comfort inserts appeal to clerical and service staff who stand for long hours. Lacking reimbursement, these cash-pay segments compel brands to foreground visible benefits, such as copper-infused antimicrobial linings or carbon-rebound metrics. The diverse use cases are expanding the foot orthotics insole market while challenging firms to segment their messaging precisely.
By Distribution Channel:
Online Pharmacies Disrupt Clinic-Centric ModelHospital pharmacies and specialty clinics captured 43.78% of 2025 sales, but online pharmacies are projected to grow at an 11.99% CAGR as platforms combine at-home impression kits with FSA/HSA eligibility. Seamless checkout without insurance pre-authorization resonates with younger buyers who view clinic visits as a source of friction.
Retail stores still matter for discovery; Dr. Scholl’s foot-mapping kiosks in 5,000 Walgreens locations upsell custom inserts in minutes, while sporting-goods chains pair Aetrex scanners with loyalty-app coupons. The most resilient brands cover all three routes: clinic credibility, retail trial, and e-commerce replenishment, so customers can stay within one ecosystem through life stages, sustaining volume inside the foot orthotics insoles market.
Geography Analysis
North America Foot Orthotic Insoles Market
North America retained 39.18% of 2025 revenue, as Medicare reimbursement for diabetic orthoses under HCPCS codes A5512-A5513 covered 80% of allowable charges, effectively subsidizing the core at-risk group. A deep innovation cluster, anchored by Volumental, Aetrex, and Superfeet, nurtures fast deployment of scanners and AI kiosks across pharmacy and sporting channels. Canada’s provincial health plans reimburse custom devices for medical diagnoses, though coverage stops at sports or comfort, keeping cash-pay niches lively. Mexico has early-stage but rising disposable income, and more running events push premium athletic insoles, despite limited diabetic reimbursement frameworks.
Europe Foot Orthotic Insoles Market
Europe sits second by value, propelled by Germany, the United Kingdom, and France, where podiatric density and social-insurance schemes normalize orthotic prescriptions. The EU Medical Device Regulation classifies custom insoles as Class I, so entry barriers stay modest while post-market surveillance safeguards quality. German players Bauerfeind and OttoBock leverage vertical integration to speed heat-moldable launches, and Birkenstock’s 2024 investment in 3-D printing extends footbed expertise into therapeutic niches. NHS-backed trials showing prefab efficacy influence payer panels across the continent, nudging purchasing from custom to mid-priced alternatives and widening consumer choice in the foot orthotics insole market.
APAC, MEA and South America Foot Orthotic Insoles Market
Asia-Pacific is forecast to post a 7.99% CAGR to 2031, the fastest regional pace. China hosts 140.9 million adults with diabetes, forming a vast preventive-care addressable base. Yet out-of-pocket spending dampens immediate uptake outside urban centers. Japan’s aging demographics spur integration of orthotic plates into walking shoes, while India’s domestic brand Tynor scales value prefabs through pharmacy chains. Australia blends a strong sports culture with universal health coverage, driving early adoption of carbon composites. Middle East & Africa and South America lag because of price sensitivity and lower clinician coverage, but pilot e-commerce programs with smartphone scanning hint at future catch-up once awareness and payment options improve.
Regulatory Landscape
In the United States, foot orthoses and related corrective footwear products are generally regulated as Class I medical devices under 21 CFR 890.3475 (FDA product code KNP), and many are exempt from 510(k) premarket notification. Even with exemption, manufacturers and private-label marketers still need to align labeling and documentation with the device intended use, maintain complaint files and records, and manage the split between medical claims (device) and comfort or wellness positioning (often sold outside the medical-device framework depending on claims).
In Europe, Regulation (EU) 2017/745 (MDR) governs orthotic insoles sold with a medical purpose, with additional obligations for custom-made devices versus mass-produced stock items, including technical documentation and post-market surveillance expectations supported by MDCG guidance on custom-made devices. In the United Kingdom, MHRA guidance similarly differentiates between products marketed for general use and those marketed for a specific medical purpose. Mass-produced orthotic devices intended for medical use generally sit within Class I, which keeps market entry relatively accessible while raising the importance of compliant claims, documentation, and traceability in cross-border sales.
Competitive Landscape
No single vendor exceeds a mid-teens share of revenue, so rivalry centers on scanning accuracy, materials science, and omnichannel reach. Aetrex’s Albert 3D Pro device captures 16-foot dimensions and feeds dynamic arch profiles straight to point-of-sale cash desks, lifting conversion rates by 30% for partner stores. Volumental processes more than 1 million cloud scans each month, and its AI engine pinpoints shoe recommendations that cut online return rates by 20%. Brands that can make this data portable across in-store, web, and mobile win higher lifetime value because a shopper’s digital foot twin unlocks frictionless re-orders across seasons.
Material leadership also differentiates. Superfeet’s carbon platform underpins Brooks Running’s Glycerin and Ghost models, embedding orthotic features at the factory and redirecting margin from aftermarket retailers to footwear OEMs. OttoBock’s acquisition of a thermoplastic plant secures substrate supply for heat-moldable lines and trims, resulting in a 10-day to 3-week lead time. Direct-to-consumer newcomers such as Bilt Labs and Upstep unbundle the clinic visit through phone scanning, delivering custom pairs at USD 199 with satisfaction guarantees that overcome first-purchase hesitancy.
Legacy medical-device firms face a strategic fork: double down on reimbursed diabetic channels or pivot into retail and digital arenas that demand marketing heft and UX design rather than physician outreach. The FDA’s Class I exemption levels regulatory hurdles, allowing rapid SKU refresh but also inviting fashion brands like Vionic to integrate arch support into apparel-driven silhouettes. As a result, the foot orthotics insoles market rewards agility over scale, and alliances between scanner software, material innovators, and lifestyle labels form the new center of gravity.
Foot Orthotic Insoles Industry Leaders
-
DJO Global Inc.
-
Acor Orthopedic, Inc.
-
Aetrex Worldwide, Inc.
-
Algeo Limited
-
Dr. Scholl's
- *Disclaimer: Major Players sorted in no particular order
Foot Orthotic Insoles Market Companies Covered in this Report
- Acor Orthopedic
- Algeo
- Aetrex Worldwide Inc.
- Amfit
- Bauerfeind
- Birkenstock Digital GmbH
- Blatchford Group Ltd.
- ComfortFit Orthotic Labs Inc.
- Digital Orthotics Laboratories Australia Pty Ltd.
- Dr. Scholl’s
- DJO Global
- Euroleathers
- Footbalance Systems Ltd.
- Hanger Inc.
- Implus Footcare LLC
- OttoBock SE & Co. KGaA
- PowerStep (Stable Step LLC)
- Sidas SAS
- Spenco Medical Corporation
- Superfeet Worldwide LLC
- Tynor Orthotics Pvt. Ltd.
- Vionic Group LLC
Market Opportunities and Future Outlook
Digital measurement and automated manufacturing workflows are creating more commercial space between clinic-made custom devices and commodity comfort inserts. Retail and sports channels are already putting scanning into the purchase journey, including Dr. Scholl's foot-mapping kiosks deployed in roughly 5,000 Walgreens locations and Aetrex rolling out Albert Pro 3D scanners in performance settings. These approaches support faster product selection and repeat purchases linked to stored fit profiles.
On the supply side, additive manufacturing and software-led design automation are pushing orthotic production toward on-demand, distributed models that can reduce lead times and scrap. That shift complements the market movement toward heat-moldable and hybrid personalization. Activity around integrated platforms for orthopedic 3D printing, along with FDA alignment to ISO 13485:2016 through the QMSR update effective February 2, 2026, supports investment in standardized digital quality systems that can scale across clinics, retail partners, and online pharmacies. This opens room for offerings that bundle scanning, design, and fulfillment as a service for brands and providers, while sensor-enabled orthotics and plantar-pressure feedback remain a product-development gap for differentiated medical and athletic use cases.
Recent Industry Developments in Foot Orthotic Insoles Market
- June 2026: Aetrex partnered with IMG Academy to install five Albert Pro 3D foot scanners at its Bradenton, Florida campus to support student-athlete foot scanning and athletic insole fitting. The placement embeds measurement and recommendation workflows directly into an elite sports environment, which supports demand for performance-oriented orthotics and repeatable data-driven replenishment.
- January 2025: Zimmer Biomet announced a definitive agreement to acquire Paragon 28, expanding its position in foot-and-ankle solutions. The agreement increased strategic attention and investment capacity in adjacent foot-care categories, affecting competitive intensity around clinically positioned lower-extremity products.
- February 2024: Hanger completed its acquisition of Fillauer, combining manufacturing capabilities with a large clinical care network. The integration supports broader distribution reach and tighter control over fabrication and fitting workflows, which can accelerate adoption of digitized orthotic processes across provider channels.
Foot Orthotic Insoles Market Report Scope and Research Methodology
Market Definition and Coverage
In this study, the foot orthotic insoles market covers the value of in-shoe inserts made or selected to improve foot support, alignment, and comfort for medical and non-medical use, sold through clinical and retail channels across major regions.
Scope exclusions: We exclude foot and ankle surgical implants, braces, and compression products that are not primarily in-shoe insole solutions.
Segments Covered in This Report
- By Product Type
- Custom Orthotic Insoles
- Prefabricated Orthotic Insoles
- Heat-Moldable Orthotic Insoles
- By Material
- Ethyl-Vinyl Acetate (EVA) Foam
- Thermoplastics
- Composite Carbon Fiber
- Foam & Memory Foam
- Gel & Silicone
- Leather
- Other Materials
- By Age Group
- Adults
- Pediatrics
- By Application
- Medical
- Sports & Athletics
- Personal Comfort
- Occupational Safety
- By Distribution Channel
- Hospital Pharmacies & Specialty Clinics
- Retail Stores
- Online Pharmacies
- By Geography
- North America
- United States
- Canada
- Mexico
- Europe
- Germany
- United Kingdom
- France
- Italy
- Spain
- Rest of Europe
- Asia-Pacific
- China
- Japan
- India
- Australia
- South Korea
- Rest of Asia-Pacific
- Middle East & Africa
- GCC
- South Africa
- Rest of Middle East & Africa
- South America
- Brazil
- Argentina
- Rest of South America
- North America
Data Sources, Market Sizing, and Validation
Desk Research
Desk work started with clarifying what counts as an orthotic insole versus adjacent foot-care items, then mapping how products move from manufacturers to clinics, retailers, and online stores. We referenced public sources such as the US FDA device and recall databases, the US International Trade Commission trade statistics, and World Health Organization and CDC indicators for obesity and diabetes, along with peer-reviewed biomechanics and podiatry journals, to understand demand drivers and usage patterns. Pricing and product mix signals were cross-checked using company annual reports, investor presentations, and reputable press coverage on launches and channel expansion.
To convert these signals into a model, we also used paid subscriptions for company financials and intelligence, patent databases for material and design trends, and an import-export shipment-level dataset to sanity-check trade movement of insole-related categories where it was relevant. These inputs helped us form a consistent view of average selling prices, channel splits, and regional growth cues before testing assumptions with expert conversations. The sources listed above are illustrative, and we also used other public documents and datasets for data collection, validation, and clarification.
Primary Interviews and Surveys
Primary work focused on validating the real-world split between custom, prefabricated, and heat-moldable offerings, and how pricing varies by material, application, and channel. We interviewed clinic-side experts, distributors, and brand-side leaders across APAC, EMEA, and the Americas to confirm adoption, replacement cycles, and which demand indicators are most closely tied to year-to-year movement for the market.
Distribution of primary research fieldwork respondents
| Company type | Respondent position | Region |
|---|---|---|
| Top tier: 31% | CXOs: 13% | APAC: 48% |
| Mid tier: 52% | Functional/Unit leaders: 38% | EMEA: 34% |
| Smaller Players: 17% | Managers: 49% | Americas: 18% |
Market-Sizing & Forecasting
The market was modeled using a top-down and bottom-up approach, where demand pools were first reconstructed from health and activity indicators, then checked against supply-side and channel realities. On the top-down side, we translated addressable consumers and patients into expected insole purchases using factors such as diabetes and obesity prevalence, sports participation trends, age mix, and typical replacement frequency by use case. Those demand totals were then converted to value by applying average selling prices that vary by product type (custom, prefabricated, heat-moldable), material mix, and channel, since a clinic-dispensed custom insole does not price like a retail comfort insole.
To corroborate totals, we used selective bottom-up approximations, including revenue roll-ups for relevant product lines where disclosures were clear, plus channel checks on clinic volume throughput and retail and online assortment pricing. When a company did not report insole-only revenue, we handled the gap by using product mix shares validated in interviews and by aligning with observed catalog breadth and regional presence. For forecasting, we leaned on scenario analysis because demand and pricing shift differently across medical and sports applications, and because channel changes, including online growth and clinic capacity constraints, can alter the realized mix. Scenarios were anchored to expert views on material cost pass-through, normalization of promotional activity, and the uptake pace for advanced materials like composites.
Data Validation & Update Cycle
Before finalizing values, outputs were triangulated against independent signals such as medical device registrations and recalls, trade movement patterns, and reported growth commentary from public companies active in foot care. Outliers were investigated with simple variance checks by region and channel, then reviewed again at the assumption level so the logic remained consistent across years. Where the model produced unexpected jumps, we re-contacted interviewees to determine whether the change was driven by underlying demand, mix shifts, or pricing.
Each report is refreshed annually, with interim updates when material events occur that can affect sizing inputs, for example major regulatory actions, large pricing resets, or step-changes in raw material costs that influence ASPs. Before delivery, an analyst performs a final pass to ensure the latest macro indicators and market events are reflected in the current-year estimate and the forward outlook.
Mordor Intelligence's Foot Orthotics Insoles Market Size Compared With Other Published Estimates
Published market sizes for foot orthotic insoles can differ more than buyers expect because the product boundary is not handled the same way across studies, and because pricing assumptions can move totals quickly. Differences also show up when one study anchors the current year on older ASP snapshots, or when it uses a currency conversion point that does not match the market year being reported.
In this report, the bigger gap drivers were whether comfort insoles sold through retail and online were included alongside medical-grade orthotics, how custom versus prefabricated shares were set, and how replacement cycles were treated for sports and occupational uses. By refreshing ASPs and currency timing close to the stated market year, and by re-checking assumptions with channel-side interviews, the 2025 sizing stays aligned to observed price bands and mix shifts, which is why the final number lands where it does for Mordor Intelligence.
Benchmark comparison
| Source | Market Size | Gaps in Research Methodology |
|---|---|---|
| Mordor Intelligence | USD 4.25 B (2025) | |
| Global Consultancy A | USD 4.80 B (2024) | Uses a 2024 base and applies a broader retail-insole definition, which can pull in comfort-oriented units and push up value through higher assumed volumes. |
| Industry Publisher B | USD 3.83 B (2025) | Relies on a narrower pricing curve and more uniform ASP assumptions across regions, which can undercount higher-priced custom and clinic-dispensed demand. |
The table shows that most of the spread is explained by timing and pricing mechanics, followed by what each source counts as in-scope insole. When scope is kept consistent and the ASP pathway is updated using channel checks, the market value is easier to trace back to clear variables and repeatable steps, which is usually what decision-makers need for planning.
Key Questions Answered in the Report
What is the projected value of the foot orthotics insoles market by 2031?
It is forecast to reach USD 6.33 billion, expanding at a 6.98% CAGR from 2026-2031.
Which product category currently leads revenue?
Custom orthotic insoles captured 54.62% of 2025 sales thanks to clinical efficacy and diabetic reimbursement support.
Which application will grow the fastest through 2031?
Sports and athletics are projected to register a 9.05% CAGR as performance footwear brands integrate carbon-fiber plates.
Why are online pharmacies gaining share?
Platforms that combine smartphone scans, at-home kits, and FSA/HSA payments remove clinic visits and are forecast to grow at 11.99% CAGR.
Which material is gaining popularity among athletes?
Composite carbon fiber is advancing at an 8.24% CAGR because it reduces energy loss during operation and enhances durability.