
Market Overview
| Study Period | 2020 - 2031 |
|---|---|
| Market Size (2026) | USD 78.98 Billion |
| Market Size (2031) | USD 102.79 Billion |
| Growth Rate (2026 - 2031) | 5.41 % |
| Fastest Growing Market | Middle East and Africa |
| Largest Market | Asia Pacific |
| Market Concentration | Low |
Major Players *Disclaimer: Major Players sorted in no particular order Image © Mordor Intelligence. Reuse requires attribution under CC BY 4.0. | |
Foodservice Disposable Packaging Market Analysis by Mordor Intelligence
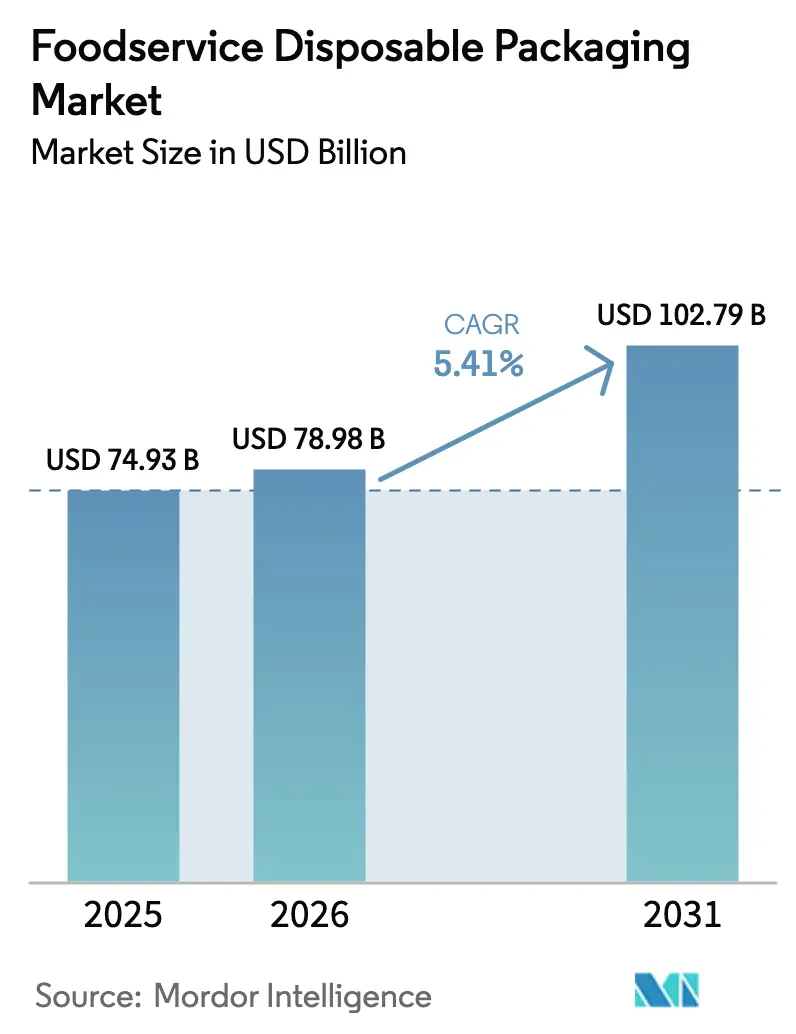
The foodservice disposable packaging market size was valued at USD 74.93 billion in 2025 and estimated to grow from USD 78.98 billion in 2026 to reach USD 102.79 billion by 2031, at a CAGR of 5.41% during the forecast period (2026-2031). This performance confirms a resilient upward trajectory for the foodservice disposable packaging market despite cost inflation and regulatory pressure. Heightened off-premise dining, stricter material safety rules, and rapid institutional adoption continue to propel demand. Regulatory frameworks in the European Union and Asia-Pacific are accelerating material innovation toward fiber and bio-plastic formats, while digital food ordering underscores the need for tamper-evident containers that safeguard brand trust. Manufacturers are therefore prioritizing barrier technologies that exclude PFAS, improve recyclability, and reduce carbon footprints. Concurrently, supply-chain volatility—especially in polylactic acid (PLA) resin—has prompted regional production shifts and price hedging strategies. Competitive intensity remains moderate, with consolidation underway as firms pursue scale and research synergies to meet evolving customer specifications.
Key Report Takeaways
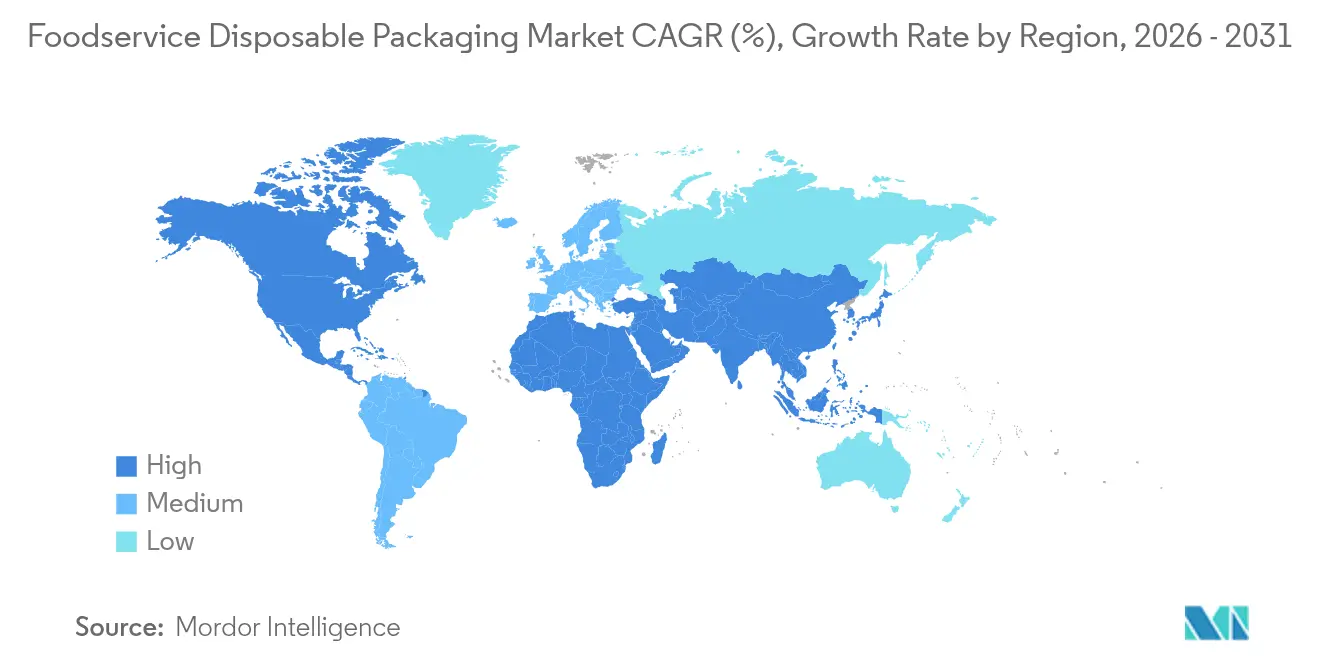
- By geography, Asia-Pacific led with 42.10% of foodservice disposable packaging market share in 2025, while the Middle East & Africa region is advancing at a 6.95% CAGR toward 2031.
- By material, plastics retained 48.85% share of the foodservice disposable packaging market size in 2025, whereas biodegradable and compostable formats are expanding at a 8.88% CAGR.
- By product type, cups & lids secured 26.21% of the foodservice disposable packaging market share in 2025; trays & plates are set to grow at 6.92% CAGR through 2031.
- By end user, quick-service restaurants accounted for 52.00% share of the foodservice disposable packaging market size in 2025, while ghost and cloud kitchens are rising at a 8.74% CAGR.
- By distribution channel, direct sales represented 56.20% of the foodservice disposable packaging market size in 2025; indirect channels are forecast to increase at 6.60% CAGR to 2031.
Note: Market size and forecast figures in this report are generated using Mordor Intelligence’s proprietary estimation framework, updated with the latest available data and insights as of 2026.
Market Trends and Insights
Drivers Impact Analysis of Foodservice Disposable Packaging Market*
| Driver | (~) % Impact on CAGR Forecast | Geographic Relevance | Impact Timeline |
|---|---|---|---|
| Surge in ghost kitchens and online delivery boosting tamper-evident packaging demand | +1.2% | Global – North America & Asia-Pacific core | Medium term (2-4 years) |
| EU and Asian sustainability mandates shifting demand to fiber-based packaging | +0.9% | Europe & Asia-Pacific with spill-over to North America | Long term (≥ 4 years) |
| Expansion of QSR chains in various countries | +0.8% | Global – strongest in emerging markets | Medium term (2-4 years) |
| Post-hygiene focus raising single-use trays in Middle-East institutions | +0.6% | Middle East & Africa; institutional sectors globally | Short term (≤ 2 years) |
| Adoption of heat-resistant molded-fiber bowls for hot off-premise meals | +0.5% | North America & Europe; expanding to Asia-Pacific | Medium term (2-4 years) |
| Diversified beverage menus driving cup-lid innovation | +0.4% | Global – led by North America & Europe | Short term (≤ 2 years) |
| Source: Mordor Intelligence | |||
Surge in Ghost Kitchens and Online Delivery Boosting Tamper-Evident Packaging Demand
Digital ordering now represents 40% of total U.S. restaurant sales, compelling operators without dining rooms to treat packaging as their primary brand touchpoint. Tamper-evident solutions such as DayMark Safety Systems’ TamperSeal labels and Dart Container’s ClearPac SafeSeal hinge technology reassure customers by showing visible breach indicators. [1]DayMark Safety Systems, “TamperSeal Labels,” daymarksafety.comBecause third-party platforms rank restaurants partly on security scores, adoption of such packaging is now a competitive necessity. Operators also favour integrated tamper features over add-on shrink bands to reduce labour steps and material usage.
EU and Asian Sustainability Mandates Shifting Demand to Fiber-Based Packaging
The European Union’s Packaging and Packaging Waste Regulation, effective February 2025, requires all packaging to achieve recyclability by 2030 and bans PFAS in food contact materials. Parallel policies—China’s GB 4806.15-2024 for food-contact adhesives and Japan’s Positive List for synthetic resins—tighten compliance thresholds across Asia. Producers such as Huhtamaki have scaled fiber-lid capacity in Northern Ireland to match this regulatory pull. Together, these rules reposition fiber as a compliance imperative rather than a voluntary sustainability choice, pushing global brands to redesign legacy SKUs.
Expansion of QSR Chains in Various Countries
Global quick-service chains are opening new outlets while tailoring menus to local tastes, driving uniform yet flexible packaging lines. Burger King’s roll-out of fibre-based wraps illustrates how multinational players reconcile brand consistency with country-specific material laws. Pactiv Evergreen’s SmartPour containers, featuring resealable closures, reduce ingredient loss and enhance in-store efficiency, thereby supporting faster counter-service formats. Segment growth thus stems not only from outlet expansion but also from packaging innovations that reduce service friction.
Post-Hygiene Focus Raising Single-Use Trays in Middle-East Institutions
Hospitals, universities, and large-scale canteens across the GCC have tightened hygiene protocols, favouring disposable trays that limit cross-contamination. Hotpack’s decision to invest USD 100 million in a New Jersey plant will supply both North American buyers and Middle-East export demand with customised single-use formats. Government procurement guidelines that weigh nutritional and environmental factors further reinforce purchase of compostable or recyclable trays, especially where dish-washing logistics are limited.
Restraints Impact Analysis of Foodservice Disposable Packaging Market*
| Restraint | (~) % Impact on CAGR Forecast | Geographic Relevance | Impact Timeline |
|---|---|---|---|
| High production costs: a major barrier to paper packaging adoption | -0.8% | Global – strongest in emerging markets | Medium term (2-4 years) |
| Municipal PFAS bans reducing viability of existing inventory | -0.6% | North America & Europe with ripple to Asia-Pacific | Short term (≤ 2 years) |
| PLA resin supply bottlenecks elevating bioplastic costs | -0.5% | Global – production centered in Asia-Pacific | Medium term (2-4 years) |
| Aggregator consolidation squeezing unit pricing for suppliers | -0.4% | North America & Europe delivery markets | Long term (≥ 4 years) |
| Source: Mordor Intelligence | |||
High Production Costs: A Major Barrier to Paper Packaging Adoption
A second wave of containerboard price hikes of USD 70 per metric ton took effect in January 2025, burdening operators who had already absorbed earlier inflation. [2]Creative Edge Packaging, “Navigating the USD 70 Per Ton Increase,” cepkg.comEnergy and freight surcharges compound the premium for fibre formats over conventional plastics, slowing substitution in cost-sensitive emerging markets. Smaller foodservice businesses with tight cash flow have little bargaining power and often postpone switching to compostable paper, even where regulations encourage it.
Municipal PFAS Bans Reducing Viability of Existing Inventory
The U.S. FDA has ruled 35 PFAS-related food-contact notifications inactive, forcing a nationwide sell-through deadline of June 2025. [3]U.S. Food and Drug Administration, “Determination on 35 PFAS Notifications,” fda.govEleven U.S. states already enforce separate bans, complicating inventory planning for multi-state distributors. Manufacturers holding legacy stock face write-downs, and retailers must vet incoming supplies to avoid non-compliant materials.
*Our forecasts treat driver/restraint impacts as directional, not additive. The impact forecasts reflect baseline growth, mix effects, and variable interactions.
Foodservice Disposable Packaging Market Segment Analysis
By Material Type:
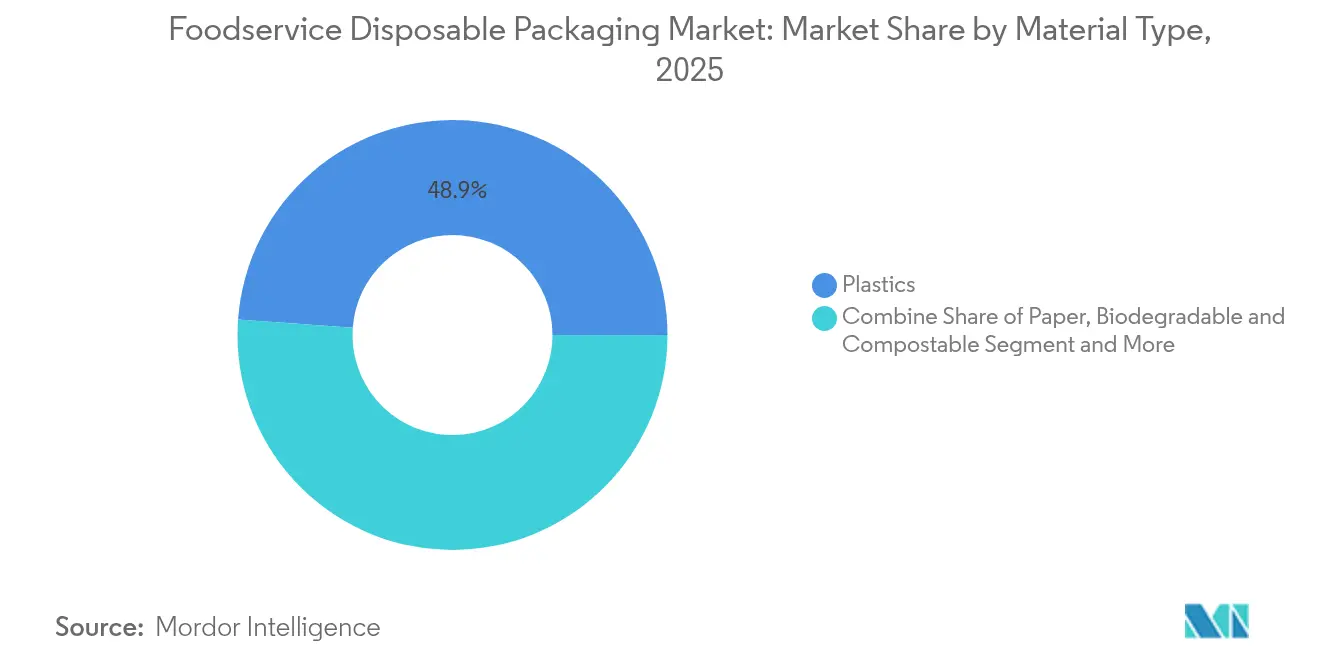
Biodegradable Surge Challenges Plastic DominancePlastics held 48.85% of foodservice disposable packaging market share in 2025, yet biodegradable and compostable formats are accelerating at a 8.88% CAGR. Braskem’s launch of WENEW bio-circular polypropylene sourced from used cooking oil shows how drop-in replacements can decarbonise mainstream resin grades without performance loss. Amcor has secured European patents for AmFiber Performance Paper, a high-barrier recyclable paper that competes directly with metallised films. Graphic Packaging’s oven-ready PaperSeal Cook Tray extends fibre utility to hot applications, broadening addressable end-use cases.
Momentum in this segment also rides on supply-side capacity: global PLA production topped 700 kilotons in 2022, with Asia-Pacific controlling 70% of output and 60% of consumption. BioPak eliminated PFAS from its plant-fibre line in July 2024 and introduced PHA-lined coffee cups that meet home-compost standards. Sabert’s Pulp Ultra containers underscore how moisture-resistant coatings can allow fibre to displace plastic in greasy hot-food contexts. Collectively, these developments signal a tipping point where technical hurdles are receding faster than cost premiums.


By Product Type:
Trays Accelerate as Cups Maintain LeadershipCups & lids commanded 26.21% of the foodservice disposable packaging market size in 2025, supported by continued beverage innovation. SIG’s bag-in-box solution for cold-brew coffee trims weight versus glass and improves shelf-life. Conversely, trays & plates are projected to grow at a 6.92% CAGR as hot meal delivery proliferates. Huhtamaki’s fibre ready-meal trays for Nordic supermarkets prove that ovenable fibre can satisfy retail as well as foodservice channels.
Growth in trays is also linked to institutional catering where single-use solutions remain hygiene-critical. SEE’s compostable meat trays—54% bio-based and 45% recycled—illustrate hybrid material strategies that ease operator transition. ProAmpac’s leak-resistant RotiBag provides heat retention, integrated handles, and reduced packaging weight, demonstrating how targeted design solves delivery pain points while using fewer materials.
By End User:
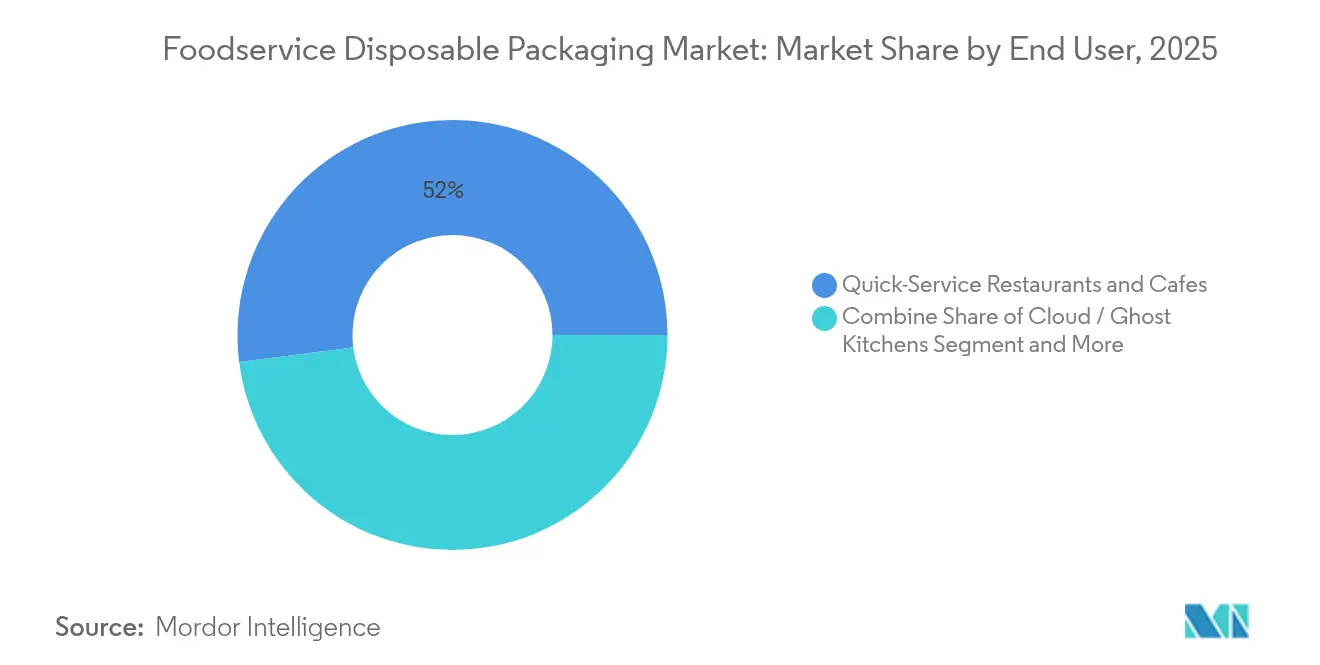
Ghost Kitchens Disrupt QSR DominanceQuick-service restaurants still account for 52.00% of the foodservice disposable packaging market size in 2025 due to network scale and standardised menus. Nevertheless, ghost kitchens are expanding at a 8.74% CAGR, making them the fastest-growing end-user group. Their model eliminates dine-in space but places higher functional and aesthetic burdens on packaging, which becomes the only physical brand experience. Tamper evidence, temperature retention, and share-worthy presentation drive packaging specifications and willingness to pay.
Institutional catering likewise seeks single-use formats to satisfy elevated hygiene benchmarks. Large hospital chains and school districts increasingly include compostability clauses in tenders, nudging suppliers toward moulded fibre or rPET with verified end-of-life pathways. Full-service restaurants, meanwhile, continue to broaden take-out menus, blending traditional plating with off-premise-friendly containers.
By Distribution Channel:
Indirect Sales Gain MomentumDirect sales held 56.20% of foodservice disposable packaging market share in 2025, reflecting long-standing supplier contracts with multinational chains. Custom tooling, joint R&D, and volume rebates anchor these relationships. Yet the indirect channel is growing at 6.60% CAGR as small and medium operators multiply. Distributors add value by curating compliant SKUs and offering just-in-time inventory, a critical service for ghost kitchens operating with limited storage. E-commerce portals extend this reach, allowing niche producers to showcase compostable innovations without building sales teams in every region.
While direct relationships grant insight into customer forecasts, they expose manufacturers to concentration risk. Indirect channels diversify customer bases but require investments in digital catalogues and training that teach operators correct end-of-life disposal, reinforcing brand reputation and regulatory compliance.
Geography Analysis
APAC Foodservice Disposable Packaging Market
Asia-Pacific dominated the foodservice disposable packaging market with 42.10% share in 2025. Robust quick-service expansion in India, Indonesia, and Vietnam, coupled with Beijing’s updated food-contact adhesive rule effective February 2025, ensures strong regulatory alignment toward safer materials. The region also hosts the bulk of global PLA capacity, establishing a cost advantage for biodegradable formats. Japan’s Positive List system entering force in June 2025 tightens resin compliance and spurs domestic fibre investment, while Hong Kong’s phased plastic tableware ban guides hospitality buyers toward compostable alternatives.
Europe and North America Foodservice Disposable Packaging Market
Europe remains an agenda-setter thanks to the Packaging and Packaging Waste Regulation that mandates full recyclability by 2030. Producers across the continent are accelerating fibre capacity, and extended producer responsibility schemes distance landfill from acceptable end-of-life routes. North America faces a patchwork of state-level PFAS bans; federal alignment arrived when the FDA completed the PFAS phase-out in February 2024. These overlapping rules complicate compliance but also create a market pull for barrier-coated paper bowls and rPET lids.
MEA Foodservice Disposable Packaging Market
The Middle East & Africa region is expected to post 6.95% CAGR through 2031 as infrastructure growth feeds demand for institutional catering disposables. Local champions like Hotpack are investing abroad to secure resin supply and technical know-how, then re-importing finished or semi-finished goods to service GCC contracts. Pilot recycling projects, such as SIG’s beverage-carton retrieval in Egypt, aim to build circular solutions even in nascent waste-management systems.
LATAM Foodservice Disposable Packaging Market
Latin America shows steady demand growth as disposable tableware accompanies retail meal kits and convenience-store food programs. Regional producers often adapt European fibre designs but utilise locally sourced sugar-cane bagasse, reflecting both cost and sustainability priorities.

Regulatory Landscape
Regulation for foodservice disposable packaging is tightening around chemicals of concern, recyclability performance, and producer accountability, which increases compliance complexity for global SKUs. In the European Union, the Packaging and Packaging Waste Regulation (PPWR), Regulation (EU) 2025/40, outlines packaging designed for recycling by 2030 and expands obligations related to labeling, conformity documentation, and extended producer responsibility (EPR) enrollment for economic operators placing packaging on the EU market.
A near-term compliance inflection point under PPWR is August 12, 2026, when information and conformity requirements apply more broadly, including EU declarations of conformity and technical documentation obligations for relevant packaging. PPWR also introduces PFAS limits for food-contact packaging from August 12, 2026 (including thresholds for individual PFAS, sums of targeted PFAS, and total fluorine). This reinforces the shift by foodservice packaging suppliers toward PFAS-free grease and moisture barriers, along with redesign of fiber and paper formats to support regulatory-fit end-of-life pathways.
Competitive Landscape
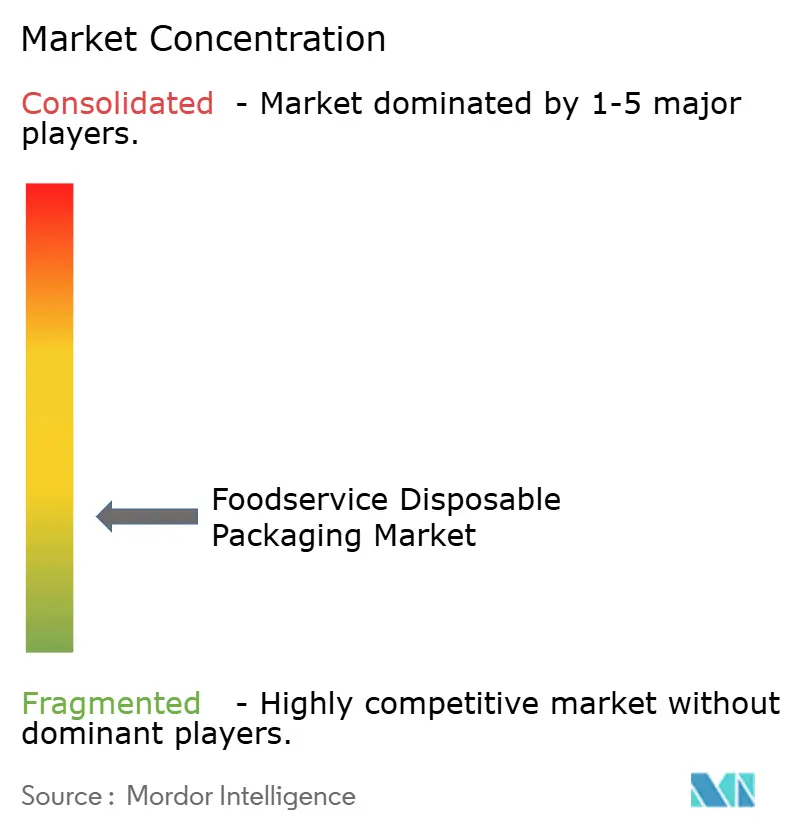
The foodservice disposable packaging industry exhibits fragmentation, with global leaders holding noticeable but not overwhelming shares across product lines. Strategic M&A is reshaping the field: Novolex’s USD 6.7 billion merger with Pactiv Evergreen in April 2025 created a portfolio exceeding 250 brands and 39,000 SKUs. Amcor’s planned USD 8.4 billion acquisition of Berry Global similarly illustrates a push toward scale in research, recycling infrastructure, and global distribution.
Technology differentiation remains a core battleground. Dart Container’s Dry Molded Fiber roll-out in partnership with PulPac promises 80% lower CO₂ and faster cycles, making it attractive for high-volume SKUs. Huhtamaki is augmenting fibre cup and lid capacity to meet European and Asian compliance timetables, while Braskem’s bio-circular PP gives converters a drop-in resin with lower emissions. Numerous regional firms concentrate on niche opportunities: Genpak’s PFAS-free fibre line satisfies municipal bans; BioPak’s PHA coatings support backyard composting; and SEE’s hybrid trays bridge meat-case performance with compostability.
Competitive intensity is further shaped by raw-material volatility. PLA prices fluctuated to USD 2,390 per metric ton in Q4 2024, prompting processors to hedge supplies or co-develop feedstock contracts with bio-refineries. Upward cost pressure incentivises process innovations that reduce gram weights, expand rapid-cycle moulding, or incorporate higher recycled content without performance penalties.
Foodservice Disposable Packaging Industry Leaders
Huhtamäki Oyj
Sealed Air Corporation
Amcor plc
Smurfit Westrock
Novolex Holdings, LLC
- *Disclaimer: Major Players sorted in no particular order
Foodservice Disposable Packaging Market Companies Covered in this Report
- Huhtamaki Oyj
- Amcor plc
- Graphic Packaging International, LLC
- Dart Container Corporation
- Smurfit Westrock
- Sabert Corporation
- Anchor Packaging LLC
- Genpak LLC
- Sealed Air Corporation
- Novolex Holdings, LLC
- Detpak (Eco Products)
- Vegware Ltd
- BioPak
- Hotpack Global
- Falcon Pack
- Pacific National Enterprises Pty Ltd
- Freshpack

Market Opportunities and Future Outlook
Compliance-driven material redesign creates whitespace for PFAS-free barrier systems and for paper and molded-fiber formats that can meet recyclability and food-contact requirements at scale. The EU PPWR (Regulation (EU) 2025/40) adds specific triggers, including August 12, 2026 information and conformity obligations and PFAS limits for food-contact packaging. As a result, foodservice operators and distributors will need to qualify new substrates, coatings, and inks that preserve grease resistance and heat performance without restricted chemistries.
Operationally integrated packaging solutions are another opportunity area, particularly where suppliers can bundle materials and equipment or provide validated packaging systems that reduce leakage, improve seal integrity, and support throughput in high-volume foodservice environments. Company activity already points to investment in these solution-led models, including Amcor advancing all-in-one packaging collaborations (with Metsa Group and G. Mondini) and deploying sealing technology through partnerships. Huhtamaki is also expanding fiber-based lid development with QSR partners to align beverage packaging with sustainability requirements and evolving compliance expectations.
Recent Industry Developments in Foodservice Disposable Packaging Market
- June 2026: Amcor plc announces installation of the first Moda rotary vacuum chamber sealing technology in Brazil via a strategic partnership with Barra Mansa Alimentos. The deployment marks direct packaging tech expansion in a key market. The initiative strengthens Amcor's fiber and packaging innovation footprint and local capacity in South America.
- May 2026: Huhtamaki Oyj enters a partnership with Hesburger to develop and launch customized fiber lids for hot and cold beverages in Alf, Germany. The collaboration expands fiber based lid offerings. It increases fiber based material adoption to meet regulatory and compliance needs.
- April 2026: Sealed Air Corporation completes acquisition by funds affiliated with CDR following regulatory approvals. The deal signals major industry consolidation affecting market dynamics. The consolidation creates a larger, diversified global player with broader capabilities and scale.


Foodservice Disposable Packaging Market Report Scope and Research Methodology
Market Definition and Coverage
This market covers single-use packs and service items used by foodservice operators to serve, carry, and deliver food and beverages. Values are measured at the point of sale across major regions.
Scope exclusions: Durable and reusable foodservice ware are not counted, and non-packaging back-of-house consumables are excluded from this market.
Segments Covered in This Report
- By Material Type
- Plastics
- Polypropylene (PP)
- Polyethylene Terephthalate (PET)
- Other Plastic Types
- Paper
- Coated paper
- Kraft paper
- Molded fiber
- Aluminum
- Biodegradable and Compostable
- Plastics
- By Product Type
- Cups and Lids
- Tubs and Containers
- Trays and Plates
- Cutlery, Stirrers and Straw
- Other Product Types (Bags, Wraps, Boxes, Cartons, Clamshell, etc.)
- By End User
- Quick Service Restaurants and Cafes
- Full-service Restaurants
- Cloud / Ghost Kitchens
- Institutional Catering (Hospitals, Schools)
- Other End User
- By Distribution Channel
- Direct Sales
- Indirect Sales
- By Geography
- North America
- United States
- Canada
- Mexico
- Europe
- Germany
- United Kingdom
- France
- Italy
- Spain
- Russia
- Rest of Europe
- Asia-Pacific
- China
- India
- Japan
- South Korea
- Australia and New Zealand
- Rest of Asia-Pacific
- Middle East and Africa
- Middle East
- United Arab Emirates
- Saudi Arabia
- Turkey
- Rest of Middle East
- Africa
- South Africa
- Nigeria
- Egypt
- Rest of Africa
- Middle East
- South America
- Brazil
- Argentina
- Rest of South America
- North America
Data Sources, Market Sizing, and Validation
Desk Research
Desk research starts by building the demand backdrop for away-from-home eating and delivery, then mapping which packaging formats are typically consumed per order. Public sources were used to anchor this context, such as national statistics on foodservice sales, CPI baskets for price movement, and customs trade data for paper, plastics, and aluminum flows.
We also referenced packaging and materials bodies and public science sources, including US EPA factsheets on waste and recycling, European Commission publications on packaging rules, UN Comtrade trade tables, and peer-reviewed articles on fiber, bioplastics, and barrier coatings. Company annual reports, investor decks, and reputed press helped us understand product mix shifts and capacity additions. For specific company financials, shipment signals, patents, and trade flows, approved paid databases were used where needed. The sources listed here are illustrative only, and many other references were reviewed to collect data, validate assumptions, and clarify open questions.
Primary Interviews and Surveys
Primary work focused on converting the desk view into a pricing and volume model tied to foodservice operations. We validated how orders split across dine-in, takeout, and delivery, and what that implies for container and accessory intensity. We spoke with a mix of packaging converters, distributors, material specialists, and foodservice operators across key consuming regions to close gaps on material substitution, regulation impact, and price pass-through before finalizing the model.
Distribution of primary research fieldwork respondents
| Company type | Respondent position | Region |
|---|---|---|
| Top tier: 39% | CXOs: 13% | APAC: 49% |
| Mid tier: 43% | Functional/Unit leaders: 35% | EMEA: 31% |
| Smaller Players: 18% | Managers: 52% | Americas: 20% |
Market-Sizing & Forecasting
Sizing starts with a top-down demand pool build where foodservice spending and order volumes are reconstructed by region and then translated into packaging consumption using typical items per order for beverages, prepared meals, and sides. Totals are corroborated through selective bottom-up checks, including sampled supplier revenue splits by foodservice formats, distributor channel checks, and ASP times volume sanity checks for high-volume items like cups, clamshells, and cutlery.
Key model inputs include away-from-home food sales growth, delivery and takeout mix, material substitution rates (plastic to fiber and compostables where rules tighten), average selling price movement by material, and lightweighting trends that reduce grams per unit over time. Where direct visibility is limited, gaps are handled by using proxy ratios from similar markets and then re-testing with expert feedback until the implied usage per order is realistic.
Forecasts are developed through scenario analysis supported by checks on inflation, regulation timelines, and operator packaging preferences, then converted into yearly market values with consistent currency timing and inflation handling.
Data Validation & Update Cycle
Model outputs are checked against independent signals like resin and paper price trends, trade flows for key inputs, and reported packaging volumes where available. Results are reviewed for outliers at the region and material level. When a variance is too wide, assumptions are revisited and experts are re-contacted to confirm what changed, for example a ban, a supply shock, or a large QSR format shift.
Before sign-off, results go through multiple analyst reviews to ensure calculations, units, and growth drivers align across the full time series. Reports are refreshed annually, and interim updates are made when material events materially shift pricing, regulation, or demand. Right before delivery, a final review pass is completed so published numbers reflect the latest available information.
Mordor Intelligence's Foodservice Disposable Packaging Market Size Compared Against Other Published Estimates
Published market values for foodservice disposable packaging can vary because sources do not always count the same set of items, they use different pricing ladders, and they refresh assumptions at different points in time. Currency timing, and whether serviceware is bundled with packaging, also tends to shift the final value.
Chemicals, tabletop items, and other non-packaging foodservice supplies sit outside Mordor Intelligence's scope, which is a common reason some broader "disposables" totals appear higher or lower depending on what else was included. Another gap comes from how quickly fiber and compostables are assumed to replace conventional plastics, and whether prices are modeled from material cost movement or from a flat ASP uplift that is not re-tested with channel feedback.
Benchmark comparison
| Source | Market Size | Gaps in Research Methodology |
|---|---|---|
| Mordor Intelligence | USD 74.93 B (2025) | |
| Global Consultancy A | USD 80.00 B (2024) | Uses a combined packaging plus serviceware definition and reports a 2024 value, which can pull in adjacent single use items and shift the base year level versus a packaging-only build. |
| Industry Dataset B | USD 39.00 B (2023) | Appears to reflect a narrower shipment or spend slice and may capture only select operator or regional coverage, which can understate global value when materials and channels are not fully represented. |
The spread across sources is mostly explained by what is included in "disposables," the year being quoted, and how price progression is handled across materials. By tying inputs to foodservice order activity, pack intensity, and realistic ASP movement checks, the resulting total stays traceable to clear drivers and can be repeated when assumptions change.


Key Questions Answered in the Report
What is the current value of the foodservice disposable packaging market?
The foodservice disposable packaging market size is USD 78.98 billion in 2026.
How fast is the foodservice disposable packaging market expected to grow?
The market is projected to register a 5.41% CAGR, reaching USD 102.79 billion by 2031.
Which region leads global demand?
Asia-Pacific commands 42.10% of 2025 revenue thanks to rapid urbanisation, QSR expansion, and strong local manufacturing.
Which material segment is growing the quickest?
Biodegradable and compostable packaging is forecast to expand at a 8.88% CAGR, driven by regulatory mandates and consumer preference.
What impact do PFAS bans have on suppliers?
National and municipal PFAS bans obligate companies to retire non-compliant inventory and invest in alternative barriers, trimming the sector’s CAGR by an estimated 0.6%.
Why are ghost kitchens important for packaging vendors?
Ghost kitchens rely entirely on delivery, making packaging the primary brand interface; this segment is projected to grow at 8.74% CAGR through 2031, spurring demand for tamper-evident, thermally robust solutions.
Page last updated on:


 Your data is secure and never sold or shared.


