Food Truck Market Size and Share
Market Overview
| Study Period | 2019 - 2031 |
|---|---|
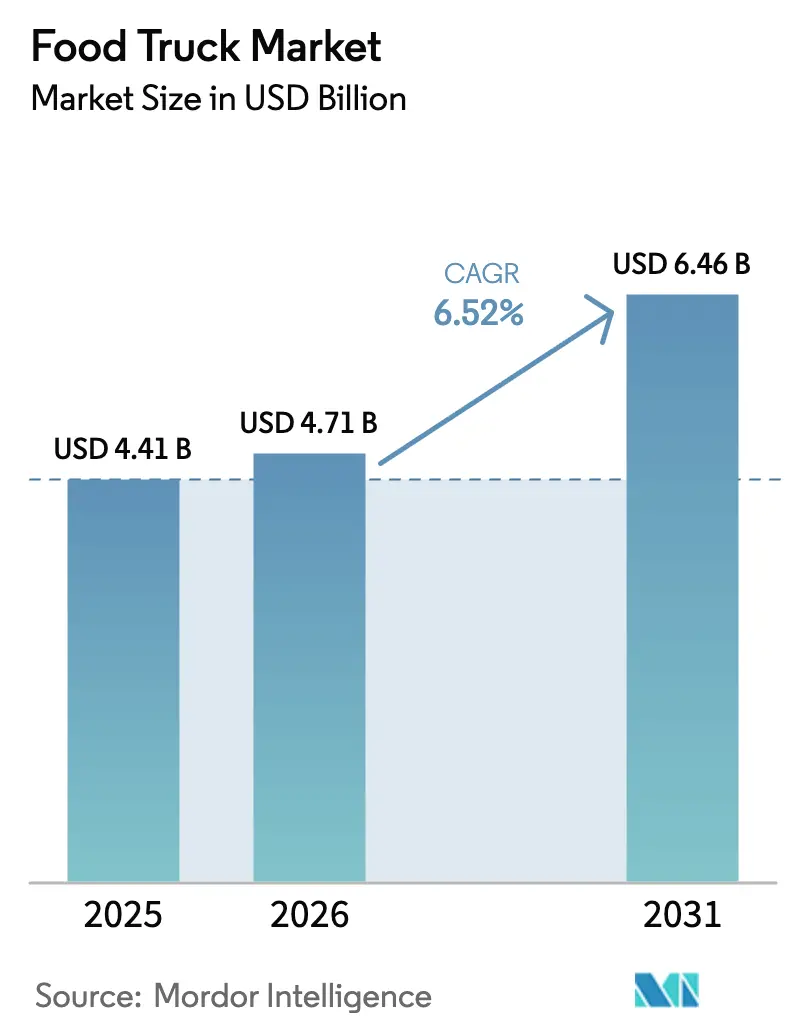
| Market Size (2026) | USD 4.71 Billion |
| Market Size (2031) | USD 6.46 Billion |
| Growth Rate (2026 - 2031) | 6.52% CAGR |
| Fastest Growing Market | Asia Pacific |
| Largest Market | North America |
| Market Concentration | Low |
Major Players *Disclaimer: Major Players sorted in no particular order Image © Mordor Intelligence. Reuse requires attribution under CC BY 4.0. | |
Food Truck Market Analysis by Mordor Intelligence
The food truck market size is expected to grow from USD 4.41 billion in 2025 to USD 4.71 billion in 2026 and is forecast to reach USD 6.46 billion by 2031, reflecting a 6.52% CAGR during the forecast period (2026-2031). Demand momentum is anchored in consumers’ shift toward convenient, lower-priced prepared meals, with mobile vendors capturing traffic from brick-and-mortar quick-service outlets and third-party delivery providers. Regulatory incentives that favor low-overhead retail, growth in urban events, and social-media-driven discovery reinforce the channel’s appeal. Simultaneously, the rising interest in electric vehicles is reshaping fleet investments as operators seek to comply with increasingly stringent emission regulations. Competitive intensity remains high because thousands of independents and emerging franchise chains coexist, yet the opportunity to scale through turnkey systems and semi-permanent pods continues to widen.
Key Report Takeaways
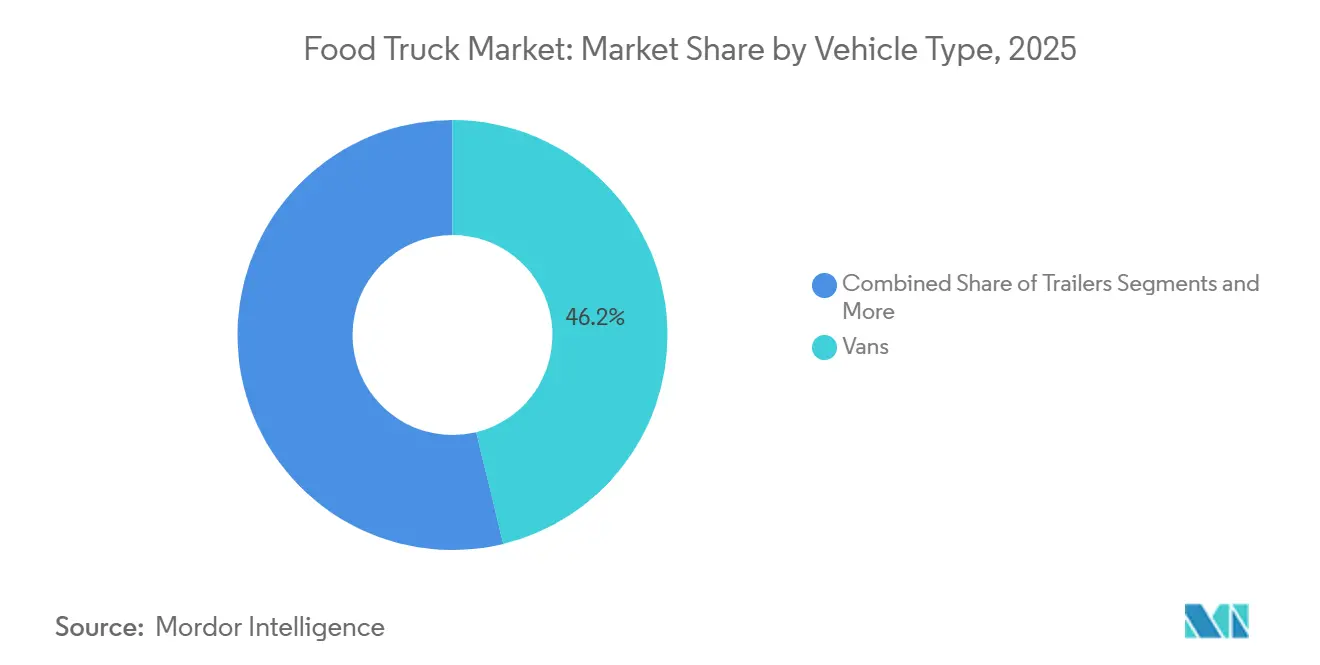
- By vehicle type, vans led the food truck market with 46.20% of the market share in 2025; trucks are projected to expand at a 19.05% CAGR through 2031.
- By length, the 14 to 22-ft segment accounted for a 53.75% share of the food truck market size in 2025, while vehicles over 22 ft are poised for a 10.45% CAGR through 2031.
- By cuisine, fast food retained 48.30% of the food truck market share in 2025; plant-based concepts are projected to grow at a 15.40% CAGR through 2031.
- By ownership model, independent operators held 62.10% of the food truck market share in 2025; franchise chains recorded the fastest growth at 12.15% CAGR through 2031.
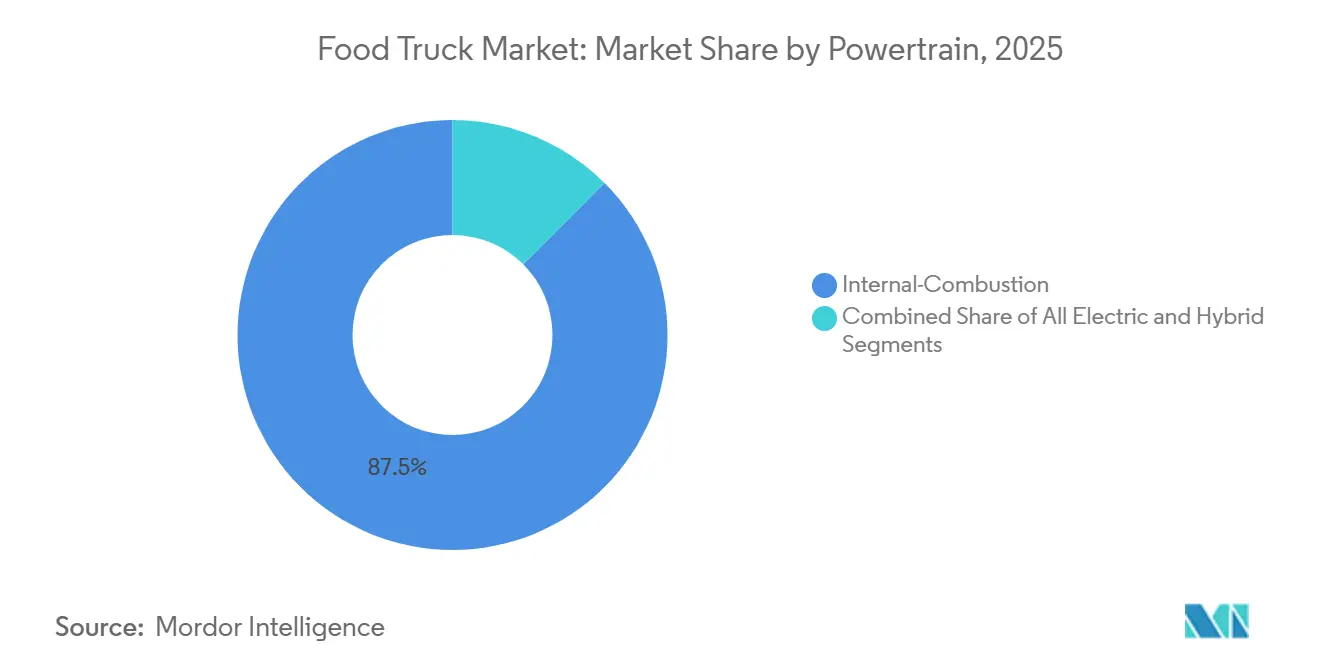
- By powertrain, internal-combustion units represented 87.50% of 2025 sales in the food truck market; yet, all-electric alternatives are the fastest-growing, with a 19.05% CAGR through 2031.
- By service model, roaming/event operations accounted for 60.90% of the food truck market share in 2025; semi-permanent pods are advancing at an 8.75% CAGR through 2031.
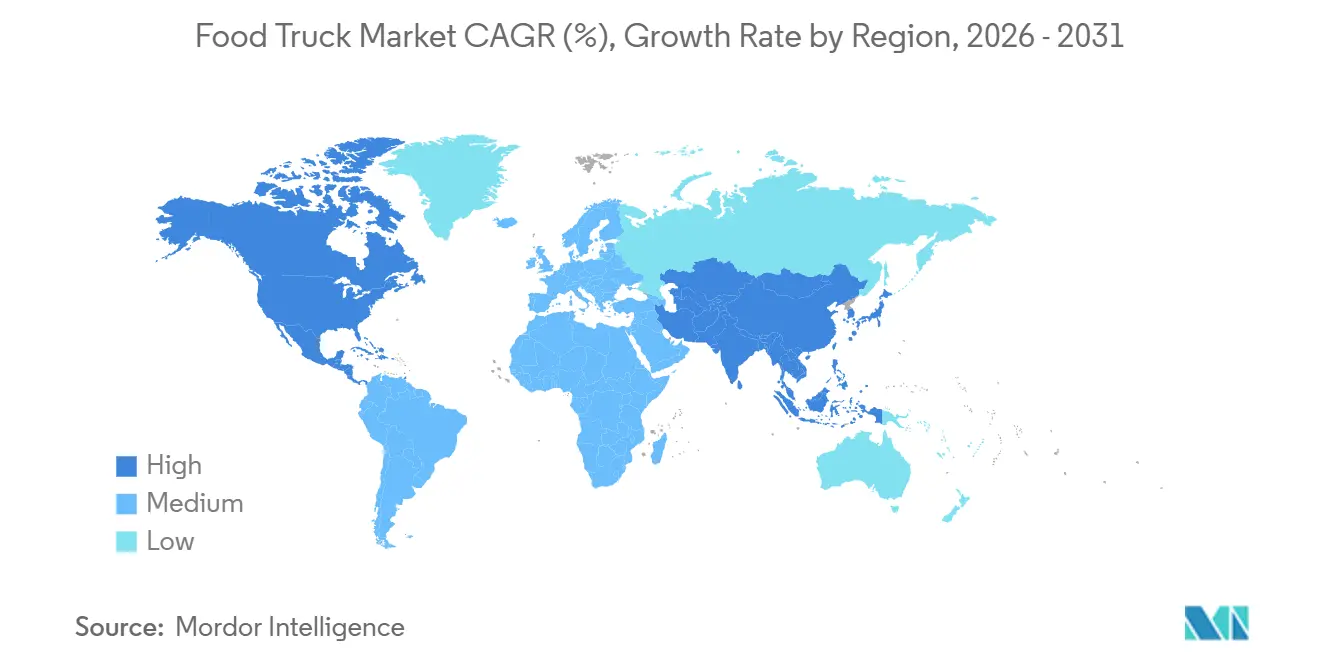
- By geography, North America led with 40.80% of the food truck market share in 2025, while Asia-Pacific is the fastest-growing region, with a 10.50% CAGR through 2031.
Note: Market size and forecast figures in this report are generated using Mordor Intelligence’s proprietary estimation framework, updated with the latest available data and insights as of January 2026.
Global Food Truck Market Trends and Insights
Drivers Impact Analysis*
| Driver | (~) % Impact on CAGR Forecast | Geographic Relevance | Impact Timeline |
|---|---|---|---|
| Electric Food Trucks Cut OPEX | +1.4% | Europe, North America coastal metros, Asia-Pacific pilots | Long term (≥ 4 years) |
| Low-CAPEX Franchising Preference | +1.1% | North America and Europe, emerging in Asia-Pacific | Medium term (2-4 years) |
| Social Media Fuels Impulse Buying | +0.9% | Global, led by North America and urban Asia-Pacific | Short term (≤ 2 years) |
| Fast-Food and Street-Food Growth | +0.8% | Global, highest in Asia-Pacific and North America | Long term (≥ 4 years) |
| Gourmet Menu Differentiation | +0.7% | North America and Europe | Medium term (2-4 years) |
| Shared Commissaries Speed Permitting | +0.6% | North America, selective European cities | Medium term (2-4 years) |
| Source: Mordor Intelligence | |||


Adoption of Zero-Emission / Electric Food Trucks Cuts OPEX
Battery-electric fleets are gaining traction, driven by a combination of regulations and fuel economics. The EU Clean Vehicles Directive mandates that only zero-emission light-duty vehicles will qualify for public procurement. The National Renewable Energy Laboratory highlights that electric heavy-duty platforms, when considering charging schedules and duty cycles, can provide a lower total cost of ownership compared to diesel alternatives. Pilots in Montgomery County, Maryland, using Joule Case systems, report extended generator-free operation and significant fuel savings. In both London and California, increasing emission penalties quickly offset any initial cost advantages of internal-combustion engines. As municipalities continue to install charging stations in event spaces, the food truck market is expected to adopt electric drivetrains at a faster pace than previously anticipated.
Growing Preference for Low-CAPEX Franchising Models
Franchise systems are making headway by easing entry barriers. Kona Ice, leveraging a bundled equipment and support package, has expanded significantly nationwide. King of Pops offers a low franchise fee, along with proprietary recipes and supplier networks, which substantially reduces the time to launch. Carvel outlines a startup range in its Franchise Disclosure Document that is notably lower than traditional brick-and-mortar costs, and its central commissaries help operators manage fluctuations in ingredient prices. Rising labor and food costs have driven independent owners to seek economies of scale through franchising. These insights highlight the growing adoption of turnkey models in the food truck sector.
Social-Media-Driven Location Discovery and Impulse Buying
Platforms like Instagram and TikTok have become essential tools for vendors, allowing them to share real-time locations, manage pre-orders, and showcase trending menu items with minimal marketing effort. Many diners rely heavily on word-of-mouth recommendations and online reviews when deciding where to eat. Aggregators such as Truckster and Roaming Hunger provide searchable schedules, while platforms like Popmenu and Otter integrate menus with social media feeds, streamlining operations and increasing order volumes. Popular food items such as bao buns, tacos, and dumplings have gained significant traction, driven by shareable visuals and location tagging. This combination of viral content and location discovery transforms casual interest into foot traffic, driving consistent sales growth for mobile vendors.
Rising Consumption of Fast-Food and Street-Food Culture
Fast food has become a staple in daily diets. A significant portion of adults regularly consume fast food, which notably contributes to their caloric intake[1]Centers for Disease Control and Prevention, “Fast Food Consumption Among Adults,” cdc.gov. In various developing economies, urban households allocate a considerable share of their food budgets to street vendors, highlighting a strong demand. In Asia, food expenditure is expected to grow substantially, enhancing the appeal of mobile food concepts. While limited-service restaurants generate significant sales in North America, mobile vendors benefit from avoiding fixed rents and maintaining lower overheads[2]National Restaurant Association, “2025 Restaurant Industry Factbook,” restaurant.org. These insights underscore the enduring growth potential of the food truck market, driven by a combination of convenience and the cultural appeal of street food.
Restraints Impact Analysis*
| Restraint | (~) % Impact on CAGR Forecast | Geographic Relevance | Impact Timeline |
|---|---|---|---|
| Delivery Platform Competition | -0.9% | Global, most acute in North America and urban Europe | Short term (≤ 2 years) |
| Used Truck Price Spike | -0.7% | Global, highest in North America and Europe | Short term (≤ 2 years) |
| Food-Safety Compliance | -0.6% | North America, Europe, emerging in Asia-Pacific | Medium term (2-4 years) |
| Inspector Shortage | -0.4% | North America, United Kingdom, select EU states | Medium term (2-4 years) |
| Source: Mordor Intelligence | |||
Competition from Third-Party Online Delivery Platforms
In the United States, aggregators such as DoorDash and Uber Eats dominate the delivery landscape, accounting for a significant share of sales. These platforms have transformed the way consumers access food, bringing app-based convenience to the forefront, a service once exclusive to street vendors. Operators, grappling with high commission rates, find their already-narrow profit margins further squeezed. Yet, as off-premises demand surges, so does their reliance on the expansive reach of these platforms. Delivery apps have increased their advertising expenditure, straining the customer acquisition budgets of food trucks. The challenge deepens as platform algorithms prioritize proprietary virtual brands, sidelining listed vendors and amplifying headwinds for the food truck sector.
Stringent Food-Safety Regulations and Multi-Agency Compliance
Operators must navigate overlapping federal, state, and local rules, each carrying distinct inspection and permitting requirements. The U.S. Food and Drug Administration had approximately 90 investigator vacancies in 2024, resulting in missed inspection targets and uneven enforcement across jurisdictions[3]U.S. Government Accountability Office, “FDA Food Safety Oversight,” gao.gov. Seattle issued multiple enforcement actions for unpermitted trucks in 2024, demonstrating the city's vigilance amid staffing shortages. Brazil’s new RDC 843/2024 exempts direct-sale foods from federal approval, yet local departments still require separate licenses, underscoring the layered compliance burden. The administrative complexity adds cost and delays that disproportionately affect single-unit operators, limiting fleet expansion within the food truck market.
*Our forecasts treat driver/restraint impacts as directional, not additive. The impact forecasts reflect baseline growth, mix effects, and variable interactions.
Segment Analysis
By Vehicle Type: Vans Dominate, Electric Variants Surge
Vans accounted for 46.20% of the food truck market share in 2025, confirming their suitability for dense urban routes and easier parking regulations. Larger food truck market size prospects now lie in electric vans, forecasted to grow at a 12.25% CAGR through 2031, as public-sector procurement limits favor zero-emission light-duty vehicles. Operators appreciate the balance of galley capacity and maneuverability in vans, while trailers are more suitable for festival routes that permit the on-site detachment of prime movers. Full-size trucks offer ample space for complex kitchens, but they also incur higher fuel and parking costs. Carts and tuk-tuks fill coffee, dessert, and single-item niches at substantially lower capital outlays.
NREL’s T3CO modeling tool helps owners optimize battery sizing and charging windows, supporting adoption decisions. In Maryland field trials, Joule Case-equipped vans logged full-service days without generators, resulting in a 60-70% reduction in fuel consumption. Such evidence suggests a tipping point at which electric vans will begin to shift market share away from diesel platforms in the food truck market.


By Length: Mid-Size Sweet Spot Encourages Functional Versatility
Units between 14 and 22 feet captured 53.75% of the food truck market share in 2025, reflecting municipal length caps that favor standard parking bay compatibility. The 22-plus-foot cohort, projected to grow at a 10.45% CAGR through 2031, targets corporate campuses and multi-day festivals where throughput demands larger production lines.
Mid-size units benefit from ordinances such as Pasco, Washington’s 2024 rule, which designates dedicated food-truck parks, allowing year-round trade without the need for repeated applications. Bozeman, Montana’s program, priced at USD 800-1,050 per month, confirms that utilities-inclusive pads can improve daily economics and shorten breakeven timelines.
By Cuisine/Menu: Plant-Based Concepts Outpace Traditional Fast Food
Fast-food menus accounted for 48.30% of the food truck market share in 2025; however, growth momentum is shifting toward vegan and plant-based formats, projected to grow at a 15.40% CAGR through 2031. Demand is underpinned by Generation Z and Millennials who prefer sustainable proteins and global flavors. Urban diversity drives the popularity of ethnic and fusion offerings. The demand for instant noodles continues to grow, reflecting a preference for familiar staples in convenient formats.
Conagra's analysis of street-ready items highlights a significant rise in bao buns, showcasing how viral dishes can boost average checks. Dessert and bakery trucks thrive on impulse purchases at events, often achieving premium pricing. As traditional fast-food experiences slight declines, food trucks with distinctive menus gain a competitive edge.
By Ownership Model: Franchises Scale, Independents Persist
Independent owners represented 62.10% of the food truck market share in 2025, benefiting from menu agility and low licensing fees. Yet, franchise chains are forecasted to grow at a 12.15% CAGR through 2031 because turnkey playbooks de-risk entry and compress launch timelines. Kona Ice illustrates scalability by combining route optimization with centralized procurement, while King of Pops leverages brand equity to negotiate bulk ingredient prices.
Institutional fleets at hospitals and universities, though small in count, provide dependable weekday volumes and can pre-book months of service. Rising labor and food inflation since 2019 have eroded single-unit margins, nudging owners to adopt group purchasing or join franchise networks to stay competitive within the broader food truck market.
By Powertrain: Electric Units Gain Despite ICE Dominance
Internal-combustion powertrains comprised 87.50% of the food truck market share in 2025, yet all-electric units are projected to grow at a 19.05% CAGR through 2031. The EU procurement mandate accelerates transition by limiting public contracts to zero-emission vehicles. NREL cost-of-ownership modeling indicates payback within four years under urban duty cycles, a scenario increasingly attractive as diesel surcharges rise in low-emission zones.
Hybrid systems offer an interim step, pairing combustion range with battery-powered equipment to lower idling costs by up to 30%. Battery premiums remain 30-50% higher than diesel chassis, but federal tax credits and city grants shorten amortization periods, positioning electrification as a strategic choice in the food truck market.
By Service Model: Semi-Permanent Pods Formalize Street Vending
Roaming deployments accounted for 60.90% of the food truck market share in 2025, reflecting high-margin opportunities in festival and corporate catering. Semi-permanent pods, although smaller today, are projected to grow at an 8.75% CAGR through 2031, as municipalities convert underutilized lots into vendor parks equipped with water, power, and waste services. Garland, Texas, charges USD 25 per day for hookup access, while San Francisco’s Presidio Trust commands USD 37.50-250 for pre-permitted spaces with marketing support.
Pods reduce set-up labor, improve sanitation compliance, and help operators build routine clientele. Roaming trucks, however, retain the flexibility to chase large-ticket events where a single weekend can equal a week of pod sales. The resulting hybrid approach—weekday pods, weekend events—reflects a maturing operational model for the food truck market.
Geography Analysis
North America accounted for 40.80% of the food truck market share in 2025; the United States accounted for the majority of regional revenue, owing to city-level reforms that replaced lottery-based street-vending caps with merit-based licensing. Secondary metropolitan areas, such as Charlotte, Cincinnati, and Calgary, are offering commissary grants to promote culinary entrepreneurship, expanding their geographical reach beyond traditional hubs like Los Angeles and New York. Canada’s multicultural urban centers continue to embrace diverse cuisine options, while its colder climate creates seasonal revenue peaks from May to September.
The Asia-Pacific region is the fastest-growing region, with a 10.50% CAGR through 2031, as urban population growth meets an ingrained street-food heritage. China’s pilot “mobile snack streets” legalize previously informal vendors, pairing the ubiquity of QR-code payments with modern hygiene oversight. India’s Smart City Mission funds modular vending zones outfitted with shared waste, water, and electricity, elevating baseline operating standards. Indonesia, Thailand, and Vietnam display similar momentum, buoyed by tourism rebounds and middle-class dietary experimentation. Fragmented regulations remain a hurdle; however, lower labor expenses and domestic chassis manufacturing help temper start-up costs.
Europe's sustainability mandates are reshaping its landscape. The EU's Clean Vehicles Directive requires member states to adopt zero-emission procurement quotas, steering operators towards battery-electric fleets. Portugal has simplified vendor notification processes, allowing entrepreneurs to register online for free. Meanwhile, the United Kingdom is experiencing permit delays due to a decline in staffing in environmental health.
In South America, Brazil and Argentina are introducing new federal regulations to formalize street vending. These rules aim to streamline import procedures and reduce redundant inspections, signaling the region's potential as a burgeoning growth corridor. While the Middle East and Africa are still in their infancy, they are drawing attention, particularly around tourism hotspots such as Dubai and Johannesburg.
Mordor Intelligence provides coverage of the food truck market across other key regional markets. Detailed country-level analysis extends to United States incorporating local coverage and market participation, as required.

Competitive Landscape
No single player dominates this fragmented sector, as operators collectively hold a limited market share. This low concentration is primarily due to manageable startup costs and limited economies of scale in mobile cooking. Franchise networks, such as Kona Ice and King of Pops, utilize their brand strength, route analytics, and bulk procurement to ascend the ranks. Meanwhile, independent operators maintain agility, swiftly pivoting their menus and adapting to the changing dynamics of their neighborhoods. Technology platforms like Truckster are easing the discovery process, while Popmenu is enhancing the experience with social shopping features that encourage pre-ordering.
Understanding regulations has become a significant advantage. Operators with in-house compliance teams can swiftly secure multi-city permits, a feat that often eludes newcomers due to a shortage of inspectors. The FDA's staffing deficiencies result in inconsistent enforcement, unintentionally allowing unlicensed vendors to undercut authorized trucks and skew competition in specific markets. As emission zones mandate a shift to electric fleets, capital requirements are escalating. This trend favors financially robust operators who can absorb battery premiums or tap into municipal grants. Concurrently, ghost kitchen initiatives backed by delivery platforms are competing with virtual brands for a share of the quick-serve market.
Franchisors have made strategic moves by acquiring shared commissaries, aiming to stabilize input costs and expand their regional presence. Independents, seeking similar advantages without relinquishing ownership, banded together to form cooperatives to negotiate better terms on ingredients and insurance. As the industry moves towards electrification and the rise of pods, the key to standing out will be rooted in route analytics, digital engagement, and menu creativity, rather than just the number of trucks on the road, ensuring the competitive landscape remains dynamic.
Food Truck Industry Leaders
Prestige Food Trucks
M&R SPECIALTY TRAILERS AND TRUCKS
VS Veicoli Speciali
Food Truck Company BV
Cruising Kitchens, LLC
- *Disclaimer: Major Players sorted in no particular order


Recent Industry Developments
- April 2025: LSG Sky Chefs Americas announced a USD 60 million investment in 230 state-of-the-art catering trucks, bolstering its operational capabilities. These advanced trucks come fitted with intelligent cameras and anti-collision systems.
- March 2025: Cousins Maine Lobster (CML) launched its second food truck in Upstate New York to meet rising demand for premium seafood. This move underscores CML's dedication to making its renowned Maine lobster dishes more accessible and convenient for local seafood aficionados.


Research Methodology Framework and Report Scope
Market Definitions and Key Coverage
Our study defines the food truck market as all newly built, self-propelled or trailer-mounted vehicles that store, cook, and sell food or beverages directly to consumers in public and private venues. The unit must contain on-board preparation or finishing equipment and operate under a mobile foodservice license; pre-packaged vending carts or pop-up kiosks are excluded.
Scope exclusion: refitted buses used solely as static kitchens, festival-only container stalls, and ghost-kitchen delivery vans sit outside this analysis.
Segmentation Overview
- By Vehicle Type
- Vans
- Trailers
- Trucks
- Carts and Tuk-tuks
- By Length
- Up to 14 ft
- 14 to 22 ft
- Above 22 ft
- By Cuisine/Menu
- Fast Food
- Vegan/Plant-based
- Bakery and Desserts
- Ethnic/Fusion
- Beverage-only
- By Ownership Model
- Independent Operators
- Franchise Chains
- Corporate / Institutional Fleets
- By Powertrain
- Internal-Combustion
- All-Electric
- Hybrid
- By Service Model
- Roaming/Event-based
- Semi-Permanent Pods and Parks
- By Geography
- North America
- United States
- Canada
- Rest of North America
- South America
- Brazil
- Argentina
- Rest of South America
- Europe
- Germany
- United Kingdom
- France
- Italy
- Spain
- Russia
- Rest of Europe
- Asia-Pacific
- China
- India
- Japan
- South Korea
- Australia and New Zealand
- Rest of Asia-Pacific
- Middle East and Africa
- United Arab Emirates
- Saudi Arabia
- Turkey
- South Africa
- Rest of Middle East and Africa
- North America
Detailed Research Methodology and Data Validation
Primary Research
We reinforced secondary findings through discussions with truck builders, franchisors, municipal inspectors, and operator associations across North America, Europe, and Asia Pacific. Interviews and short surveys revealed realistic average selling prices, licensing hurdles, daily ticket volumes, and menu margin structures that sharpened model assumptions.
Desk Research
Our desk work began with government motor-vehicle registries, city permit databases, and customs codes that track exports of purpose-built food service vehicles. Trade bodies such as the National Food Truck Association, the European Mobile Catering Federation, and the Asia Street Food Council supplied counts of active trucks, annual closures, and regulatory updates. Analysts added insight from open financial filings, event attendance records, and tier-one media coverage to size demand drivers like urban festival growth and consumer spend on away-from-home meals. Subscription intelligence from D&B Hoovers for manufacturer revenues and Dow Jones Factiva for deal flow allowed us to benchmark producer capacity and investment trends. Patent traces from Questel confirmed technology adoption in electric drivetrains and compact kitchen layouts. This list is illustrative; many additional public and paid sources were mined to validate and clarify data points.
Market-Sizing & Forecasting
Mordor analysts built a top-down model beginning with registered food-service vehicles, adjusted for active-duty ratios, average annual sales per truck, and cuisine-specific ticket sizes, which are then cross-checked through bottom-up snapshots of manufacturer shipments and sampled ASP × volume data. Key variables like new license issuances, urban foot-traffic indices, ingredient cost inflation, festival calendar expansion, and adoption of electric powertrains feed a multivariate regression and ARIMA hybrid to forecast revenue through 2030. Gap areas in supplier roll-ups were bridged using operator density proxies and normalized revenue-per-square-foot benchmarks.
Data Validation & Update Cycle
Outputs pass variance checks against independent indicators such as point-of-sale turnover surveys and insurance policy counts. Senior reviewers flag anomalies before sign-off. The model refreshes annually, with mid-cycle updates when material regulations or macro shocks surface, ensuring clients receive our latest view.
Why Mordor's Food Truck Baseline Inspires Confidence
Published estimates often diverge because firms choose different truck definitions, pricing ladders, and refresh schedules. We address those pitfalls up front by aligning scope with licensing statutes and by updating figures every twelve months.
Key gap drivers include whether refurbished step-vans are counted, how aggressively menu price inflation is rolled forward, and if partial-year operator shutdowns are discounted. Our disciplined variable set and rapid refresh cadence reduce these distortions for decision-makers.
Benchmark comparison
| Market Size | Anonymized source | Primary gap driver |
|---|---|---|
| USD 4.42 B (2025) | Mordor Intelligence | - |
| USD 5.42 B (2024) | Global Consultancy A | Includes semi-permanent food pods and uses list prices without operator downtime adjustment |
| USD 4.40 B (2023) | Industry Association B | Excludes electric trailers and applies static currency rates |
| USD 4.52 B (2024) | Regional Consultancy C | Relies on voluntary operator surveys with limited Asia Pacific coverage |
The comparison shows that while totals vary, Mordor's numbers sit within the observed band yet rest on transparent variables, cross-checks, and timely updates that together deliver a balanced, defensible baseline.


Key Questions Answered in the Report
How large is the food truck market in 2026?
The food truck market is valued at USD 4.71 billion in 2026 and is anticipated to grow at a CAGR of 6.52% to reach USD 6.46 billion by 2031.
Which region expands fastest through 2031?
Asia-Pacific posts the highest CAGR of 10.50%, supported by urbanization, rising incomes, and entrenched street-food culture.
Why are franchise food trucks gaining share?
Turnkey systems, lower startup risk, and bulk procurement allow franchise operators to expand at 12.15% CAGR while independents face cost pressures.
What is the main regulatory hurdle for new entrants?
Navigating multi-agency food-safety inspections remains the most time-consuming hurdle, especially where inspector staffing is constrained.
How quickly will electric powertrains grow?
All-electric food trucks are projected to register a 19.05% CAGR between 2026 and 2031 as emission mandates tighten.
Page last updated on:


