
Market Overview
| Study Period | 2021 - 2031 |
|---|---|
| Market Size (2026) | USD 87.44 Billion |
| Market Size (2031) | USD 109.02 Billion |
| Growth Rate (2026 - 2031) | 4.51 % |
| Fastest Growing Market | Middle East and Africa |
| Largest Market | Asia Pacific |
| Market Concentration | Medium |
Major Players *Disclaimer: Major Players sorted in no particular order Image © Mordor Intelligence. Reuse requires attribution under CC BY 4.0. | |
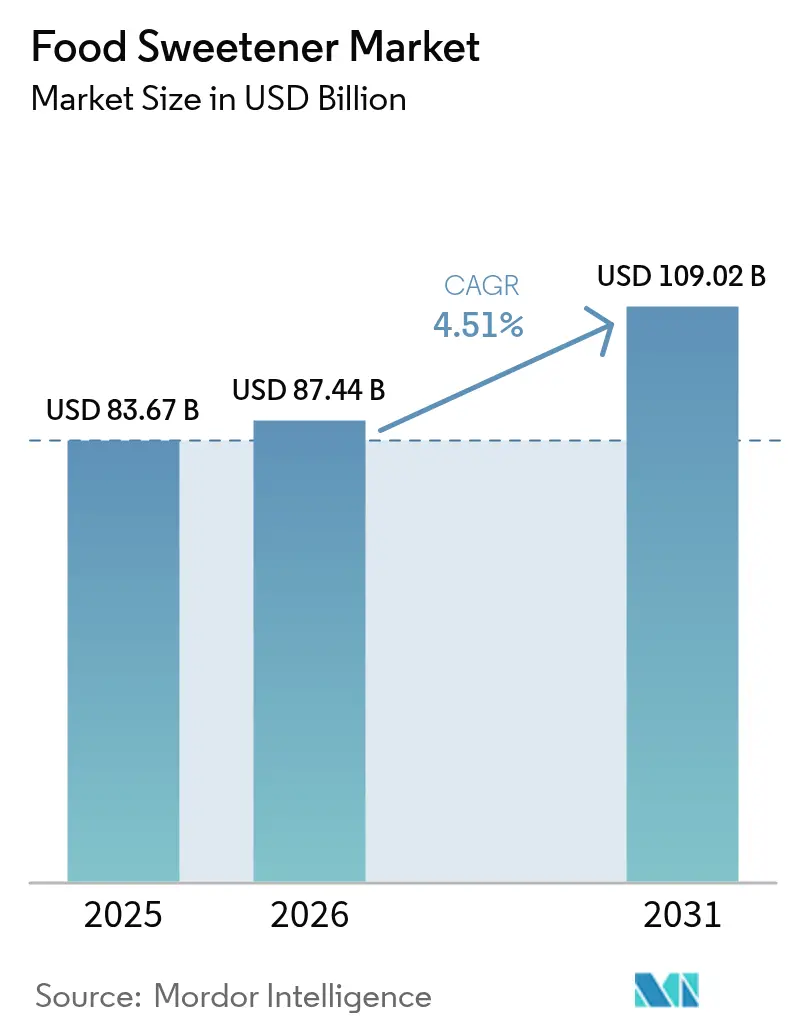
Food Sweetener Market Analysis by Mordor Intelligence
The food sweetener market size is expected to grow from USD 83.67 billion in 2025 to USD 87.44 billion in 2026 and is forecast to reach USD 109.02 billion by 2031 at 4.51% CAGR over 2026-2031. This growth is fueled by sugar-reduction policies implemented in 115 countries, heightened health consciousness among consumers, and continuous advancements in ingredient innovation that enable calorie reduction without compromising taste. While Asia-Pacific spearheads demand due to its large population and increasing adoption of healthier lifestyles, the Middle East and Africa is witnessing the swiftest growth, driven by rapid urbanization, rising disposable incomes, and evolving dietary habits. In light of recent U.S. trade actions on Chinese erythritol, ingredient suppliers are expanding precision-fermentation capacities to meet demand, and manufacturers are diversifying their supply chains to mitigate risks. Mergers and acquisitions, such as Tate & Lyle’s acquisition of CP Kelco in 2024, highlight the market's trend towards vertical integration and the development of value-added solutions to cater to evolving consumer preferences.
Key Report Takeaways
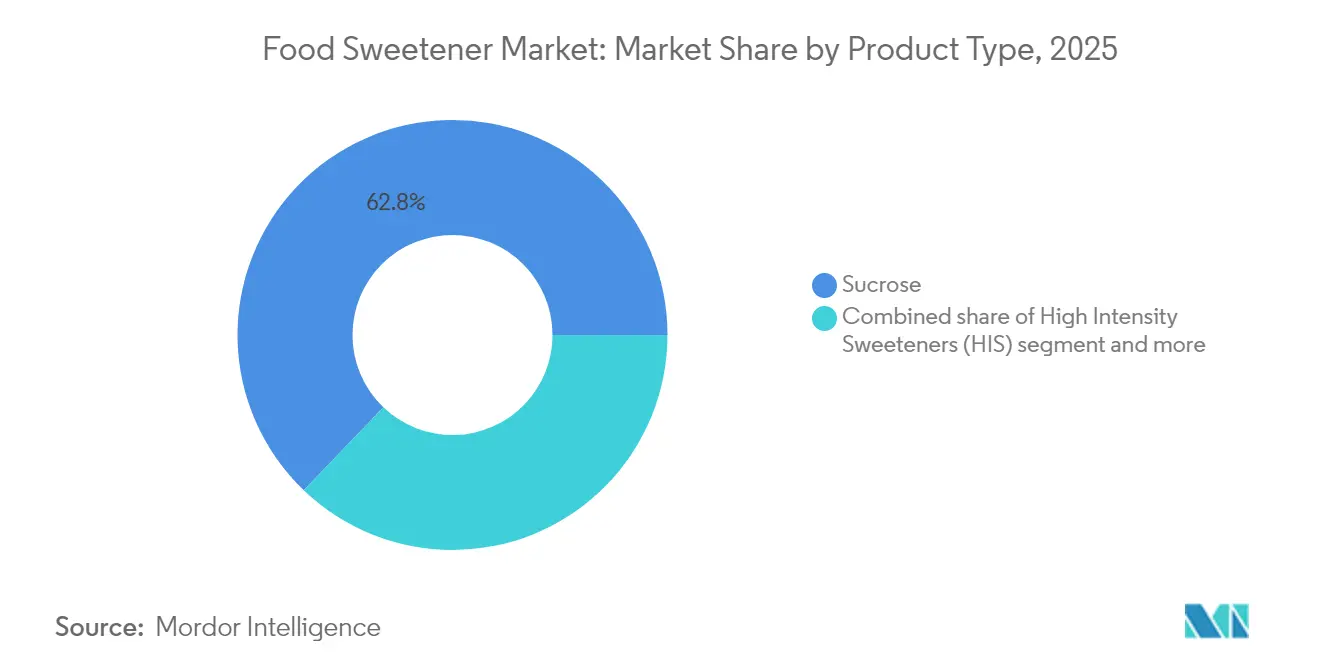
- By product type, sucrose held 62.84% of the food sweetener market share in 2025, while high-intensity sweeteners are projected to post a 6.52% CAGR through 2031.
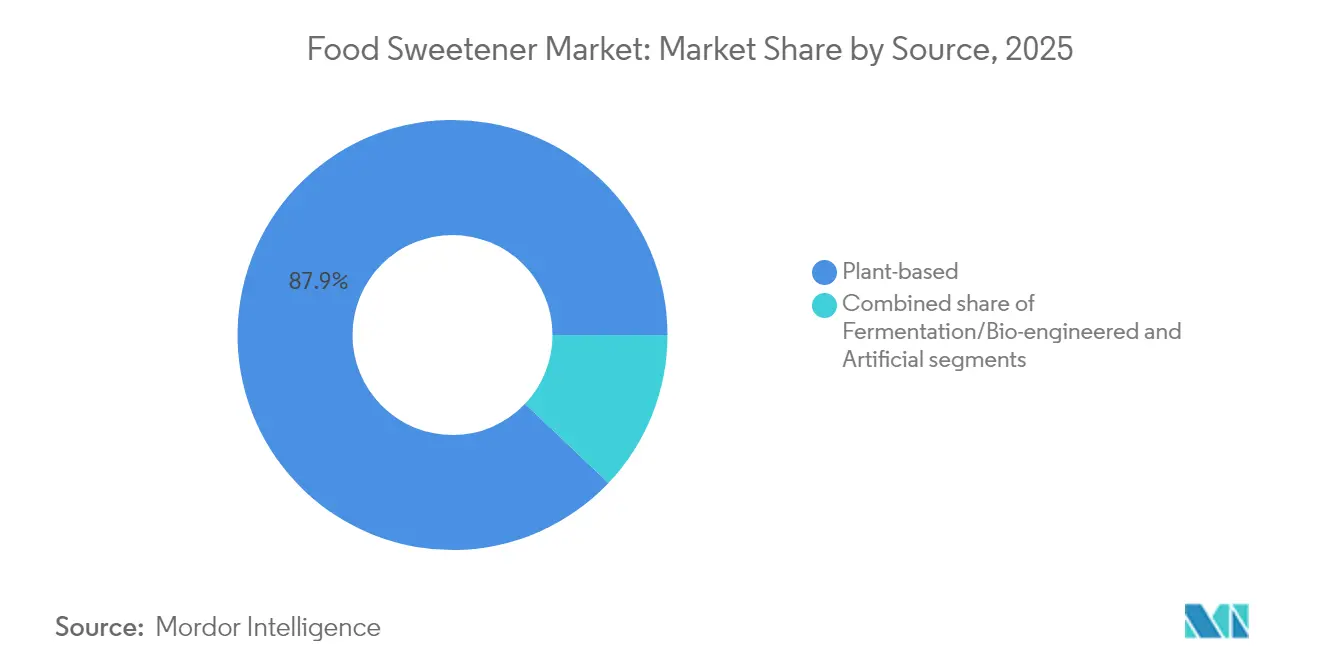
- By source, plant-based ingredients commanded 87.92% revenue in 2025; fermentation-derived sweeteners are set to rise at 6.79% CAGR to 2031.
- By form, solid formats led with 61.68% revenue share in 2025, whereas liquids and syrups are on track for 6.9% CAGR.
- By application, food accounted for 55.92% of the food sweetener market size in 2025, while beverages are expected to expand at a 5.93% CAGR.
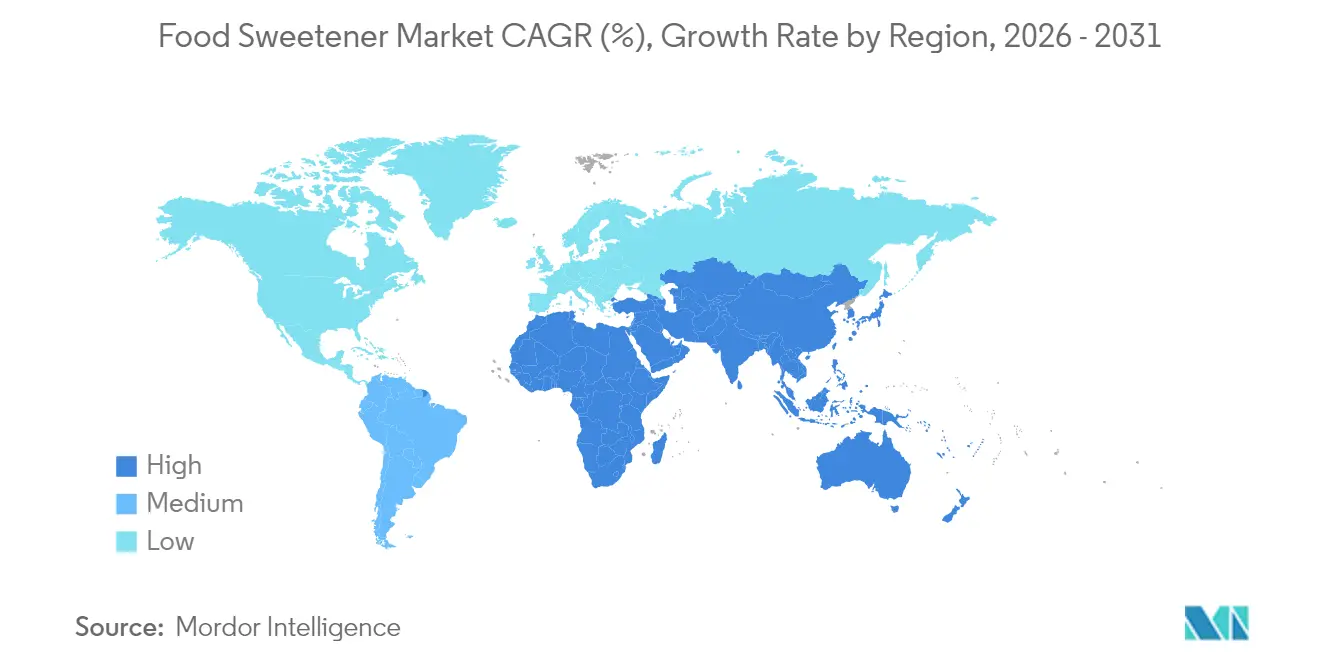
- By geography, Asia-Pacific captured 38.12% of the food sweetener market share in 2025, and the Middle East and Africa are forecast to register 7.02% CAGR to 2031.
Note: Market size and forecast figures in this report are generated using Mordor Intelligence’s proprietary estimation framework, updated with the latest available data and insights as of 2026.
Market Trends and Insights
Drivers Impact Analysis of Food Sweetener Market*
| Driver | (~) % Impact on CAGR Forecast | Geographic Relevance | Impact Timeline |
|---|---|---|---|
| Rising health consciousness among consumers | +1.2% | Global, with stronger impact in North America and Europe | Medium term (2-4 years) |
| Increasing prevalence of obesity and diabetes | +0.9% | Global, particularly acute in Asia-Pacific and North America | Long term (≥ 4 years) |
| Growing demand for low-calorie and sugar-free products | +1.1% | Global, led by developed markets | Short term (≤ 2 years) |
| Expansion of the food and beverage industry | +0.8% | Asia-Pacific core, spill-over to Middle East and Africa and South America | Medium term (2-4 years) |
| Rising consumer preference for natural sweeteners | +1.0% | Global, strongest in North America and Europe | Medium term (2-4 years) |
| Regulatory support for reduced sugar consumption | +0.7% | Global, with varying implementation timelines | Long term (≥ 4 years) |
| Source: Mordor Intelligence | |||
Rising Health Consciousness Among Consumers
The rising health consciousness among consumers is a major driver in the food sweetener market. As individuals increasingly prioritize their health and well-being, there is a growing demand for healthier alternatives to traditional sugar. Consumers are actively seeking products that align with their dietary preferences, such as low-calorie, natural, and non-artificial sweeteners. This shift in consumer behavior is encouraging manufacturers to innovate and introduce a variety of sweeteners that cater to these preferences. Additionally, the increasing prevalence of lifestyle-related diseases, such as diabetes and obesity, has further amplified the need for healthier sweetening options. This trend is expected to continue shaping the food sweetener market during the forecast period. Besides, the growing popularity of plant-based and organic products is also contributing to the demand for natural sweeteners like stevia, monk fruit, and agave syrup. Furthermore, advancements in food technology are enabling the development of innovative sweeteners that mimic the taste of sugar while offering health benefits, such as reduced calorie intake and a lower glycemic index.
Increasing Prevalence of Obesity and Diabetes
The increasing prevalence of obesity and diabetes is a significant driver of the food sweetener market. According to the International Diabetes Federation (IDF), approximately 589 million adults (20-79 years) were living with diabetes in 2024, and this number is projected to rise to 853 million by 2050 [1]. This growing health crisis has led to heightened awareness regarding the adverse effects of excessive sugar consumption, prompting consumers to seek healthier alternatives. As these health conditions continue to rise globally, there is a growing demand for alternative sweeteners that can help manage sugar intake without compromising taste. Consumers are becoming more health-conscious, leading to a shift toward low-calorie and sugar-free sweeteners. This trend is further supported by government initiatives and regulations aimed at reducing sugar consumption to combat obesity and diabetes. Consequently, the food sweetener market is witnessing substantial growth as manufacturers innovate to meet the evolving needs of health-conscious consumers.
Growing Demand for Low-Calorie and Sugar-Free Products
The increasing consumer preference for healthier food options has significantly driven the demand for low-calorie and sugar-free products in the food sweetener market. Rising awareness about the adverse health effects of excessive sugar consumption, such as obesity, diabetes, and cardiovascular diseases, has encouraged consumers to seek alternatives that align with their health-conscious lifestyles. Additionally, the growing adoption of sugar-free diets and low-calorie food products among fitness enthusiasts and individuals managing chronic health conditions has further fueled this demand. Manufacturers are responding to this trend by innovating and expanding their product portfolios to include natural and artificial sweeteners that cater to these preferences. This shift is also supported by government initiatives and regulations promoting reduced sugar consumption, which has created a favorable environment for the growth of the sugar-free and low-calorie segment within the food sweetener market.
Government Policies Promoting Sugar Reduction
Government initiatives aimed at curbing sugar consumption are propelling market growth. Regulatory entities, including the World Health Organization (WHO) and national health departments, have rolled out guidelines to tackle excessive sugar intake. For example, the U.S. Food and Drug Administration (FDA) now mandates updated nutrition labels that emphasize added sugars. In the UK, the Soft Drinks Industry Levy, popularly known as the sugar tax, is nudging manufacturers to reformulate their products with less sugar. Likewise, Mexico and India have imposed taxes on sugar-sweetened beverages to deter consumption. The European Union, under its Farm to Fork initiative, is strategizing to lower sugar levels in processed foods. Furthermore, the American Heart Association advocates for limiting added sugars to a maximum of 6% of daily caloric intake [2]. Bolstered by public health campaigns and partnerships with industry groups, these initiatives are promoting the use of low-calorie sweeteners as attractive alternatives in food and beverage formulations.
Restraints Impact Analysis of Food Sweetener Market*
| Restraint | (~) % Impact on CAGR Forecast | Geographic Relevance | Impact Timeline |
|---|---|---|---|
| High production costs of natural sweeteners | -0.8% | Global, particularly affecting emerging market adoption | Medium term (2-4 years) |
| Consumer skepticism about artificial sweetener safety | -0.6% | Global, strongest in Europe and North America | Short term (≤ 2 years) |
| Complex regulatory frameworks for food additives | -0.4% | Global, with varying regional complexity | Long term (≥ 4 years) |
| Limited consumer acceptance in certain regions | -0.5% | Regional, particularly in traditional food cultures | Medium term (2-4 years) |
| Source: Mordor Intelligence | |||
High Production Costs of Natural Sweeteners
The high production costs associated with natural sweeteners act as a significant restraint in the food sweetener market. Factors such as the extensive cultivation requirements, labor-intensive extraction processes, and the need for advanced processing technologies contribute to these elevated costs. The cultivation of raw materials like stevia, monk fruit, and other natural sources often requires specific climatic conditions and significant agricultural inputs, further driving up expenses. Additionally, the reliance on specific raw materials, which are often subject to seasonal availability and price volatility, further exacerbates the issue. For instance, adverse weather conditions or supply chain disruptions can lead to raw material shortages, causing price surges and impacting production timelines. These challenges make natural sweeteners less cost-competitive compared to synthetic alternatives, thereby limiting their adoption among manufacturers. Furthermore, the stringent regulatory requirements for natural sweeteners, including certifications and compliance with food safety standards, add another layer of cost burden for producers.
Consumer Skepticism About Artificial Sweetener Safety
Consumer skepticism regarding the safety of artificial sweeteners acts as a significant restraint in the food sweetener market. Concerns about potential health risks, such as links to chronic diseases, metabolic disorders, and other adverse effects, have led to increased scrutiny of these products. Regulatory bodies and scientific studies have not always provided consistent conclusions, further fueling uncertainty among consumers. This skepticism has prompted a shift in consumer preferences toward natural sweeteners, such as stevia and honey, which are perceived as healthier alternatives. Additionally, the growing demand for clean-label products has intensified the focus on transparency and safety in food ingredients, putting artificial sweeteners under greater pressure. The perception of artificial sweeteners as synthetic and chemically processed compounds has further contributed to the negative sentiment surrounding their use. Media reports and advocacy by health-conscious groups have amplified these concerns, influencing consumer behavior and purchasing decisions. Furthermore, the lack of widespread consumer education on the differences between various artificial sweeteners and their respective safety profiles has compounded the issue. As the debate over artificial sweetener safety continues, the food sweetener market must navigate these challenges to sustain growth and meet evolving consumer demands.
*Our forecasts treat driver/restraint impacts as directional, not additive. The impact forecasts reflect baseline growth, mix effects, and variable interactions.
Food Sweetener Market Segment Analysis
By Product Type:
High-Intensity Sweeteners Drive InnovationIn 2025, sucrose commands a dominant 62.84% market share, underscoring its deep-rooted presence in conventional food applications. Its widespread consumer recognition and established use in traditional recipes and processed foods contribute significantly to its sustained market leadership. Sucrose remains a preferred choice for manufacturers due to its functional properties, such as sweetness, texture enhancement, and preservation capabilities, which are difficult to replicate with alternative sweeteners. Additionally, its affordability and ease of availability further strengthen its position in the market. Despite the growing demand for alternative sweeteners, sucrose continues to be a staple ingredient in various food and beverage products, particularly in regions where traditional dietary preferences dominate.
Meanwhile, high-intensity sweeteners are poised to drive growth in the food sweetener market, with a projected CAGR of 6.52% through 2031. These sweeteners are gaining traction due to their low-calorie content and suitability for health-conscious consumers. Their increasing adoption in beverages, confectionery, and other low-calorie food products highlights their role as a growth catalyst. Furthermore, the rising prevalence of lifestyle-related health conditions, such as obesity and diabetes, has accelerated the shift toward sugar substitutes, boosting the demand for high-intensity sweeteners. Additionally, the Centers for Disease Control and Prevention (CDC) highlights that in the United States alone, over 38.4 million people have diabetes, with 98 million adults having prediabetes as of 2024 . Innovations in formulation technologies, coupled with regulatory approvals for newer sweetener variants, are also expanding their application scope. As consumer preferences evolve, high-intensity sweeteners are expected to play a pivotal role in addressing the demand for healthier and more sustainable sweetening solutions.

By Form:
Liquid Applications Gain MomentumSolid sweeteners maintain 61.68% market share in 2025, reflecting established use in baking and confectionery applications where crystalline structure provides functional benefits beyond sweetening. Liquid and syrup forms accelerate at 6.9% CAGR through 2031, driven by beverage industry growth and improved dissolution characteristics in aqueous applications. The form preference varies significantly by application, with solid forms dominating tabletop use and industrial baking, while liquids excel in beverage formulation and dairy applications. Processing considerations influence form selection, as liquid sweeteners often provide better dispersion and reduced processing time in large-scale manufacturing.
Beverage manufacturers increasingly prefer liquid sweetener systems that enable precise dosing and consistent flavor profiles without crystallization issues. Spray-dried and granulated forms serve specific industrial needs where flowability and storage stability matter more than dissolution speed. The liquid segment benefits from innovations in concentration technology that reduce shipping costs and storage requirements. Syrup formulations enable custom blending of multiple sweeteners to achieve specific taste profiles and functional characteristics. Form selection increasingly reflects supply chain optimization rather than purely functional requirements, with manufacturers choosing formats that minimize handling costs and inventory complexity.
By Source:
Fermentation Technology Reshapes ProductionIn 2025, plant-based sources dominate the food sweetener market, holding an 87.92% market share. This dominance is primarily driven by the growing consumer preference for natural and sustainable ingredients. Plant-based sweeteners, such as stevia and monk fruit, are widely recognized for their health benefits and minimal environmental impact. Additionally, the availability of well-established extraction technologies has further facilitated the large-scale production and adoption of these sweeteners across various applications, including beverages, confectionery, and baked goods.
Fermentation-derived alternatives, on the other hand, are experiencing significant growth, with a projected CAGR of 6.79% during the forecast period. This growth is attributed to advancements in precision biotechnology, which have enhanced the efficiency and scalability of fermentation processes. These alternatives, such as allulose and tagatose, are gaining traction due to their ability to mimic the taste and functionality of traditional sugars while offering reduced caloric content. As consumer demand for innovative and health-conscious sweetening solutions rises, fermentation-derived sweeteners are expected to play an increasingly important role in the market.
By Application:
Beverages Accelerate AdoptionFood applications dominate with 55.92% market share in 2025, encompassing diverse categories from bakery products to processed foods, where sweeteners serve multiple functional roles beyond taste enhancement. Beverages emerge as the fastest-growing segment at 5.93% CAGR through 2031, driven by reformulation pressures from sugar taxes and consumer health demands. The application split reflects different adoption patterns, with beverages leading innovation due to easier reformulation compared to complex food matrices. Bakery and confectionery applications face technical challenges in replacing sugar's structural properties, while dairy and desserts benefit from sweetener functionality in texture modification.
Nutraceuticals and functional foods represent high-value applications where sweeteners enable product positioning around health benefits rather than mere calorie reduction. Meat and savory products demonstrate emerging applications as manufacturers seek to balance flavor profiles in reduced-sodium formulations. The beverage segment's growth reflects successful reformulation strategies that maintain consumer acceptance while achieving significant sugar reduction. Soft drinks lead adoption due to regulatory pressure and consumer awareness, while sports drinks leverage sweeteners to optimize carbohydrate content for performance applications. The application evolution demonstrates sweetener integration across the entire food system rather than niche health positioning.
Geography Analysis
APAC Food Sweetener Market
In 2025, Asia-Pacific dominates the food sweetener market with a 38.12% share, driven by its large population base and rapid economic development. The region's growing middle-class population and increasing disposable incomes have significantly boosted the demand for processed foods, which, in turn, has fueled the consumption of food sweeteners. Additionally, the expansion of the food and beverage industry, coupled with the rising influence of Western dietary habits, has further propelled market growth in this region. Governments in Asia-Pacific are also implementing supportive policies to enhance food production and processing, which positively impacts the food sweetener market.
MEA Food Sweetener Market
The Middle East and Africa are emerging as a key growth region, projected to register a robust CAGR of 7.02% through 2031. Urbanization and increasing health awareness are the primary drivers of this growth, as consumers shift toward healthier dietary choices, including low-calorie and natural sweeteners. The region is also witnessing a rise in the adoption of international food trends, which is creating opportunities for food sweetener manufacturers. Furthermore, government initiatives aimed at reducing sugar consumption and promoting healthier alternatives are expected to support the market's expansion in the forecast period.
The Americas and Europe Food Sweetener Market
North America exhibits characteristics of a mature market, with a strong focus on premium natural sweeteners, reflecting consumer preferences for high-quality and health-conscious products. Europe, on the other hand, emphasizes regulatory compliance and sustainability, as stringent regulations and environmental concerns shape the market dynamics. In South America, the growing prevalence of diabetes and government-led health initiatives are driving the adoption of food sweeteners. The region is also experiencing increased awareness about the benefits of sugar substitutes, which is encouraging consumers to opt for healthier alternatives. These regional dynamics collectively highlight the diverse growth patterns and opportunities within the global food sweetener market.
Regulatory Landscape
Food sweeteners operate under food-additive and novel-food regimes that increasingly link public-health sugar reduction with tighter safety and specification controls. The market continues to be shaped by sugar-reduction actions across 115 countries and labeling requirements, including US FDA added-sugars disclosure on Nutrition Facts, as well as country-specific sugar taxes such as the UK Soft Drinks Industry Levy and sugar-sweetened beverage taxes used in markets including Mexico and India, which push manufacturers toward reformulation.
In 2026, European regulatory scrutiny added concrete compliance anchors for manufacturers. EFSA published a re-evaluation of sucralose (E 955), confirming safety for currently authorized uses while not confirming safety for proposed use extensions in fine bakery wares due to high-temperature processing considerations. This reinforces the need for application-specific risk assessment in baked goods. EFSA also progressed re-evaluations for acesulfame K (E 950), including an updated opinion establishing an ADI of 15 mg/kg body weight per day, building on 2025 work that flagged impurity-specification attention (for example, around 5-chloro-acesulfame), which can trigger requalification work across supply chains. In Asia, Hong Kong's Centre for Food Safety proposed amending its Sweeteners in Food Regulations (Cap.132U) in June 2026 to align with Codex Alimentarius and mainland China standards, signaling ongoing harmonization efforts that affect cross-border product compliance and documentation.
Competitive Landscape
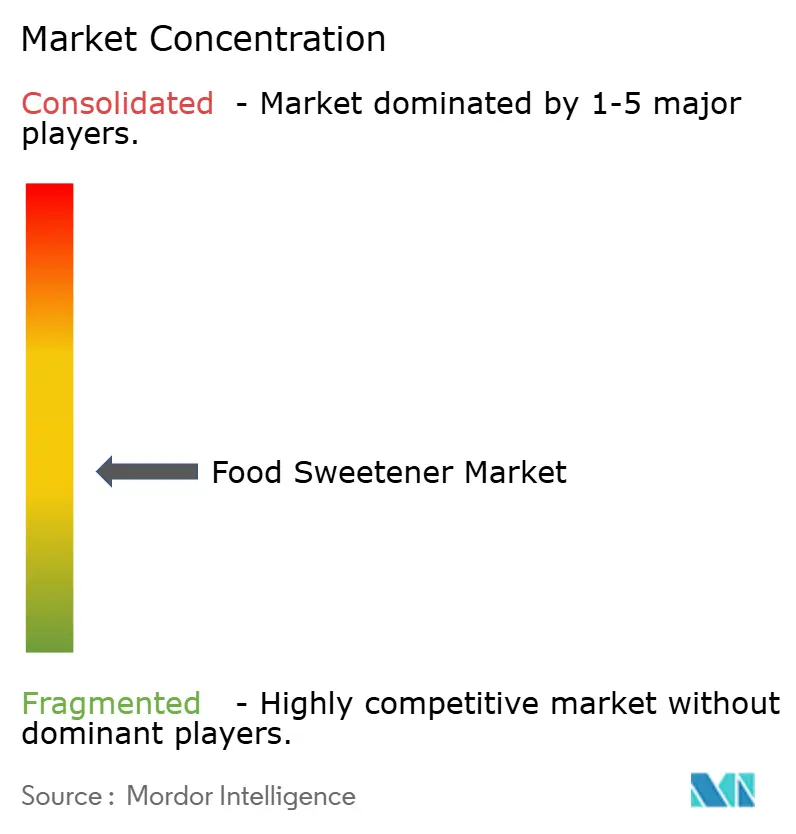
The food sweetener market exhibits moderate fragmentation. This equilibrium in competition allows established giants to command substantial market shares while simultaneously paving the way for newcomers to carve out niches in specialized segments. Industry stalwarts like Cargill, Incorporated, Archer Daniels Midland Company, and Tate & Lyle PLC are aggressively adopting vertical integration strategies. By extending their reach from agricultural inputs to finished ingredients, they effectively mitigate risks associated with raw material price fluctuations. For instance, ADM has invested in partnerships with farmers to secure a steady supply of raw materials, while Cargill has expanded its production facilities to ensure better control over the supply chain. These strategies not only enhance operational efficiency but also strengthen their market positions against emerging competitors.
Beyond vertical integration, companies are driving innovation to meet evolving consumer demands. They are developing hybrid sweetener systems that combine natural ingredients, such as stevia, with fermentation-derived components like allulose. These systems aim to improve cost efficiency, enhance taste, and optimize nutritional profiles. For example, Cargill’s EverSweet, a stevia-based sweetener produced through fermentation, has gained traction for its ability to deliver sugar-like sweetness without the calories. Similarly, ADM has introduced sweetener blends that cater to the growing demand for clean-label products, offering solutions that reduce sugar content while avoiding artificial additives. These innovations are particularly valuable in applications such as beverages, baked goods, and dairy products, where maintaining taste and texture is critical. The competitive landscape also sees smaller players and startups focusing on specialized segments to differentiate themselves.
Companies like Tate & Lyle are leveraging advancements in biotechnology to create plant-based sweeteners with enhanced functionality. For instance, PureCircle has developed next-generation stevia products that address the lingering aftertaste often associated with natural sweeteners. Meanwhile, Tate & Lyle has introduced soluble fibers that not only act as sweeteners but also provide added health benefits, such as improved gut health. This dynamic interplay between established leaders and innovative entrants fosters a balanced yet competitive environment, driving the overall growth and diversification of the food sweetener market.
Food Sweetener Industry Leaders
-
Cargill, Incorporated
-
Archer Daniels Midland Company
-
Tate & Lyle PLC
-
Ingredion Inc.
-
Sudzucker AG
- *Disclaimer: Major Players sorted in no particular order
Food Sweetener Market Companies Covered in this Report
- Cargill, Incorporated
- Archer Daniels Midland Company
- Tate & Lyle PLC
- Ingredion Inc.
- Sudzucker AG
- DSM-Firmenich AG
- Associated British Foods PLC
- Tereos Group
- Roquette Freres S.A.
- Celanese Corporation
- GLG Life Tech Corp.
- Cumberland Packing Corp.
- Ajinomoto Co. Inc.
- Evolva Holding SA
- Pyure Brands LLC
- JK Sucralose Inc.
- Gadot Biochemical Industries Ltd.
- FoodChem International Corporation
- Niutang Chemical Ltd.
- Rajvi Enterprises
- Gulshan Polyols Ltd.
Market Opportunities and Future Outlook
Reformulation programs and product-matrix challenges are creating room for system solutions that combine sweetness, bulking, and mouthfeel, rather than one-for-one sugar replacement. ADM's January 2026 announcement of a USD 26 million investment in its Erlanger, Kentucky, flavor facility (after a 2025 expansion) indicates how suppliers are allocating capital to accelerate customer reformulation work, as sweeteners are increasingly paired with flavors and masking ingredients to deliver sugar-like taste. This supports suppliers with application labs, digital formulation tools, and the capability to serve both high-intensity sweeteners and complementary texturizers for bakery, dairy, and beverage use cases.
Capacity and technology moves during 2026 also point to near-term demand for fermentation-derived and next-generation sweeteners, where supply security and scalability are differentiators. Pentasweet advanced a EUR 65 million brazzein (sweet protein) facility in Vilnius, Lithuania in 2026, moving beyond development toward commercial-scale infrastructure that can broaden the high-intensity portfolio beyond stevia and synthetic HIS. Manus launched a fermentation-derived monk fruit sweetener at commercial scale from its Augusta, Georgia facility in June 2026, providing a more localized supply option for US-focused customers. On the regulatory side, EFSA activity is clarifying boundaries for established sweeteners while continuing to set high bars for new entrants, as reflected by EFSA's May 2025 conclusion that D-allulose novel-food safety could not be established due to applicant data gaps. This increases the commercial value of robust clinical and exposure data packages, impurity control, and application-specific safety evidence for novel and fermentation-derived sweeteners.
Recent Industry Developments in Food Sweetener Market
- June 2026: Ingredion announced a recommended all-cash acquisition of Tate & Lyle, targeting a larger combined platform in specialty ingredients that includes sweetening and texturizing solutions. The transaction signaled further consolidation among major ingredient suppliers and raised the competitive bar for integrated sugar-reduction portfolios sold to global food and beverage manufacturers.
- February 2026: Tate & Lyle and Manus launched Yume M Stevia, a premium stevia-derived sweetener produced at Manus' biofacility in Augusta, Georgia. The launch highlighted a shift toward fermentation-enabled, domestic production footprints for high-intensity sweeteners that support reformulation programs and reduce reliance on import-dependent supply chains.
- August 2024: Cargill opened a new blending facility in Pandaan, Indonesia, to serve Southeast Asian customers with localized sweetener and starch solutions for categories such as sugar confectionery. The facility expanded regional responsiveness for formulation support and shortened lead times for manufacturers working on sugar-reduction and cost-optimization projects.
Food Sweetener Market Report Scope and Research Methodology
Market Definition and Coverage
For this methodology, the food sweetener market means ingredients used to provide sweetness in packaged foods and beverages, including sugar, starch-derived sweeteners, sugar alcohols, and high-intensity sweeteners. These are counted as ingredient sales value.
Scope exclusions: We exclude tabletop sweeteners sold mainly as retail consumer packs. We also exclude sweetness from whole fruits and other non-ingredient sources.
Segments Covered in This Report
- By Product Type
- Sucrose (Common Sugar)
- Starch Sweeteners and Sugar Alcohols
- Dextrose
- High-Fructose Corn Syrup (HFCS)
- Maltodextrin
- Sorbitol
- Xylitol
- Erythritol
- Other Sugar Alcohols
- High-Intensity Sweeteners (HIS)
- Sucralose
- Aspartame
- Saccharin
- Neotame
- Stevia
- Acesulfame-K
- Cyclamate
- Other HIS
- Others
- By Source
- Plant-based
- Fermentation/Bio-engineered
- Artificial
- By Form
- Solid
- Liquid/Syrup
- By Application
- Food
- Bakery and Confectionery
- Dairy and Desserts
- Meat and Savory Products
- Nutraceuticals and Functional Foods
- Sauces, Dressings and Spreads
- Other Processed Foods
- Beverages
- Soft Drinks
- Sport Drinks
- Other Beverages
- Food
- By Geography
- North America
- United States
- Canada
- Mexico
- Rest of North America
- Europe
- United Kingdom
- Germany
- France
- Italy
- Spain
- Netherlands
- Sweden
- Poland
- Belgium
- Rest of Europe
- Asia-Pacific
- China
- India
- Japan
- Australia
- South Korea
- Indonesia
- Thailand
- Singapore
- Rest of Asia-Pacific
- South America
- Brazil
- Argentina
- Colombia
- Peru
- Chile
- Rest of South America
- Middle East and Africa
- South Africa
- Saudi Arabia
- United Arab Emirates
- Nigeria
- Egypt
- Morocco
- Turkey
- Rest of Middle East and Africa
- North America
Data Sources, Market Sizing, and Validation
Desk Research
Desk research was used to map the value chain and anchor the model with public signals that can be checked repeatedly. We leaned on FAOSTAT and USDA for sugar and crop balance context, UN Comtrade for trade flows, the International Sugar Organization for industry statistics, and Codex Alimentarius and FDA guidance for how sweeteners are defined and used in foods.
To link these signals to revenues, we also reviewed annual reports and investor presentations from ingredient suppliers, plus importer and exporter disclosures and credible trade press coverage on pricing and capacity changes. Where needed, paid subscriptions for company financials and a patent database were used to track expansions, product approvals, and innovation themes that can change mix and pricing. These desk sources are illustrative, and many other public references were also used to collect inputs, validate outcomes, and clarify edge cases.
Primary Interviews and Surveys
Primary work was used to pressure-test scope, pricing logic, and the split between sugar and substitutes across key consuming regions. We spoke with ingredient suppliers, distributors, and food and beverage formulators, so application-level usage and reformulation pace could be translated into realistic demand patterns. Inputs were then used to confirm assumptions on blend rates, substitution (for example, sucrose to polyols or high-intensity sweeteners), and typical contract timing by geography.
Distribution of primary research fieldwork respondents
| Company type | Respondent position | Region |
|---|---|---|
| Top tier: 37% | CXOs: 13% | APAC: 48% |
| Mid tier: 43% | Functional/Unit leaders: 32% | EMEA: 32% |
| Smaller Players: 20% | Managers: 55% | Americas: 20% |
Market-Sizing & Forecasting
The core sizing starts with a top-down reconstruction of the demand pool by linking sweetener use to food and beverage output and reformulation intensity. This is then translated into value using category-level pricing signals. We corroborate totals with selective bottom-up checks, including sampled supplier revenue splits, distributor channel checks, and sampled price-times-volume builds for high-usage applications, before adjusting the mix to match what was heard in interviews.
Key inputs used in the model include sugar and corn-derived sweetener supply indicators, import and export movements of major sweetener categories, observed price movement for key inputs and finished sweeteners, the pace of sugar-reduction policies in packaged foods, and the adoption rate of high-intensity and polyol sweeteners in beverages and bakery. Forecasting relies mainly on scenario analysis, where base, faster-reformulation, and slower-reformulation cases are built and then narrowed using expert consensus on regulation timelines, formulation cost tradeoffs, and likely pricing pass-through. Where bottom-up signals are missing for smaller categories, gaps are handled through conservative proxy ratios based on comparable applications, and then rechecked against total sweetener intensity trends.
Data Validation & Update Cycle
Outputs are validated through triangulation across independent signals, including trade data directionality, supplier commentary on volume and pricing, and application-level usage trends from interviews. Variances are flagged, and the model is reworked when a driver (such as a sharp price change or capacity addition) breaks the expected relationship between volume and value.
Before sign-off, the work goes through multi-step analyst review, and follow-up calls are triggered when key assumptions shift or when new public data creates a material mismatch. Reports are refreshed annually, and interim updates are made for major events that can move pricing, supply, or regulations. Right before delivery, a final pass is completed so the latest updated view is included.
Mordor Intelligence's Food Sweetener Market Sizing Compared With Other Published Estimates
Published market sizes for food sweeteners often look different even when the same end industry is being discussed, since scope choices and pricing logic vary more than many readers expect. The biggest gaps usually come from what gets counted as ingredient sales versus retail value, how blended sweetener systems are treated, and which year and currency timing is used.
The main gap comes from including consumer retail sweeteners and broader "sweeteners" adjacent categories. In that case, Mordor Intelligence counts only ingredient sweeteners supplied into food and beverage manufacturing, and then prices them using application-linked mix and contract timing rather than a single blended average.
Benchmark comparison
| Source | Market Size | Gaps in Research Methodology |
|---|---|---|
| Mordor Intelligence | USD 87.44 B (2026) | |
| Trade Publisher A | USD 87.20 B (2024) | Uses a different base year and tends to present a broader food sweeteners view without clearly separating ingredient sales into food and beverages from other channels, which can shift mix and average price assumptions. |
| Industry Data Firm B | USD 91.73 B (2024) | Tracks a wider sweeteners definition and applies higher growth expectations across the full basket, so the valuation can move upward when low-intensity sugar and specialty sweeteners are priced under one umbrella. |
Overall, the spread is mainly explained by definition choices, the year used for the stated value, and how average pricing is built when multiple sweetener types are combined. With clear inclusion rules and repeatable checks tied to food and beverage demand indicators, the estimate becomes easier to reconcile with real-world supply and formulation behavior.
Key Questions Answered in the Report
What is the current value of the food sweetener market?
The food sweetener market size is USD 87.44 billion in 2026.
Which region leads global demand?
Asia-Pacific holds the largest share at 38.12% owing to China and India’s expanding processed-food sectors.
Which product segment is growing fastest?
High-intensity sweeteners post the highest CAGR at 6.52% as brands seek zero-calorie alternatives.
How will regulatory trends shape the market?
Sugar taxes in 115 countries and stricter additive approvals in the United States and Europe will keep pressuring brands to reformulate with alternative sweeteners.