
Food Premix Market Size and Share
Market Overview
| Study Period | 2021 - 2031 |
|---|---|
| Market Size (2026) | USD 2.95 Billion |
| Market Size (2031) | USD 4.13 Billion |
| Growth Rate (2026 - 2031) | 6.95 % |
| Fastest Growing Market | South America |
| Largest Market | Asia Pacific |
| Market Concentration | Medium |
Major Players *Disclaimer: Major Players sorted in no particular order Image © Mordor Intelligence. Reuse requires attribution under CC BY 4.0. | |
Food Premix Market Analysis by Mordor Intelligence
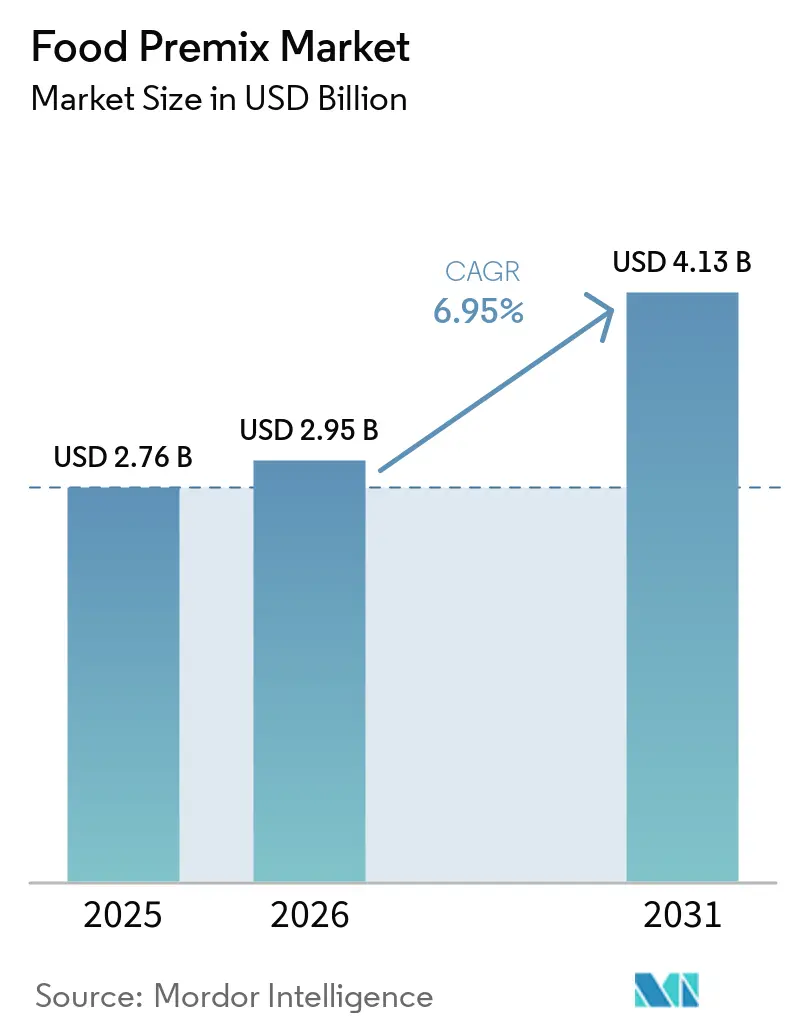
Food premix market size in 2026 is estimated at USD 2.95 billion, growing from 2025 value of USD 2.76 billion with 2031 projections showing USD 4.13 billion, growing at 6.95% CAGR over 2026-2031. Government-mandated fortification programs, increasing health awareness, and advancements in nutrient-delivery technologies drive the demand for premix solutions. Mandatory wheat flour fortification regulations across various countries and new folic acid requirements in the United Kingdom create stable demand for suppliers. The Asia-Pacific region maintains its position as the primary demand center, while South America experiences the fastest growth, driven by Brazil's expanding feed and food processing industries investing in fortified ingredients. The vitamin premix segment maintains its market leadership across various applications. Vitamin premixes, extensively used in food and beverage formulations and dietary supplements, enable manufacturers to fortify products with essential nutrients, including vitamins A, D, E, and B-complex. The dietary supplements segment has emerged as a significant growth area for premix manufacturers, as consumers across different age groups focus on preventive health measures, driving demand for premix solutions targeting fitness, mental wellness, and healthy aging.
Key Report Takeaways
- By type, the vitamins premix segment led with 34.62% food premix market share in 2025, while amino acids are set to grow at a 8.87% CAGR between 2026-2031.
- By form, powder controlled 62.78% of the food premix market in 2025; liquid formulations posted the fastest 10.05% CAGR to 2031.
- By application, food and beverage held a 52.74% share of the food premix market size in 2025, whereas dietary supplements are projected to expand at a 9.55% CAGR through 2031.
- By geography, Asia-Pacific captured 37.88% share in 2025, and South America is forecast to register a 8.91% CAGR over 2026-2031.
Note: Market size and forecast figures in this report are generated using Mordor Intelligence’s proprietary estimation framework, updated with the latest available data and insights as of 2026.
Global Food Premix Market Trends and Insights
Drivers Impact Analysis*
| Driver | (~) % Impact on CAGR Forecast | Geographic Relevance | Impact Timeline |
|---|---|---|---|
| Rising demand for functional and fortified food products | +1.8% | Global, with strongest uptake in North America and Europe | Medium term (2-4 years) |
| Growing adoption of preventive healthcare practices among consumers | +1.2% | Global, led by developed markets, expanding to Asia-Pacific | Long term (≥ 4 years) |
| Rising prevalence of micronutrient deficiencies | +1.5% | Asia-Pacific, Sub-Saharan Africa, with policy spillover to Latin America | Short term (≤ 2 years) |
| Accelerated growth of sports and active-nutrition supplements | +0.9% | North America and Europe core, expanding to Asia-Pacific urban centers | Medium term (2-4 years) |
| Government-led mandatory fortification programs | +2.1% | Global, with accelerated implementation in LMICs (Low- and Middle-Income Countries) | Short term (≤ 2 years) |
| Growth in personalized nutrition | +0.7% | North America and Europe, early adoption in Asia-Pacific metros | Long term (≥ 4 years) |
| Source: Mordor Intelligence | |||
Rising Demand for Functional and Fortified Food Products
The growing inclination toward health and wellness is a key driver fueling the demand for functional and fortified food products in the food premix market. Modern lifestyles characterized by increased automation, reduced physical activity, and various socio-economic pressures have led to a surge in chronic health conditions. As a result, consumers are prioritizing health and nutrition, which is accelerating the shift toward foods enriched with essential nutrients. Functional foods fortified with vitamins, minerals, prebiotics, and amino acids are increasingly viewed as necessary for maintaining optimal bodily functions. Manufacturers are responding by expanding their product portfolios with nutrient-rich premixes to attract health-conscious consumers. According to the International Food Information Council (IFIC), in 2023, 28% of U.S. respondents identified a "good source of nutrients" as a key indicator of healthy food, while 33% associated healthiness with being a "good source of protein/amino acids" [1]. These statistics underscore the increasing consumer awareness and demand for fortified products, positioning the functional food segment as a key growth area within the food premix market.
Growing Adoption of Preventive Healthcare Practices Among Consumers
The preventive healthcare approach has transformed consumer behavior, as individuals increasingly view nutrition as a proactive health management tool rather than a response to illness. This transformation creates consistent and sustained demand for nutrient-dense products across all age demographics, generating stable and recurring revenue streams for food premix suppliers. Increasing healthcare costs in developed economies strengthen the demand for nutrition-based preventive measures. According to the OECD, the United States spent USD 13,432 per person on healthcare in 2023, the highest among member countries, significantly exceeding Switzerland, the second-highest spender. Norway, Germany, and Austria also demonstrate consistently high healthcare expenditure, indicating a broader pattern across developed nations [2]. The market continues to experience significant growth through personalized nutrition, which provides comprehensive dietary recommendations based on individual genetic data. This approach has gained substantial adoption in developed markets where consumers demonstrate heightened awareness of the connection between diet, genetics, and disease prevention. The personalized nutrition trend enables premium pricing strategies, particularly in the dietary supplements segment, where customized premix formulations command higher price points.
Rising Prevalence of Micronutrient Deficiencies
Global micronutrient deficiency affects a substantial portion of the population, creating both a public health challenge and a market opportunity for food premix solutions. The economic impact of undernutrition, which results in reduced productivity and GDP losses across countries, has increased governmental and regulatory focus on mandatory food fortification programs. These programs generate consistent demand for premix solutions, particularly in staple foods, where fortification provides cost-effective and broad population coverage. In India, research by Tata 1mg Labs in 2023, conducted across 27 cities and involving 2.2 lakh individuals, revealed that 76% of the population had a Vitamin D deficiency. The study found higher prevalence among younger demographics, with 84% of individuals under 25 years and 81% in the 25-40 age group affected. The gender distribution showed a 75% deficiency in females and a 79% deficiency in males. These widespread deficiency rates across population segments demonstrate the need for targeted fortification approaches, driving increased demand for micronutrient premixes in the food industry. The combination of growing public awareness and stricter regulations continues to expand the market for premix solutions.
Accelerated Growth of Sports and Active-Nutrition Supplements
The sports nutrition segment has expanded beyond elite athletes to include mainstream consumers focused on active lifestyles, physical fitness, and overall well-being. This broader consumer base reflects changing lifestyle patterns and demographic shifts, including aging populations seeking to maintain physical function and younger generations incorporating fitness into their daily routines. The growth in the sports and active-nutrition supplements market has created opportunities for food premix suppliers. Consumers now demand products that support endurance, recovery, and general performance enhancement, increasing the need for specialized nutrient blends with proven effectiveness. The sports nutrition segment demonstrates strong price resilience, particularly for products with clinically validated performance claims. This enables premix suppliers to achieve higher margins through evidence-based formulations that align with consumer objectives. According to Sports Destination Management, 242 million Americans participated in at least one sports or fitness activity in 2023, representing nearly 80% of the U.S. population aged 6 and older. This figure shows a 2.2% increase from 2022 and represents the highest recorded participation in a single year [3]. This increased physical activity highlights the growing importance of sports and active-nutrition supplements in daily wellness routines.
Restraints Impact Analysis*
| Restraint | (~) % Impact on CAGR Forecast | Geographic Relevance | Impact Timeline |
|---|---|---|---|
| Fluctuating prices of raw materials used in premix formulations | -1.4% | Global, with acute impact in import-dependent regions | Short term (≤ 2 years) |
| Limited shelf life of certain premix ingredients | -0.8% | Global, particularly affecting liquid formulations | Medium term (2-4 years) |
| Competition from alternative fortification methods | -0.6% | Developed markets with established biofortification programs | Long term (≥ 4 years) |
| Risk of over-fortification | -0.9% | Developed markets with multiple fortified product exposure | Medium term (2-4 years) |
| Source: Mordor Intelligence | |||
Fluctuating Prices of Raw Materials Used in Premix Formulations
Raw material prices experienced significant volatility, with vitamin markets facing major disruptions in 2024. According to DSM-Firmenich's Q3 2024 vitamin market update, multiple vitamin categories saw substantial price increases, with vitamin E prices reaching five-year highs due to supply disruptions and production facility incidents. The high concentration of vitamin production in China presents a systemic risk, prompting the American Feed Industry Association to advocate for domestic production investment. The supplement industry faces additional challenges from potential tariffs of 25% on Canadian and Mexican goods and 10% on Chinese imports, affecting ingredient sourcing costs. These market conditions have led premix manufacturers to implement hedging strategies and diversify their supply chains, which may limit their growth investments and margin expansion efforts.
Limited Shelf Life of Certain Premix Ingredients
Ingredient stability constraints create operational complexities that limit market expansion, particularly in emerging markets with extended distribution chains and variable storage conditions. The fundamental trade-off between nutrient potency and stability restricts formulation flexibility, especially for liquid premixes where bioavailability advantages must be balanced against reduced shelf life. The developments, such as Facilitated Self-Assembling Technology (FAST) for nanoparticle preparation, enhance the solubility and bioavailability of hydrophobic molecules without requiring surfactants or stabilizers. While these technological advances indicate potential reduction in stability constraints, current limitations affect product development timelines and market entry strategies.
*Our forecasts treat driver/restraint impacts as directional, not additive. The impact forecasts reflect baseline growth, mix effects, and variable interactions.
Segment Analysis
By Type: Vitamins Dominate While Amino Acids Surge
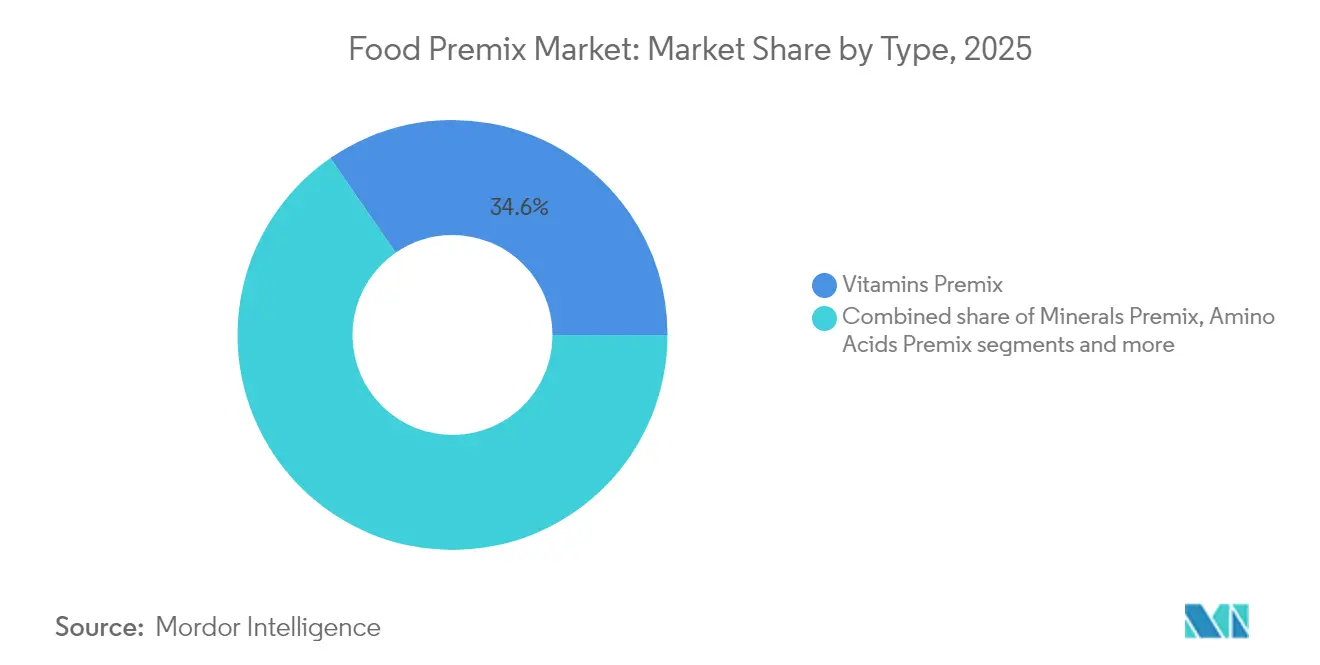
Vitamins premix holds a 34.62% market share in 2025, driven by its essential role in mandatory fortification programs and widespread consumer recognition. The segment's dominance is supported by regulatory requirements in 85 countries that mandate wheat flour fortification, enabling efficient large-scale production and consistent market demand. Amino acids premix is projected to grow at 8.87% CAGR (2026-2031), primarily due to increased demand in sports nutrition and personalized health solutions across global markets.
Minerals premix maintains consistent demand through fortification applications, while the "Others" category includes bioactive compounds and specialized formulations for diverse nutritional needs. The growth in amino acid premix is supported by extensive research validating its effectiveness in muscle recovery and cognitive function, allowing manufacturers to implement premium pricing strategies in various market segments. The market is evolving from basic nutrition supplementation to targeted health solutions, with amino acids emerging as a key segment for performance-focused applications and specialized nutritional requirements.

By Form: Powder Leads but Liquid Innovations Accelerate
Powder formulations hold a dominant 62.78% market share in 2025, due to their stability, cost-effectiveness, and established manufacturing processes. The powder segment benefits from longer shelf life, efficient logistics, and seamless integration with existing food processing equipment, making it the primary choice for large-scale fortification initiatives. The liquid premix segment is projected to grow at 10.05% CAGR (2026-2031), supported by higher bioavailability and versatile applications in beverage and dairy products, including instant beverage premix formats.
The expansion of liquid premixes reflects manufacturers' focus on product differentiation, offering precise nutrient dosing and enhanced sensory properties. The powder segment continues to advance through liqui-solid technologies that convert liquid nutrients into free-flowing powders while retaining improved dissolution characteristics. This technological advancement indicates that future market development may favor combined approaches that integrate powder stability with liquid bioavailability benefits.
By Application: Food and Beverage Maturity Meets Dietary Supplements Dynamism
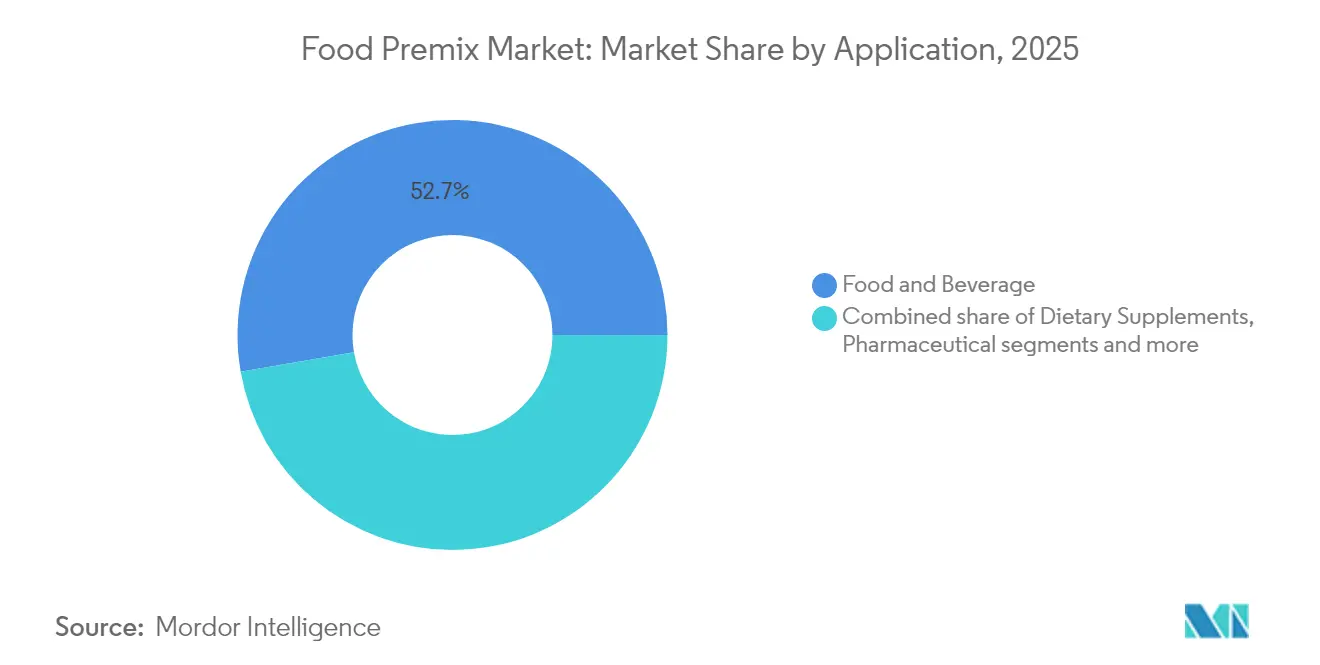
Food and beverage applications hold a 52.74% market share in 2025, forming the core of food premix demand through mandatory fortification requirements and established consumer products. This segment grows steadily due to population expansion and urbanization trends, supported by consistent regulatory frameworks and established market dynamics. The segment benefits from long-term stability and predictable volume growth patterns across global markets. Dietary supplements represent the fastest-growing application with a 9.55% CAGR (2026-2031), driven by increasing consumer focus on preventive healthcare and personalized nutrition. Growth in this segment reflects key demographic factors, including aging populations, higher healthcare costs, and increased health awareness among younger consumers, while also benefiting from technological advancements in delivery formats.
The pharmaceutical segment maintains consistent demand for therapeutic formulations that require precise dosing and strict regulatory compliance, with specialized requirements for stability and bioavailability. The food and beverage sector encompasses three main categories: dairy products, bakery and confectionery, and beverages. The beverage category shows significant innovation in functional drinks, while dairy and bakery segments demonstrate sustained demand. The segment's established market position generates reliable revenue streams that fund research and development in new applications, supporting continued innovation across product categories.
Geography Analysis
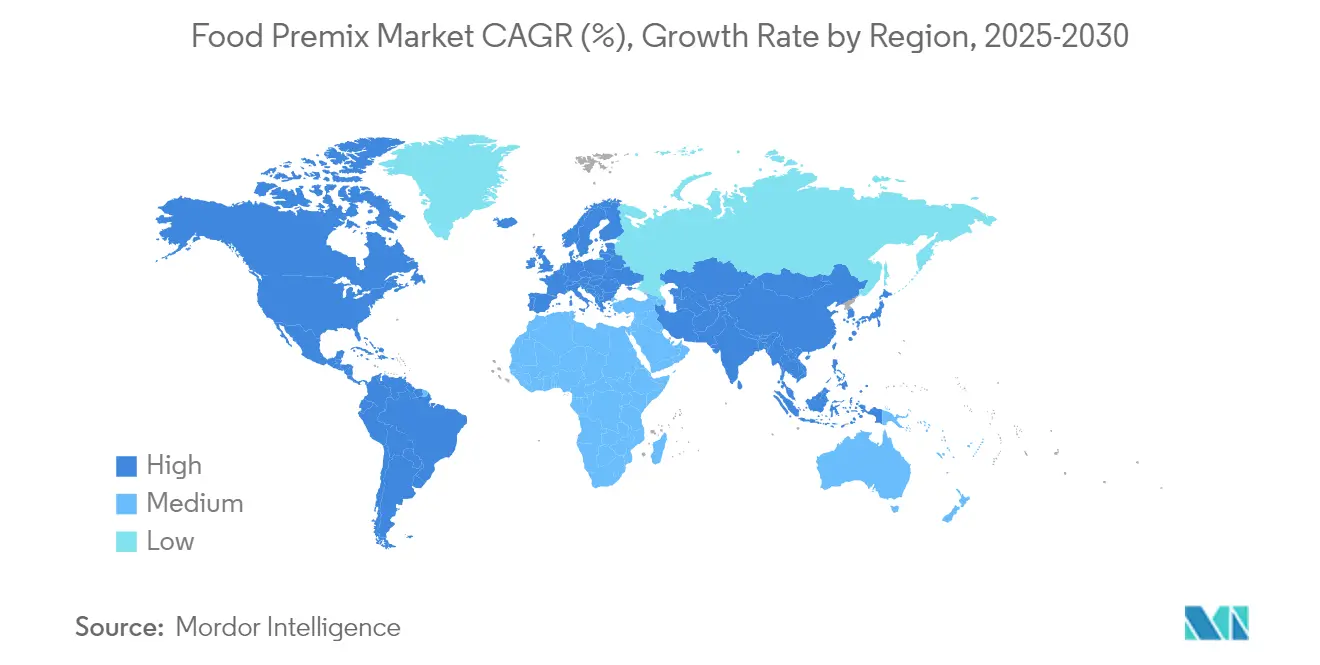
Asia-Pacific maintains a 37.88% market share in 2025, supported by comprehensive government fortification initiatives, ongoing urbanization trends, and increasing health awareness among the expanding middle-class population. The Asia-Pacific market operates under varied regulatory frameworks, with multiple growth opportunities. India's extensive school-meal programs and Japan's stringent Food for Specified Health Uses regulations maintain consistent market demand. Indonesia, Vietnam, and the Philippines have implemented simplified regulations for vitamin-mineral blends, reducing market entry timelines. Companies with strong regulatory compliance capabilities continue to gain competitive advantages in these dynamic markets.
South America records the highest growth at 8.91% CAGR (2026-2031), with Brazil's strong animal nutrition market and expanding food processing industry driving regional expansion. The region benefits from Feedlatina's regulatory harmonization efforts across Latin American animal feed industries, enabling sustained market growth and standardization that supports premix suppliers' regional operations.
North America and Europe maintain stable market positions with well-defined regulatory frameworks and sustained demand for premium formulations. The United Kingdom's 2024 flour fortification legislation updates, actively supported by Nutrition International, demonstrate ongoing regulatory developments that create substantial market opportunities in developed regions. The varied growth patterns across regions indicate that successful premix manufacturers must implement comprehensive region-specific approaches while effectively balancing global operational efficiency with local compliance requirements and evolving market preferences.
Regulatory Landscape
Food premix suppliers operate under food additive and fortification rules that differ by market but converge around safety substantiation, GMP, and labeling. In the European Union, premix inputs used as additives are aligned with the EU food additives framework (including Regulation (EC) No 1333/2008) and the European Food Safety Authority (EFSA) authorization process; in January 2026, EFSA published updated guidance on data requirements for the risk assessment of food additive applications, raising the bar for dossiers and documentation that can affect time-to-approval for novel nutrient-delivery or stabilization systems.
In the United States, premix manufacturers and their customers must align with FDA requirements for safe use of additives (for example, conditions under 21 CFR Part 172) and preventive controls expectations, including supply-chain program requirements when hazards require supplier-controlled controls. In February 2026, FDA published its Human Foods Program 2026 Priority Deliverables, including a proposal to require submission of GRAS notices for all new substances claimed as Generally Recognized as Safe (GRAS), reinforcing the importance of robust internal substantiation and traceability. Internationally, Codex Alimentarius standards continue to influence national rulemaking and customer specifications; the Codex Alimentarius Commission held its 49th session in Geneva from 6 to 10 July 2026, adopting new international food standards that can feed into premix formulation decisions for multinational product launches.
Value Chain Analysis
The food premix value chain begins with upstream nutrient and functional ingredient supply (vitamins, minerals, amino acids, carriers, and stabilization aids), followed by premix formulators that blend, standardize, and validate performance to customer specifications. Premix manufacturers add value through formulation development, analytical testing, GMP-based manufacturing, and regulatory documentation support, then supply finished premixes (powder and liquid) to food and beverage producers and dietary supplement manufacturers that incorporate them into finished products.
Quality systems and supplier verification are central across the chain because compliance often requires verified controls at the ingredient-source level, particularly under preventive controls and supply-chain program expectations in major markets. Operationally, the chain is increasingly shaped by partnerships and capability investments that shorten development cycles and improve performance in difficult matrices (for example, beverages, gummies, and high-protein formats). DSM-Firmenich highlights premix customers demand not only blending capacity but also technical and regulatory expertise, while ongoing collaborations in adjacent ingredient innovation, such as Ingredion and Shiru partnering on AI-enabled functional protein discovery, show how ingredient and formulation ecosystems are tightening to support faster formulation iteration and differentiated product concepts.
Competitive Landscape
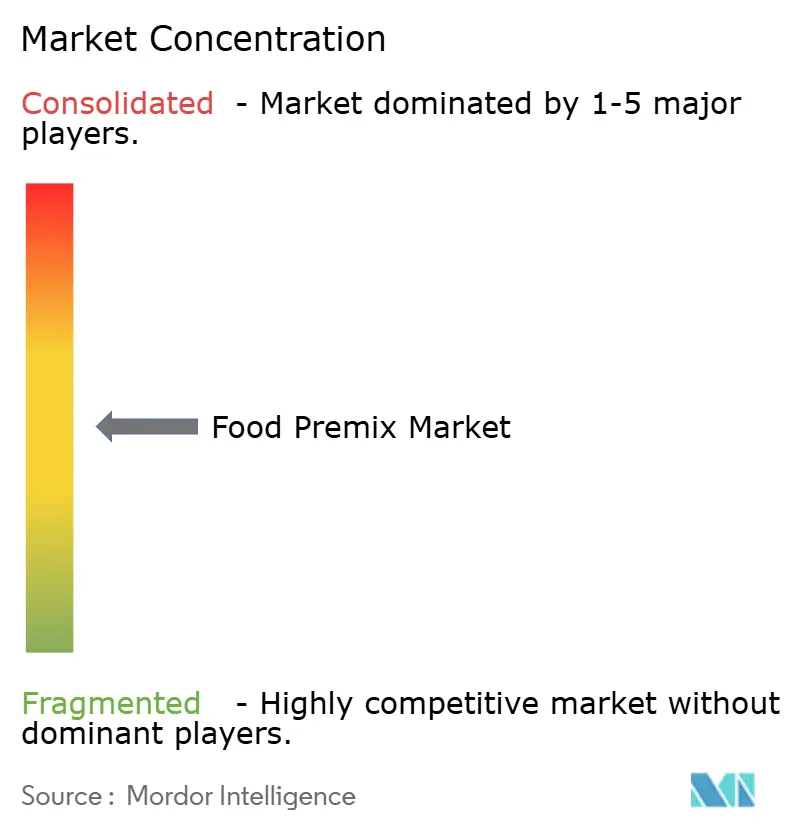
The global food premix market reflects a moderately concentrated structure, with a handful of major players dominating due to their extensive product portfolios, global reach, and strong research and development capabilities. Key players like Glanbia PLC, DSM-Firmenich, Glanbia, Prinova Group LLC, and Corbion N.V. are steering the industry's direction through strategic shifts and innovation-driven growth.
DSM-Firmenich stands out with its significant move to divest its Animal Nutrition and Health division. This decision aims to reduce the earnings fluctuations tied to changing vitamin prices. It underscores a wider industry shift towards human nutrition applications, which promise steadier demand, better profit margins, and opportunities for innovative value addition. By emphasizing segments like sports and medical nutrition, as well as functional foods, these major players are aligning with consumer health trends and the market's push for clean labels and fortified offerings.
On the other hand, smaller and mid-sized companies are finding their niche by honing in on technological expertise rather than sheer size. They're making waves with innovations like patented microencapsulation for enhanced nutrient stability and bioavailability, and advanced nano-milling for optimal ingredient dispersion. Such specialized capabilities empower these niche firms to secure lucrative contracts with manufacturers in functional foods, beverages, and supplements, particularly in areas emphasizing personalized nutrition or adhering to specific regulations.
Food Premix Industry Leaders
-
Corbion N.V.
-
DSM-Firmenich
-
Prinova Group LLC
-
SternVitamin GmbH and Co. KG
-
Glanbia PLC
- *Disclaimer: Major Players sorted in no particular order
Market Opportunities and Future Outlook
Mandatory and expanding fortification initiatives remain a core whitespace for premix suppliers because they institutionalize recurring demand tied to staple-food consumption and public health goals. The report context notes wheat flour fortification mandates in 85 countries, and the United Kingdoms folic acid requirement for flour creates a concrete compliance-driven pull for standardized vitamin-mineral premixes that integrate reliably into industrial milling and bakery supply chains. In Asia-Pacific, large-scale nutrition programs such as Indias school-meal initiatives, alongside markets with defined functional-food rules such as Japans Food for Specified Health Uses, support opportunities for premix providers that can combine regulatory-ready documentation with application support.
Beyond baseline fortification, opportunities are opening in higher-value, function-specific blends for dietary supplements and functional foods, where customers seek differentiated claims and formats (for example, active nutrition, healthy aging, and womens health). Recent company activity reinforces this direction: SternVitamin has been showcasing targeted micronutrient premixes at Vitafoods Europe, including longevity-oriented concepts, highlighting continued product development around demographic-specific needs. On the manufacturing side, investments into GMP zoning and blending capacity, such as DSM-Firmenichs upgrade at its Schenectady premix facility, support faster turnaround and tighter quality control for customers dealing with stricter specifications and more complex formulations.
Recent Industry Developments
- April 2026: SternVitamin presented its SternVita Longevity premix at Vitafoods Europe in Barcelona, positioning a targeted micronutrient blend around cellular vitality and cognitive support. The move reinforces the shift from basic fortification toward function-specific premixes aligned with healthy aging and wellness positioning. It also raises the bar for application support and substantiation as brands look for differentiated, ready-to-formulate solutions.
- October 2025: Prinova debuted multi-layer high-protein snack concepts at SupplySide Global in Las Vegas, using specialized ingredient layers to deliver nutrition and functionality in a single format. The concepts illustrate how premix and ingredient systems are being designed for complex matrices where taste, texture, and stability are limiting factors. This helps widen adoption in mainstream food formats that increasingly compete with supplements for wellness occasions.
- June 2024: Sanku, part of the Millers for Nutrition coalition, launched East Africas first commercial micronutrient premix blending facility in Dar es Salaam, Tanzania. Local production reduces reliance on imported premixes and addresses cost and quality challenges for regional flour millers. The facility supports scaling of fortification programs by improving supply continuity and shortening lead times for staple-food fortification.
Research Methodology Framework and Report Scope
Market Definition and Coverage
This market covers food premixes that are blended, ready-to-use mixes of vitamins, minerals, amino acids, and related micronutrients that food, beverage, and dietary supplement manufacturers buy to fortify finished products. We treat revenues at the premix blender level and count powder and liquid formats.
Scope exclusions: Excludes animal feed and veterinary premixes, stand-alone single-nutrient additives, and pharmaceutical active ingredients.
Segmentation Overview
- By Type
- Vitamins Premix
- Minerals Premix
- Amino Acids Premix
- Others
- By Form
- Powder
- Liquid
- By Application
- Food and Beverage
- Dairy Products
- Bakery and Confectionery
- Beverages
- Others
- Dietary Supplements
- Pharmaceutical
- Others
- Food and Beverage
- By Geography
- North America
- United States
- Canada
- Mexico
- Rest of North America
- Europe
- Germany
- France
- United Kingdom
- Spain
- Netherlands
- Italy
- Rest of Europe
- Asia-Pacific
- China
- India
- Japan
- Australia
- Rest of Asia-Pacific
- South America
- Brazil
- Argentina
- Rest of South America
- Middle East and Africa
- United Arab Emirates
- South Africa
- Saudi Arabia
- Rest of Middle East and Africa
- North America
Data Sources, Market Sizing, and Validation
Desk Research
Desk work starts by mapping the demand pool for fortified and functional foods, then checking how that demand is regulated and reported in each region. Sources we leaned on include public nutrition and fortification references from organizations such as the World Health Organization and FAO, plus national food safety authorities that publish standards and compliance notes.
Trade and supply signals are then used to sanity check ingredient availability and price direction, using sources such as UN Comtrade, national customs statistics, and trade association releases for food ingredients and supplement manufacturing. We also review company filings, investor presentations, peer-reviewed food science journals, and reputed press to understand product launches and formulation shifts, and then a paid subscription for company financials, patent databases, and shipment-level import and export checks is used selectively when it helps close gaps. These desk sources are not exhaustive, and many other public references were reviewed for data collection, validation, and clarification.
Primary Interviews and Surveys
Primary inputs came from interviews and structured surveys with premix blenders, ingredient suppliers, food and beverage manufacturers, and distribution-side experts who track pricing and contract terms. We used these discussions to confirm typical inclusion rules, average selling price movement, and adoption patterns for fortification across major end uses, with coverage spread across APAC, EMEA, and the Americas so regional differences were not averaged away too early.
Distribution of primary research fieldwork respondents
| Company type | Respondent position | Region |
|---|---|---|
| Top tier: 31% | CXOs: 17% | APAC: 47% |
| Mid tier: 47% | Functional/Unit leaders: 41% | EMEA: 32% |
| Smaller Players: 22% | Managers: 42% | Americas: 21% |
Market-Sizing & Forecasting
Sizing is built primarily from a top-down demand reconstruction, where fortified food and beverage output, supplementation intensity, and fortification program coverage are translated into premix consumption, then converted into value using application-level pricing. To keep it grounded, we corroborate totals with selective bottom-up checks, such as sampled supplier and blender revenue bands, channel conversations on volume movement, and ASP x volume builds for a few high-visibility applications.
Key model inputs include reported fortification standards and compliance timelines, mix rates used in typical formulations, the split between powder and liquid premixes, application mix (such as bakery, dairy, beverages, and dietary supplements), and regional trade flows for relevant micronutrient ingredients that influence availability and cost. When some countries do not have clean disclosure, gaps are handled using proxy indicators like packaged food production growth and import dependence, followed by interview-led adjustments.
For forecasting, scenario analysis is used, because adoption and pricing are driven by practical levers that can change quickly, like program rollouts, label claims, and ingredient cost pass-through. Assumptions for volume growth and ASP progression are checked back with primary respondents, and the final forecast is only accepted when the direction matches observed product launches and procurement behavior.
Data Validation & Update Cycle
Validation is done by triangulating the modeled market value against independent signals such as fortified packaged food growth, regional application shares discussed by industry participants, and import and export patterns for key micronutrient inputs. Outliers are flagged, and the logic is rechecked country by country before totals are rolled up, followed by a second analyst review to catch arithmetic and scope alignment issues early.
The study is refreshed annually, and interim updates are triggered when there are material changes such as new mandatory fortification rules, sharp ingredient price swings, or major capacity additions. Before delivery, we do a fresh pass on the most recent public releases and re-contact selected experts if a key assumption starts to drift from what is being seen in the market.
Mordor Intelligence's Food Premix Market Size Versus Other Published Estimates
Published market sizes for food premixes often differ because the scope lines are drawn in different places, and because pricing and volume assumptions are refreshed at different times. The table below highlights how the same market can look larger or smaller depending on what is counted as a premix sale and which year is treated as the current reference point.
The spread is mainly due to category overlap, where some figures roll in broader ingredient blends or adjacent nutrition mixes sold outside premix blender factory-gate revenues. In Mordor Intelligence's model, the value is counted only for customized micronutrient premixes sold for human nutrition at the blender level (including powder and liquid), and it excludes animal feed premixes and single-nutrient additives, which can inflate totals when included, particularly in regions with high fortification activity.
Benchmark comparison
| Source | Market Size | Gaps in Research Methodology |
|---|---|---|
| Mordor Intelligence | USD 2.95 B (2026) | |
| Industry Publisher A | USD 8.11 B (2025) | Uses a broader definition that can include a wider set of ingredient blends and application baskets, and the base year differs, which changes the starting price level and currency timing for the total. |
| Research Publisher B | USD 2.20 B (2024) | Anchors the market in an earlier year and applies a different application and price mix, which can understate recent fortification-driven demand and newer, higher-value premix formulations. |
In practice, most of the gap is explained by what is included as premix revenue, followed by which year is used and how pricing is moved forward. By keeping scope tied to blender-level premix sales and then cross-checking the result with observable demand indicators and interview feedback, the estimate remains traceable to clear inputs and repeatable steps.
Key Questions Answered in the Report
What is the current size of the food premix market?
The food premix market size reached USD 2.95 billion in 2026 and is projected to hit USD 4.13 billion by 2031 at a 6.95% CAGR.
Which region accounts for the largest food premix market share?
Asia-Pacific leads with 37.88% of global revenue in 2025, supported by extensive fortification mandates and strong food-processing growth.
Which application segment is growing fastest?
Dietary supplements are expected to expand at a 9.55% CAGR from 2026-2031 as consumers adopt proactive health and personalized nutrition regimes.
How are raw-material price swings affecting premix suppliers?
Vitamin price volatility and tariff risks increase input costs, prompting suppliers to diversify sourcing and hedge purchases, which can moderate profit expansion.