
Food Intolerance Products Market Size and Share
Market Overview
| Study Period | 2021 - 2031 |
|---|---|
| Market Size (2026) | USD 14.56 Billion |
| Market Size (2031) | USD 19.77 Billion |
| Growth Rate (2026 - 2031) | 6.30 % |
| Fastest Growing Market | Asia Pacific |
| Largest Market | North America |
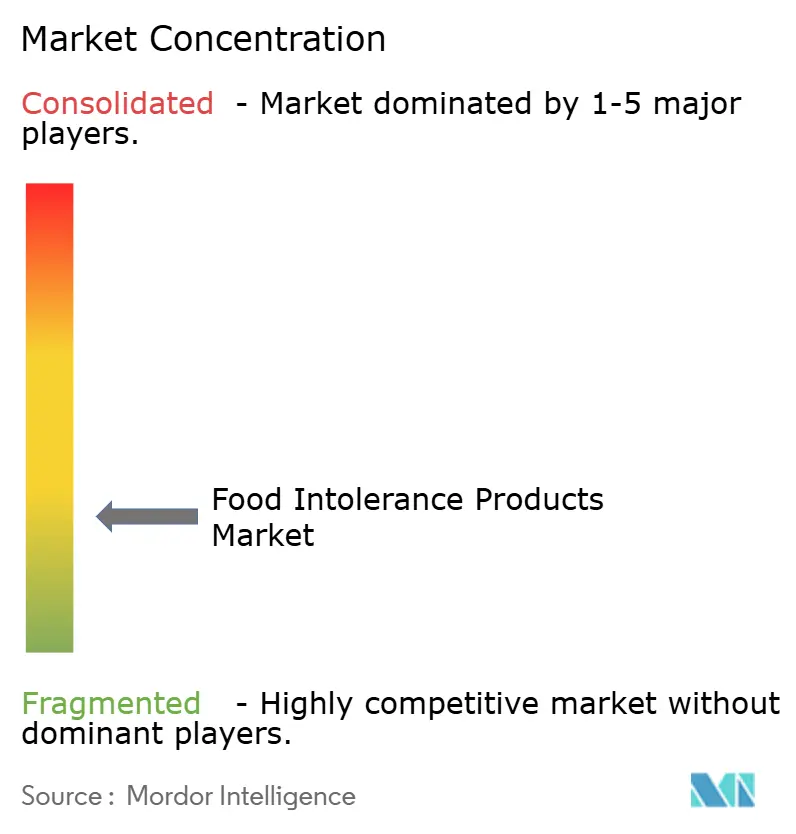
| Market Concentration | Low |
Major Players *Disclaimer: Major Players sorted in no particular order Image © Mordor Intelligence. Reuse requires attribution under CC BY 4.0. | |
Food Intolerance Products Market Analysis by Mordor Intelligence
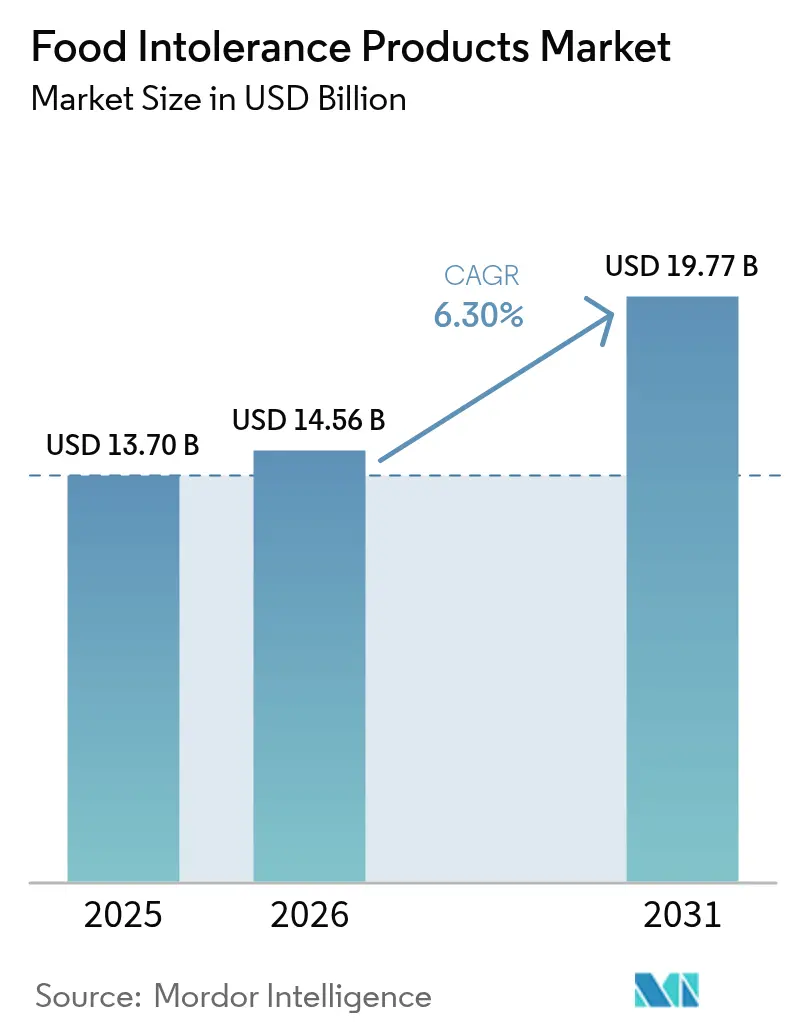
The food intolerance products market size in 2026 is estimated at USD 14.56 billion, growing from 2025 value of USD 13.7 billion with 2031 projections showing USD 19.77 billion, growing at 6.30% CAGR over 2026-2031. The growth trajectory is driven by stringent food-safety regulations, increased consumer awareness of diet-related health concerns, and a steady rise in medically diagnosed allergies. The 2024 update to the U.S. gluten-free rule for fermented and hydrolyzed foods has reduced compliance uncertainties, facilitating new product launches and building trust among sensitive consumers. While North America maintains its leadership due to early regulatory clarity and high label literacy, urban households in the Asia-Pacific region are driving the fastest volume growth, supported by rising incomes and expanding e-commerce. Manufacturers are prioritizing investments in cost-efficient plant-based ingredients and precision fermentation technologies to enhance taste parity with conventional foods, a critical factor for ensuring repeat purchases. Retailers are optimizing shelf space by allocating premium end-caps and algorithm-driven search placements to brands that meet clean-label, allergen-free, and organic standards. These strategic adjustments are expected to support long-term volume growth in the free-from foods market.
Key Report Takeaways
- By product type, dairy and dairy alternatives captured 30.10% of the free-from foods market share in 2025, while confectionery products are projected to expand at a 7.68% CAGR through 2031.
- By labeling type, gluten-free dominated with a 57.00% share of the free-from foods market size in 2025; lactose-free foods are advancing at an 8.02% CAGR between 2026-2031.
- By category, conventional lines accounted for 78.10% of the market in 2025, and organic lines are growing the fastest at 8.84% CAGR to 2031, markedly outpacing conventional products.
- By distribution channel, supermarkets and hypermarkets held 62.95% of the free-from foods market share in 2025, while online retail is growing the fastest at 8.98% CAGR.
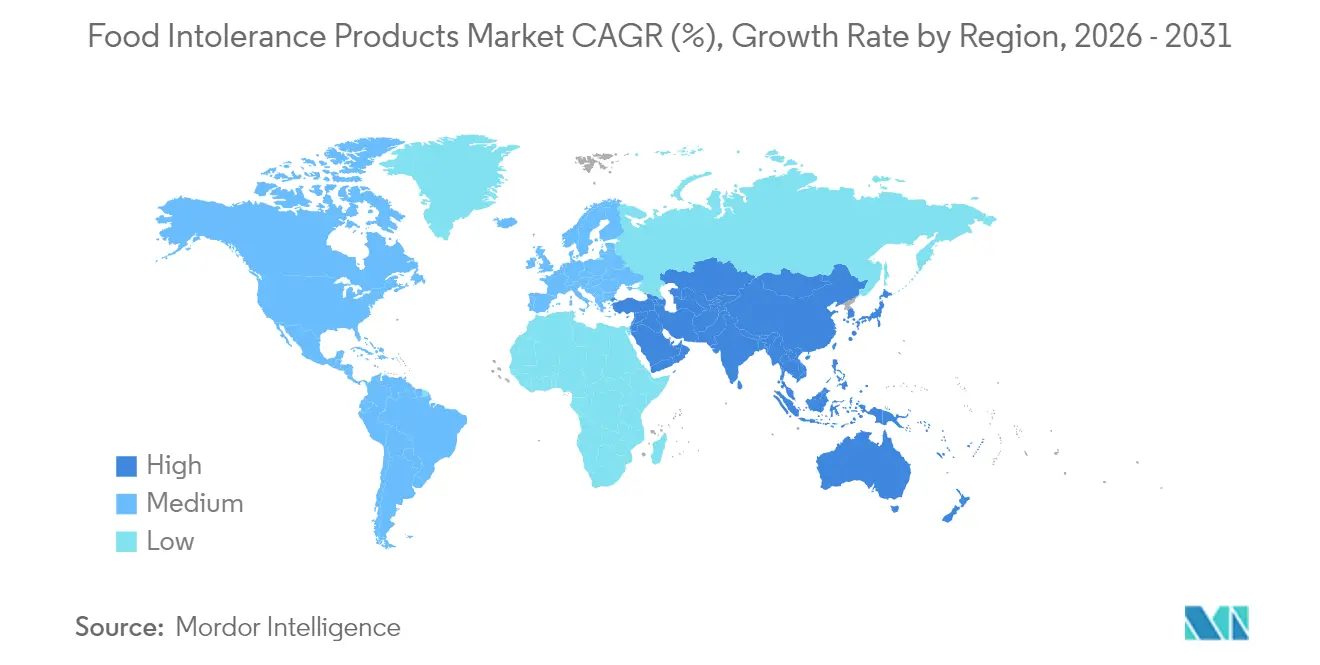
- By geography, North America led with 35.40% revenue share in 2025; Asia-Pacific is forecast to deliver the highest regional CAGR at 8.33% through 2031.
Note: Market size and forecast figures in this report are generated using Mordor Intelligence’s proprietary estimation framework, updated with the latest available data and insights as of 2026.
Market Trends and Insights
Drivers Impact Analysis of Food Intolerance Products Market*
| DRIVER | (~) % IMPACT ON CAGR FORECAST | GEOGRAPHIC RELEVANCE | IMPACT TIMELINE |
|---|---|---|---|
| Premiumization of gluten-free bakery products | +1.2% | North America and Europe; spreading to Asia-Pacific cities | Medium term (2-4 years) |
| Rising prevalence of food intolerances and allergies | +1.8% | Global; highest in developed markets | Long term (≥ 4 years) |
| Increased consumer awareness and demand for label transparency | +0.9% | Global; led by North America and Western Europe | Short term (≤ 2 years) |
| Growth in plant-based and dairy-free diets | +1.4% | Global; early adoption in North America, Europe, Asia-Pacific | Medium term (2-4 years) |
| Expansion of online and specialty retail channels | +0.7% | Global; accelerated in urban markets | Short term (≤ 2 years) |
| Demand for convenient and ready-to-eat products | +0.6% | Global; strongest in developed markets | Short term (≤ 2 years) |
| Source: Mordor Intelligence | |||
Premiumization of gluten-free bakery products
The gluten-free bakery market is transitioning from basic dietary compliance to delivering enhanced sensory experiences and improved nutritional value. For instance, in 2024, General Mills introduced Annie's Super! Mac, featuring 15 grams of protein and 6 grams of fiber per serving through yellow pea integration. This highlights how manufacturers are advancing gluten-free offerings beyond traditional wheat substitutes. Premium positioning enables manufacturers to offset higher production costs while meeting consumer demand for products that match the quality of conventional options. This approach is particularly effective in developed markets, where consumers are willing to pay a premium for perceived health benefits and superior taste. Market analysis indicates that this premiumization strategy is expanding into confectionery and snack segments, unlocking new revenue opportunities for established food manufacturers. However, the sustainability of this trend relies on continuous advancements in ingredient technology and processing methods to deliver conventional-like experiences without compromising 'free-from' attributes.
Rising prevalence of food intolerances and allergies
The market for food allergies and intolerances is experiencing notable growth, driven by evolving consumer lifestyles and health awareness. Factors such as dietary changes, hygiene practices, environmental exposures, and shifts in gut microbiomes are being actively studied as contributors to this trend. In 2024, the Food Standards Agency reported that 12% of consumers in the United Kingdom (excluding Scotland) were affected by food intolerances[1], highlighting the scale of the issue. In response to this growing concern, the FDA implemented updated 2024 regulations for gluten-free labeling of fermented and hydrolyzed foods. These updates aim to address previous regulatory gaps that inadvertently exposed celiac disease patients to gluten, thereby enhancing consumer safety and trust. The prevalence of food intolerances among younger demographics and urban populations underscores a stable and growing demand base, which is expected to evolve into increased purchasing power over time. Furthermore, the healthcare sector's recognition of food allergies as a significant public health challenge is driving regulatory advancements, particularly in the area of transparent labeling standards. This evolving regulatory environment is creating substantial growth opportunities for manufacturers in the 'free-from' food segment, enabling them to cater to the rising demand for allergen-free and intolerance-friendly products.
Increased consumer awareness and demand for label transparency
Driven by high-profile food safety incidents and growing health awareness, consumer demand for label transparency has surged. This shift has prompted regulatory measures, including the FDA's proposed front-of-package nutrition labeling rule announced in January 2025. The regulation focuses on interpretive labeling to enable consumers to quickly assess levels of saturated fat, sodium, and added sugars. This development presents a strategic opportunity for "free-from" products to emphasize the absence of these ingredients. In 2023, the WHO's expert consultation on food allergen risk assessment highlighted the need for more robust precautionary allergen labeling systems, citing inconsistencies and a lack of risk-based approaches that contribute to consumer confusion. Singapore's revised food labeling regulations, effective in 2025, incorporate specific guidelines for gluten-free claims and prohibit misleading statements, reflecting a global shift toward standardized transparency requirements. The alignment of consumer expectations with regulatory frameworks creates a competitive advantage for manufacturers adopting transparent labeling practices. This trend is particularly advantageous for smaller "free-from" food companies, enabling them to differentiate through clear and credible communication about their product attributes and manufacturing processes.
Growth in plant-based and dairy-free diets
Plant-based diets have transitioned from niche health trends to a significant driver of mainstream consumer behavior, supported by institutional endorsements and innovative product developments. In February 2024, Beyond Meat introduced its fourth-generation Beyond IV platform, which reduces saturated fat by 60% through the incorporation of avocado oil and has received certifications from the American Heart Association and American Diabetes Association. This initiative highlights how plant-based manufacturers are addressing longstanding concerns regarding nutritional adequacy. The movement is further validated by advancements in precision fermentation technologies, which produce animal-identical dairy proteins to overcome taste and functionality limitations in traditional plant-based alternatives. Investments in advertising for dairy alternatives are increasing, with the Food Foundation Organization reporting that in the UK, 27% of advertising expenditure was allocated to dairy alternatives, compared to 73% for conventional dairy products[2]. Nestlé's investment in precision fermentation for its Cowabunga range exemplifies how multinational food corporations are strategically preparing for potential disruptions in the dairy market. The trend's growth is further supported by heightened environmental awareness among younger demographics and corporate sustainability initiatives that prioritize plant-based ingredients. Additionally, the movement is expanding geographically, particularly in the Asia-Pacific region, where traditional plant-based diets are being adapted into Western-style convenience formats to meet evolving consumer preferences.
Restraints Impact Analysis of Food Intolerance Products Market*
| RESTRAINT | (~) % IMPACT ON CAGR FORECAST | GEOGRAPHIC RELEVANCE | IMPACT TIMELINE |
|---|---|---|---|
| Higher manufacturing and certification costs limits the growth | -1.1% | Global; most severe in emerging markets | Medium term (2-4 years) |
| Challenges in achieving taste and texture parity with conventional foods | -0.8% | Global; varies by category | Long term (≥ 4 years) |
| Limited availability in emerging markets | -0.6% | Africa | Medium term (2-4 years) |
| Consumer skepticism and confusion over labeling | -0.4% | Global | Medium term (2-4 years) |
| Source: Mordor Intelligence | |||
Higher manufacturing and certification costs limits the growth
Free-from food manufacturers face ongoing cost challenges. Achieving gluten-free certification involves extensive documentation, facility upgrades, and continuous compliance management. According to the FDA's regulatory impact analysis, the annual compliance cost for gluten-free labeling is approximately USD 8.8 million[3]. These costs disproportionately impact smaller manufacturers that lack economies of scale. The need for specialized ingredient sourcing, dedicated production lines, and stringent testing protocols creates structural cost disadvantages, hindering market entry in price-sensitive segments. This issue is particularly significant in emerging markets, where consumers have limited tolerance for premium pricing and regulatory frameworks for free-from foods are still evolving. However, advancements in manufacturing technologies and ingredient alternatives are gradually narrowing these cost disparities. Innovations such as precision fermentation and alternative protein technologies present opportunities to achieve cost parity.
Challenges in achieving taste and texture parity with conventional foods
Despite notable advancements in ingredient science and processing technologies, sensory experience gaps between free-from and conventional foods continue to limit broader market penetration. Consumer preference studies consistently emphasize taste and texture as critical drivers of purchase decisions, yet many free-from products fail to meet the sensory expectations set by conventional alternatives. This issue is particularly significant in the bakery segment, where replicating gluten's structural functionality with alternative binding agents and proteins remains challenging. Innovations in enzyme technology, fermentation techniques, and protein modification are progressively addressing these gaps. However, achieving full sensory equivalence across all product categories remains a long-term objective, requiring sustained investment in research and development.
*Our forecasts treat driver/restraint impacts as directional, not additive. The impact forecasts reflect baseline growth, mix effects, and variable interactions.
Food Intolerance Products Market Segment Analysis
By Product Type:
Dairy Alternatives Drive InnovationDairy and dairy alternatives command 30.10% market share in 2025, reflecting the segment's maturity and broad consumer acceptance across multiple dietary restriction categories. This segment's success is attributed to its ability to simultaneously address the needs of lactose-intolerant consumers, individuals with dairy allergies, and those following plant-based diets, thereby capturing a broader market compared to single-restriction categories. Confectionery products represent the fastest-growing segment, achieving a 7.68% CAGR through 2031, driven by premiumization trends and innovative product development beyond traditional sugar-free offerings. Meanwhile, the bakery segment demonstrates consistent growth, supported by advancements in gluten-free products. Similarly, the meat and seafood categories benefit from innovations in plant-based proteins and alternative protein technologies.
Rising awareness of lactose intolerance symptoms and diagnoses has significantly increased the demand for lactose-free products across multiple food categories. In response, manufacturers are expanding their product portfolios to include lactose-free options in key categories such as milk, yogurt, cheese, and ice cream. For instance, in January 2023, Califia Farms introduced organic almond milk and oat milk products made with simple ingredients like purified water, sea salt, and almonds, excluding added oils or gums, to cater to lactose-intolerant consumers seeking clean-label alternatives. Additionally, sauces, condiments, and dressings present a growing opportunity as manufacturers develop 'free-from' versions of traditionally challenging categories. Furthermore, specialty products targeting niche dietary requirements contribute to the overall diversification of the market.

By Labeling Type:
Lactose-Free Gains MomentumGluten-free foods maintain market leadership with a 57.00% share in 2025, supported by established consumer awareness and regulatory standardization. However, lactose-free products are experiencing faster growth, with an 8.02% CAGR forecasted through 2031, reflecting a shift in consumer preferences beyond celiac disease management. The lactose-free segment capitalizes on its broader demographic reach, as lactose intolerance impacts a larger global population compared to gluten sensitivity, presenting a significant market opportunity. The FDA's updated gluten-free labeling requirements for fermented and hydrolyzed foods in 2024 provide manufacturers with clearer compliance pathways, potentially stabilizing growth in the gluten-free segment while reducing regulatory uncertainties.
Labeling categories are expanding to include emerging free-from claims such as sugar-free, preservative-free, and allergen-specific designations, addressing increasingly sophisticated consumer dietary demands. The integration of multiple free-from claims on a single product offers premium market positioning opportunities but also introduces greater manufacturing complexities and higher certification costs. Singapore's 2025 food labeling regulations highlight this regulatory evolution by establishing clear standards for gluten-free claims and prohibiting misleading statements, thereby supporting market standardization and enhancing consumer confidence.
By Category:
Organic Segment AcceleratesIn 2025, conventional free-from foods continue to dominate the market, holding a significant 78.10% share. This dominance highlights their affordability and widespread availability, making them a preferred choice for a broad consumer base. These products cater to cost-conscious consumers while maintaining a strong presence across various distribution channels. In contrast, organic free-from products are experiencing remarkable growth, with a projected CAGR of 8.84% through 2031. This growth reflects the increasing expansion of the premium market segment, driven by evolving consumer preferences for products that offer dual benefits, such as health and environmental sustainability. The rapid growth of the organic segment aligns with broader trends in the organic market, presenting manufacturers with opportunities to carve out a unique position in an increasingly competitive landscape.
Health-conscious consumers are particularly inclined toward the organic-free-from combination, as they perceive these attributes as complementary and reinforcing each other. This trend is fueled by growing awareness of health and wellness, as well as a shift toward sustainable consumption patterns. However, manufacturers face significant operational challenges in meeting the stringent requirements for both organic certification and free-from compliance. These dual standards demand robust processes and resources, creating high entry barriers for new players. Established companies with advanced supply chain management capabilities are better positioned to navigate these complexities and capitalize on the growing demand. As free-from foods continue to gain mainstream acceptance, the importance of dual certification is expected to rise significantly, becoming a key differentiator for premium positioning in the market.
By Distribution Channel:
Digital Commerce Transforms AccessIn 2025, supermarkets and hypermarkets maintain their dominance with a substantial 62.95% market share, effectively leveraging their extensive shelf space and aligning with established consumer shopping patterns. These retail formats capitalize on their ability to offer a wide variety of free-from products, ensuring convenience and accessibility for a broad customer base. Simultaneously, online retail channels are witnessing significant momentum, with a robust CAGR of 8.98% projected through 2031. This growth is fundamentally altering how consumers discover and purchase free-from products. The integration of digital technologies has facilitated the fulfillment of specialized dietary requirements across diverse geographic regions, addressing the long-standing challenge of limited local availability for niche free-from items. Health-food stores continue to play a critical role in the market by not only providing products but also offering educational resources and personalized consultations. These stores are particularly indispensable for consumers managing complex dietary restrictions, as they deliver expert guidance and tailored product recommendations to meet specific health needs.
Convenience and grocery stores act as accessible distribution points for mainstream free-from products, catering to consumers seeking quick and easy purchasing options. Additionally, other distribution channels, such as specialty retailers, foodservice providers, and direct-to-consumer models, are strategically positioned to serve distinct market segments. For manufacturers of free-from foods, adopting a comprehensive multi-channel strategy is imperative to maximize market penetration and address the diverse shopping preferences and accessibility requirements of consumers. Online platforms, in particular, provide a competitive advantage by offering detailed product descriptions, ingredient transparency, and customer reviews. These features empower consumers to make informed purchasing decisions while ensuring compliance with their dietary restrictions, thereby enhancing trust and loyalty in the brand.
Geography Analysis
North America Food Intolerance Products Market
In 2025, North America secured the largest regional revenue share at 35.40%, driven by stringent allergen-label regulations, a high prevalence of medically diagnosed intolerances, and a well-established chilled-chain logistics network. Collaborative efforts between research institutions and ingredient suppliers in the region are advancing texture-enhancing hydrocolloids and enzyme systems, which are rapidly entering commercial markets. The growing emphasis on ESG reporting has elevated the shelf presence of 'free-from' products with organic or sustainably sourced certifications, further strengthening North America's market leadership.
APAC Food Intolerance Products Market
Asia-Pacific is the fastest-growing region, with an anticipated CAGR of 8.33% through 2031. Urban Millennials in key markets such as China, India, and Thailand are increasingly replacing dairy milk with plant-based alternatives, a trend fueled by social media influencer marketing. Singapore's planned alignment of gluten-free standards with Codex by 2025 is expected to streamline cross-border e-commerce for brands exporting from Australia and the United States. Despite disparities in purchasing power across sub-regions, the adoption of mobile payments and the rise of micro-fulfillment centers are enabling 'free-from' brands to overcome traditional distribution challenges, driving the region's significant growth in the free-from foods market.
EMEA and LATAM Food Intolerance Products Market
Europe combines established organic consumption patterns with certain distribution inefficiencies that limit full product availability. Countries like Germany and Sweden benefit from strong health-food store networks. The EU's stringent allergen-label regulations, among the most rigorous globally, provide consumers with high confidence in both domestic and imported 'free-from' products. In contrast, Latin America and the Middle East and Africa are in the early stages of market adoption. However, the expanding middle class and increasing exposure to Western dietary trends in these regions indicate growth potential, particularly as regulatory frameworks advance and cold-chain infrastructure improves.
Regulatory Landscape
Food intolerance and allergen-positioned products are operating under tightening labeling and allergen-control requirements across major markets, with continued movement toward risk-based precautionary allergen labeling (PAL). In the United States, the Food Allergen Labeling and Consumer Protection Act (FALCPA) remains the key framework for packaged-food allergen declarations, and sesame has been treated as the ninth major allergen under the FASTER Act since January 1, 2023. In parallel, the FDA’s 2024 update clarified gluten-free compliance for fermented and hydrolyzed foods, reducing ambiguity for manufacturers using these processes.
Internationally, the Codex Alimentarius Commission adopted new guidance on the use of PAL at its 49th Session in Geneva in July 2026, setting out a harmonized, risk-based basis for when "may contain" statements can be used. In Australia and New Zealand, FSANZ allergen labeling transition timelines continue to affect packaging changeovers, including the February 2026 depletion deadline for stock labeled under previous allergen declaration requirements (prior to February 25, 2024). In the European Union, Regulation (EU) No 1169/2011 remains central to allergen disclosure (Annex II), supporting high label literacy and compliance-driven product reformulation across free-from categories.
Competitive Landscape
The food intolerance products market is fragmented, with consolidation gaining momentum as established conglomerates increasingly acquire innovation rather than developing it internally. The market dynamics are driven by a combination of scale efficiencies and advanced research and development capabilities. Companies secure a competitive edge by focusing on three critical factors: achieving sensory equivalence, ensuring transparent sourcing, and building a robust omnichannel presence. The major players operating in the market include General Mills Inc., Danone S.A., Abbott Laboratories, Nestlé S.A., and Arla Foods amba, among others.
Small to mid-sized disruptors sustain their relevance by targeting specific dietary niches, such as keto-friendly, nut-free baking mixes, or by operating certified allergen-free facilities, which larger competitors find challenging to replicate without significant retrofitting investments. The steady increase in patent filings at the USPTO for plant-based emulsions, extrusion technologies, and allergen-detection assays underscores the industry's ongoing efforts to address taste and cost challenges through technical advancements.
Competitive dynamics favor companies that can manage certification costs, operate or lease dedicated production lines, and leverage direct data feedback from e-commerce channels. Strategic collaborations between ingredient specialists and contract manufacturers are accelerating time-to-market for start-ups, driving high category turnover, and ensuring a continuous pipeline of innovation in the free-from foods market.
Food Intolerance Products Industry Leaders
-
General Mills Inc.
-
Danone S.A.
-
Abbott Laboratories
-
Nestlé S.A.
-
Arla Foods amba
- *Disclaimer: Major Players sorted in no particular order
Food Intolerance Products Market Companies Covered in this Report
- General Mills Inc.
- Danone S.A.
- Abbott Laboratories
- Nestle S.A.
- Arla Foods amba
- Beyond Meat Inc.
- Green Valley Creamery
- Blue Diamond Growers
- Oatly Group AB
- Dr. Schar AG / SPA
- The Hain Celestial Group, Inc.
- Cabot Creamery Corporation
- Barilla G.e.R. Fratelli SpA
- Conagra Brands, Inc.
- Kraft Heinz Company
- Lactalis Group
- Otsuka Holdings Co., Ltd. (Daiya Foods Inc.)
- Amy's Kitchen Inc.
- SunOpta Inc.
- Oetker Group
Market Opportunities and Future Outlook
Product innovation is moving beyond single-claim free-from items toward formats that aim to preserve conventional taste and functionality while addressing intolerance needs. This is creating room in applications where texture and performance remain purchase barriers, particularly for gluten-free bakery and lactose-free dairy formats beyond liquid milk. A sign of active capability build-out is the June 2026 launch of fermentation-enabled functional ingredients for gluten-free industrial baking, including FERM FOOD ApS introducing a fermented gluten-free bread binder based on solid-state fermentation of buckwheat and fava beans, which is designed to support cleaner-label texture systems for higher-throughput bakeries.
Lactose-free and dairy-alternative opportunities are also being shaped by new protein pathways and regulatory pathways for novel ingredients. In June 2026, Formo submitted an FDA GRAS notice (GRN 1312) for recombinant alphaS1-casein, pointing to progress toward animal-identical dairy proteins that can deliver traditional dairy functionality while serving lactose-intolerant consumers. Alongside ongoing regulatory and labeling focus in the United States and the EU under Regulation 1169/2011, manufacturers and retailers have levers to differentiate through validated allergen management, clearer on-pack communication, and omnichannel discovery tools that reduce consumer confusion around cross-contact and multi-allergen claims.
Recent Industry Developments in Food Intolerance Products Market
- July 2026: Arla Foods Bangladesh launched DANO Lacto Reduced Filled Milk Powder positioned for consumers managing lactose intolerance or sensitivity. The rollout strengthens local-market accessibility for lactose-reduced dairy formats and signals continued portfolio tailoring by large dairy groups to address intolerance-led demand in emerging markets.
- June 2026: Danone entered into definitive agreements to acquire Australia-based MADE Group and to buy the remaining 49% stake in its fresh dairy joint venture with Saputo Dairy Australia. The transactions deepen Danone's control of in-market operations and broaden its healthy and functional nutrition footprint in Asia-Pacific, supporting faster regional portfolio scaling across intolerance-adjacent segments.
- October 2024: Feel Good Foods launched gluten-free chicken soup dumplings to address demand for convenient meal and snack options. The launch extends gluten-free positioning into ready-to-heat frozen foods, reinforcing category expansion beyond core bakery and snacks.
Food Intolerance Products Market Report Scope and Research Methodology
Market Definition and Coverage
This market covers packaged foods and closely related consumables that are made and marketed for people with food intolerances, where the product is positioned as suitable through a clear free-from or intolerance-friendly claim.
Scope exclusions: We exclude prescription drug treatments and medical devices, and we do not count general healthy foods unless an intolerance-related claim is clearly stated on pack or in product specifications.
Segments Covered in This Report
- By Product Type
- Dairy and Dairy Alternatives
- Bakery Products
- Confectionery Products
- Meat and Seafood Products
- Sauces, Condiments and Dressings
- Other Product Types
- By Labeling Type
- Gluten-Free Food
- Lactose-Free Food
- Others
- By Category
- Conventional
- Organic
- By Distribution Channel
- Supermarkets/Hypermarkets
- Health-Food Stores
- Convenience and Grocery Stores
- Online Retail Stores
- Others
- By Geography
- North America
- United States
- Canada
- Mexico
- Rest of North America
- Europe
- Germany
- United Kingdom
- Italy
- France
- Spain
- Netherlands
- Poland
- Belgium
- Sweden
- Rest of Europe
- Asia-Pacific
- China
- India
- Japan
- Australia
- Rest of Asia-Pacific
- South America
- Brazil
- Argentina
- Colombia
- Rest of South America
- Middle East and Africa
- South Africa
- Saudi Arabia
- United Arab Emirates
- Rest of Middle East and Africa
- North America
Data Sources, Market Sizing, and Validation
Desk Research
Desk research was used to build the basic market map, set the regional boundaries, and anchor assumptions that were later stress-tested in interviews. We relied on public sources such as government health and nutrition statistics (for example, CDC-style surveillance), USDA-style food and ingredient references, and food safety regulators that publish allergen and labeling rules and periodic updates.
To connect demand with what is actually sold, we also reviewed trade and customs releases (for example, UN Comtrade type data) for relevant product and ingredient flows, and we used peer-reviewed nutrition and gastroenterology journals to understand prevalence ranges and diagnosis patterns. In addition, company filings, investor presentations, major retailer announcements, association websites, and reputable press were screened to capture launches, claim usage, and distribution expansion, supported by paid subscriptions for company financials and for patent lookups when product claims needed clarification. These examples are not exhaustive, and many other public and paid sources were also referenced for data collection, validation, and research clarification.
Primary Interviews and Surveys
Primary work centered on interviews and structured surveys with packaged food manufacturers, ingredient suppliers, retailers and distributors, and a small set of subject-matter experts who track labeling and nutrition trends across major regions. Inputs helped confirm claim-level scope, typical price ladders by category, the mix of channels (especially online retail versus large stores), and the pace at which lactose-free and gluten-free portfolios are expanding in different geographies.
Distribution of primary research fieldwork respondents
| Company type | Respondent position | Region |
|---|---|---|
| Top tier: 34% | CXOs: 14% | APAC: 43% |
| Mid tier: 49% | Functional/Unit leaders: 36% | EMEA: 36% |
| Smaller Players: 17% | Managers: 50% | Americas: 21% |
Market-Sizing & Forecasting
The core model starts from a top-down demand pool, where population by region is translated into an addressable consumer base using prevalence and diagnosis ranges for intolerance-linked diets, which are then converted into spend using category penetration and average annual consumption value. Once this shape is built, the totals are corroborated with selective bottom-up checks, mainly through sampled category revenues, channel checks on price points, and sanity checks using category-level volume multiplied by realistic average selling prices.
Key inputs tracked include the share of packaged foods carrying gluten-free and lactose-free claims, the mix shift between supermarkets and online retail, typical price premiums for free-from positioning by category, regional diagnosis and awareness trends that affect adoption, and retailer shelf space expansion for these lines. Forecasting was done using scenario analysis supported by regression-style sensitivity on the same drivers, so changes in penetration, pricing, and channel mix can be traced clearly from one year to the next. Where bottom-up snippets were missing for a country or category, gaps were handled by applying validated proxy ratios from similar markets and then re-checking the outcome against local retail structure and income levels from public datasets.
Data Validation & Update Cycle
Model outputs were triangulated against independent signals, including claim prevalence trends, category growth cues from public company reporting, and observed channel expansion patterns, and then variances were investigated before final sign-off. If a region showed an unexpected jump, the assumptions were revisited and selected respondents were re-contacted so the final number was not driven by one-off inputs.
Each report is refreshed annually, and interim updates are made when material events occur, such as major labeling rule changes or sharp commodity-driven pricing moves that can alter premiums. Before delivery, an analyst performs a fresh pass across the model and the recent news cycle so clients receive the most current view available at the time of publication.
Mordor Intelligence's Food Intolerance Products Market Size Versus Other Published Estimates
Published market sizes for food intolerance products do not always match because the scope can shift in small but meaningful ways, and the reference year is not always the same across studies. Differences also come from how analysts treat price premiums, how they translate prevalence into spending, and how often the model is refreshed.
The biggest gap drivers in this market are usually whether the estimate counts only foods with explicit gluten-free or lactose-free style labeling versus also including broader free-from and adjacent wellness products, and whether revenue is built from realistic category-level price ladders or from a single blended average. Currency timing matters too, since regional inflation and exchange rates can shift USD totals noticeably if conversions are not aligned to the same period.
Benchmark comparison
| Source | Market Size | Gaps in Research Methodology |
|---|---|---|
| Mordor Intelligence | USD 14.56 B (2026) | |
| Industry Publisher A | USD 16.70 B (2024) | Uses an earlier base year and appears to include a wider basket of categories and intolerance types, which can lift totals when organic and specialized nutrition lines are counted more broadly. |
| Industry Publisher B | USD 11.10 B (2025) | Anchors growth from a lower starting value and may apply a more conservative price-premium path or narrower channel capture, which reduces the measured revenue pool in the early years. |
The table shows a wide spread mainly because the reference year and included product basket are not aligned. In Mordor Intelligence's model, revenue is counted when products sit within the defined food intolerance product categories and carry clear intolerance-linked labeling, which avoids mixing in broader wellness foods that can inflate totals. With that scope locked and checked with channel and pricing inputs, the resulting market size stays easier to reproduce and update year over year.
Key Questions Answered in the Report
What is the current size of the free-from foods market?
The free-from foods market size stands at USD 14.56 billion in 2026 and is projected to reach USD 19.77 billion by 2031, supported by a 6.30% CAGR.
Which region leads the global free-from foods market?
North America leads with a 35.40% revenue share in 2025, driven by clear labeling regulations and high consumer awareness.
Which product segment is growing the fastest?
Confectionery products, including allergen-friendly chocolates and gummies, are forecast to grow at a 7.68% CAGR through 2031.
How is e-commerce influencing free-from food sales?
Online grocery channels are expanding at a 8.98% CAGR, offering broader assortment filters and direct distribution to consumers with specialized dietary needs.