
Food Grade Phosphoric Acid Market Size and Share
Market Overview
| Study Period | 2021 - 2031 |
|---|---|
| Market Size (2026) | USD 2.76 Billion |
| Market Size (2031) | USD 3.55 Billion |
| Growth Rate (2026 - 2031) | 5.16 % |
| Fastest Growing Market | Asia-Pacific |
| Largest Market | North America |
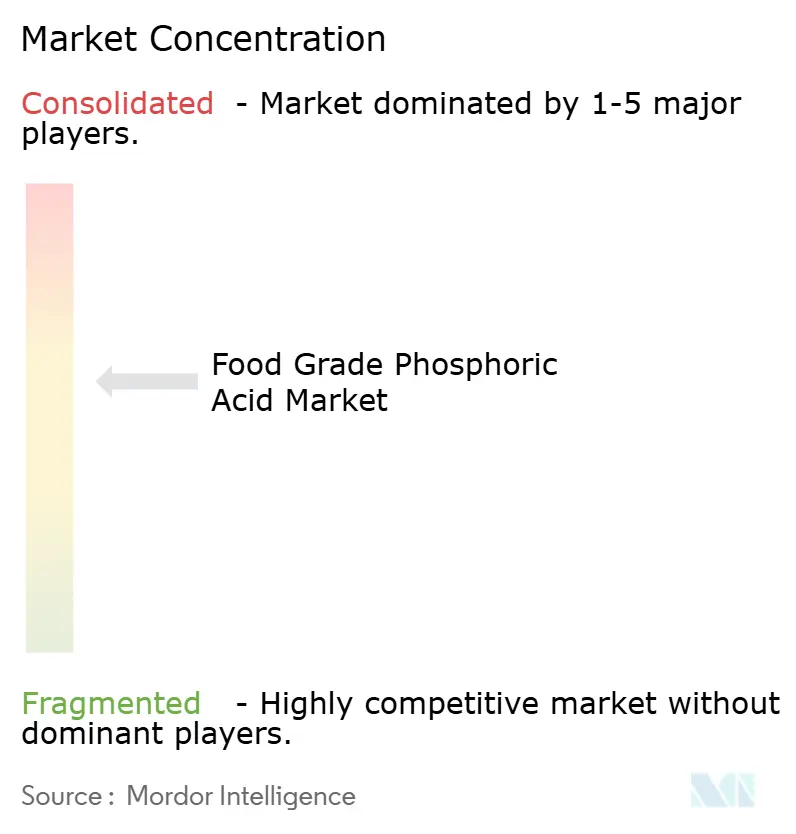
| Market Concentration | Medium |
Major Players *Disclaimer: Major Players sorted in no particular order Image © Mordor Intelligence. Reuse requires attribution under CC BY 4.0. | |
Food Grade Phosphoric Acid Market Analysis by Mordor Intelligence
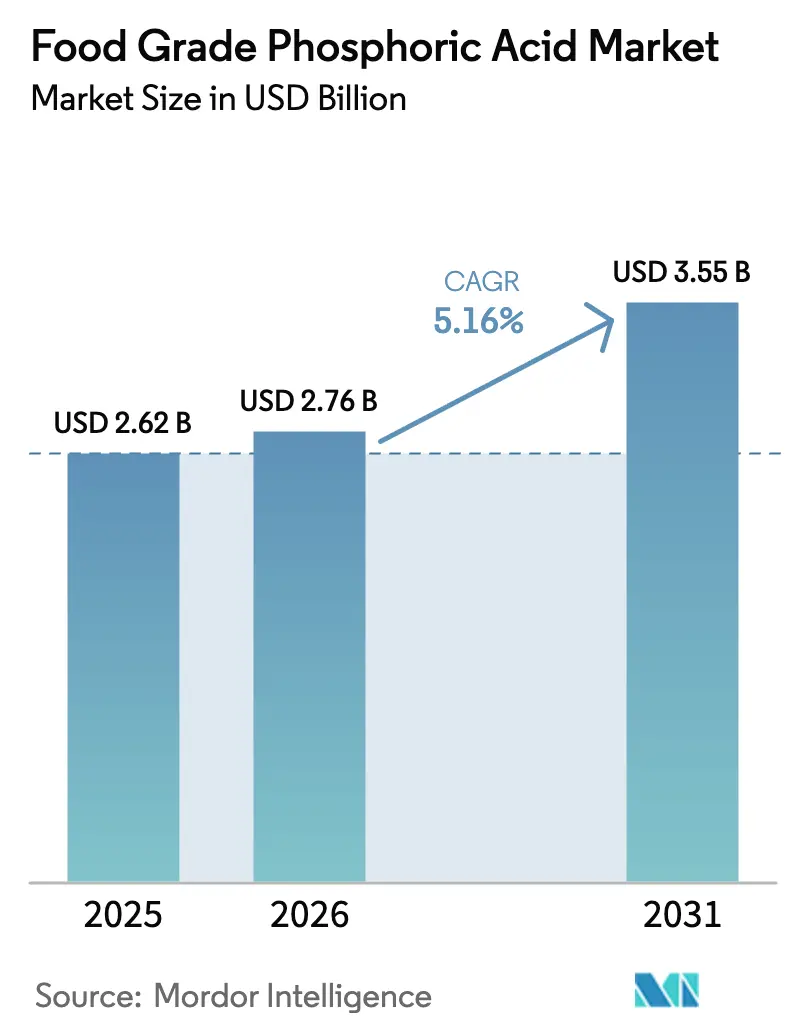
The food-grade phosphoric acid market was valued at USD 2.62 billion in 2025 and is expected to reach USD 2.76 billion in 2026, with projections indicating it will grow to USD 3.55 billion by 2031. This represents a compound annual growth rate (CAGR) of 5.16% during the forecast period from 2026 to 2031. The market's growth is driven by the continued reliance of beverage formulators on the acid's sharp flavor profile and buffering properties, while food processors benefit from its dual functionality as an emulsifier and microbial-control agent. Cola remains the largest application segment; however, the use of food-grade phosphoric acid is expanding in processed cheese, ready-to-eat meat, and shelf-stable dairy products, where alternative acidulants fail to provide the same level of pH precision. Investments in high-purity "green" production facilities in countries such as Canada, India, and Egypt indicate a willingness among brand owners to pay a premium for low-impurity grades that facilitate regulatory compliance. Concurrently, regulators in the United States and Europe are exploring phosphogypsum reuse and implementing stricter impurity limits, prompting producers to adopt cleaner wet-process production methods.
Key Report Takeaways
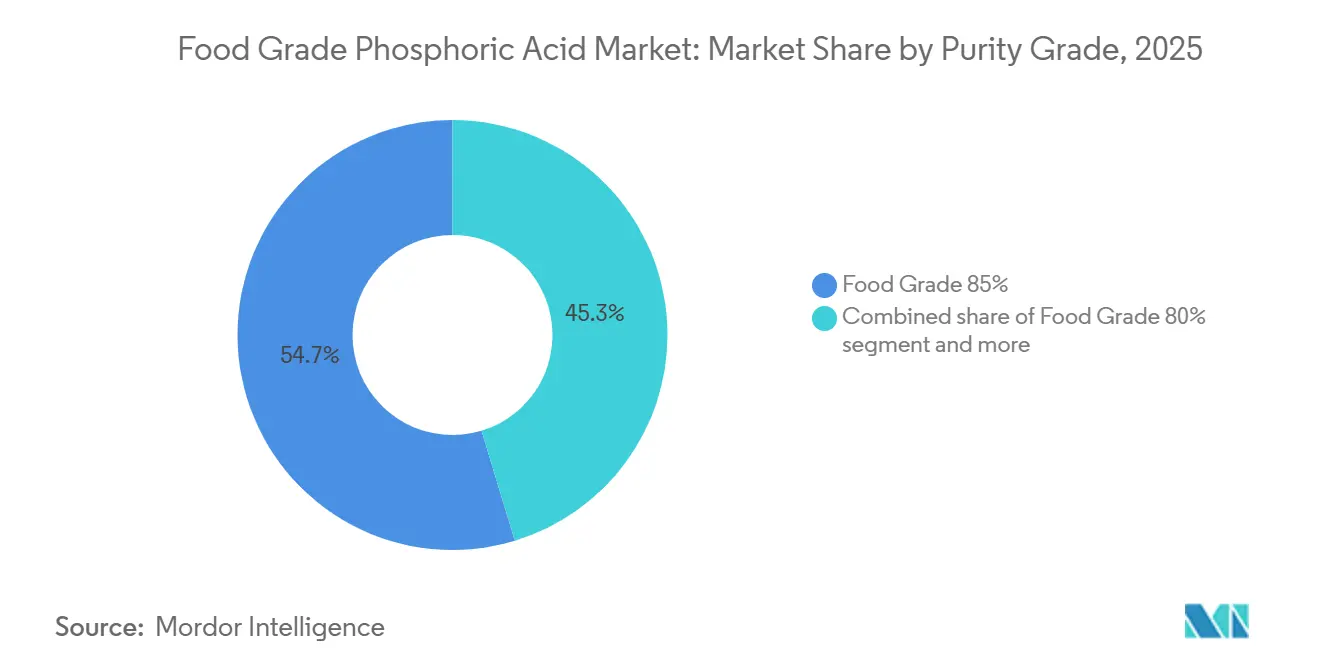
- By purity grade, food grade 85% captured 54.69% share in 2025; food grade 80% registers the fastest 5.95% CAGR to 2031.
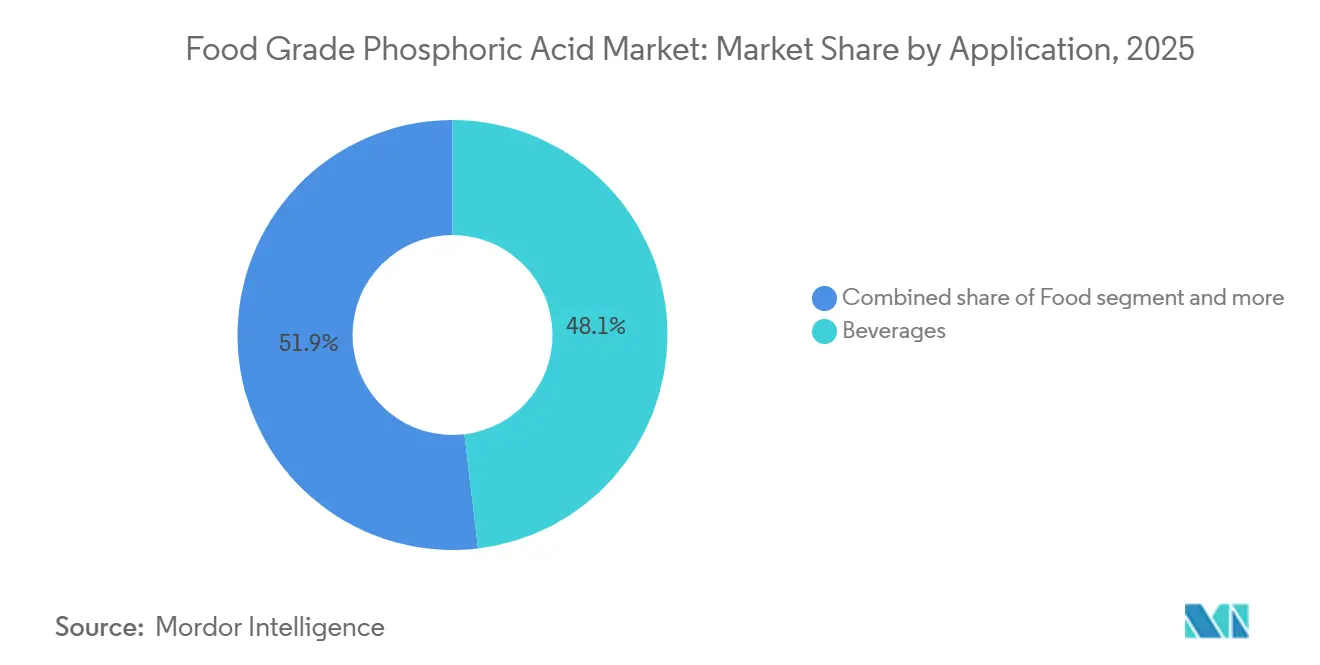
- By application, beverages led with 48.10% of food-grade phosphoric acid market share in 2025, while the food segment is projected to expand at a 6.89% CAGR through 2031.
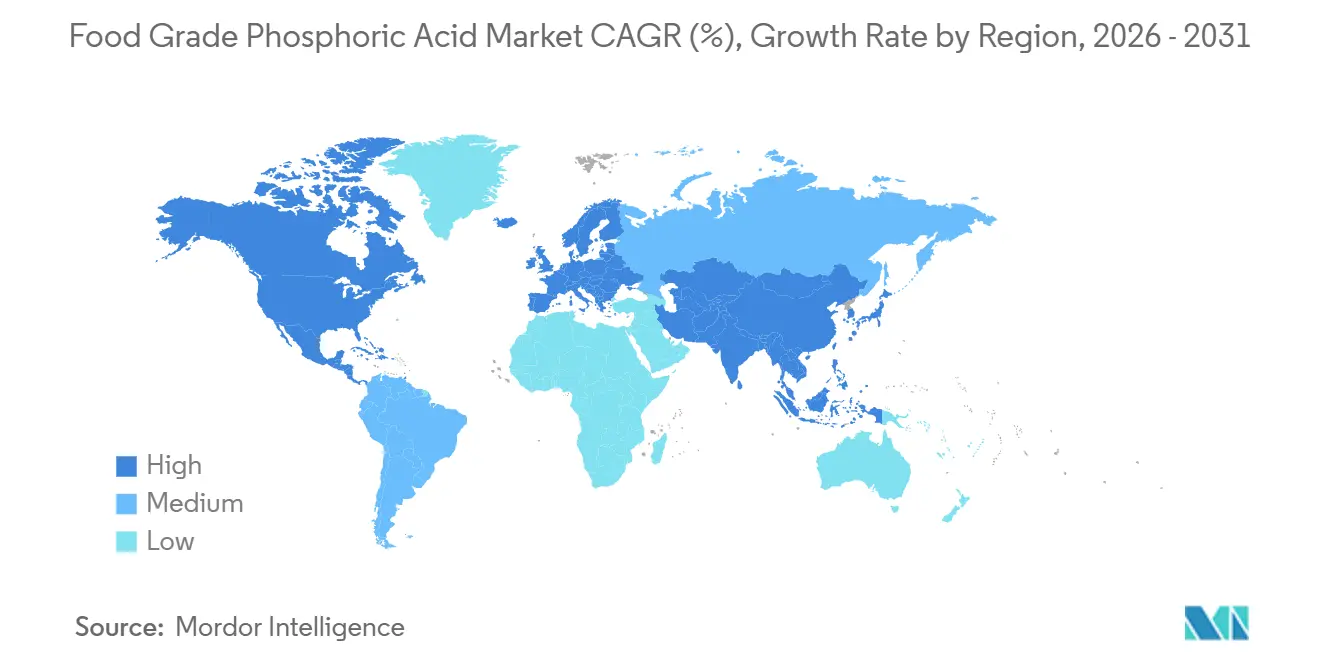
- By geography, North America accounted for 28.56% share in 2025, yet Asia-Pacific is advancing at the highest 6.18% CAGR to 2031.
Note: Market size and forecast figures in this report are generated using Mordor Intelligence’s proprietary estimation framework, updated with the latest available data and insights as of January 2026.
Market Trends and Insights
Drivers Impact Analysis of Food Grade Phosphoric Acid Market*
| Driver | (~) % Impact on CAGR Forecast | Geographic Relevance | Impact Timeline |
|---|---|---|---|
| Rising consumption of carbonated soft drinks | +0.7% | Global, with concentration in North America, Latin America, and Middle East | Medium term (2-4 years) |
| Growth in ready-to-eat and packaged foods | +0.8% | Asia-Pacific core, spill-over to Middle East and Africa | Long term (≥ 4 years) |
| Demand for multifunctional clean-label acidulants | +0.6% | North America and Europe, early adoption in urban Asia-Pacific | Short term (≤ 2 years) |
| Investments in high-purity "green" phosphoric production | +0.5% | Global, led by Europe and North America, emerging in China and India | Long term (≥ 4 years) |
| L12: Trade-policy shifts favoring regional supply security | +0.4% | Europe (anti-dumping), Asia-Pacific (import substitution), North America (nearshoring) | Medium term (2-4 years) |
| Compliance with GRAS status for food applications | +0.3% | Global, baseline requirement for market access | Short term (≤ 2 years) |
| Source: Mordor Intelligence | |||
Rising consumption of carbonated soft drinks
The rising global demand for carbonated soft drinks is a significant driver for the food-grade phosphoric acid market. Phosphoric acid is extensively used to impart tangy flavor, acidity, and preservative properties to sodas and other fizzy beverages. The increasing consumer preference for ready-to-drink and sweetened carbonated beverages, particularly in regions such as Europe and North America, continues to support the demand for high-purity, food-grade phosphoric acid. Additionally, beverage manufacturers are diversifying their product offerings to include sugar-free, flavored, and functional carbonated drinks, further boosting the reliance on phosphoric acid to ensure consistent taste and extended shelf life. Data from the British Soft Drinks Association indicates that total soft drink consumption in the United Kingdom increased to 15,707 million liters in 2024, compared to 15,443 million liters in 2023[1]. This growth underscores the enduring popularity of carbonated beverages and highlights the ongoing demand for food-grade phosphoric acid as a critical ingredient in the beverage industry.
Growth in ready-to-eat and packaged foods
The growing demand for ready-to-eat (RTE) and packaged food products is driving increased usage of food-grade phosphoric acid beyond its traditional applications in beverages. Manufacturers are utilizing phosphoric acid as a pH regulator, preservative, and emulsifying agent in items such as processed cheese, dairy-based snacks, shelf-stable meals, and processed meats. Its role in stabilizing texture, preventing fat separation, and extending shelf life is becoming increasingly important as urbanization and fast-paced lifestyles fuel consumer preference for convenient, ready-to-consume foods. In 2024, 82% of adults in the United States reported consuming ultra-processed foods, highlighting the growing reliance on packaged and convenient food options[2]. This trend is directly influencing the demand for phosphoric acid, as food processors depend on it to maintain product quality, consistency, and safety in large-scale production within the ready-to-eat and packaged food markets.
Demand for multifunctional clean-label acidulants
The growing consumer preference for natural and clean-label ingredients is driving the demand for multifunctional acidulants, such as food-grade phosphoric acid, which offer multiple benefits within a single ingredient. In the United States, 36% of consumers favor foods labeled as natural, emphasizing a focus on authenticity, traceability, and perceived health advantages[3]. Food manufacturers are addressing this trend by utilizing acidulants that not only regulate pH and enhance flavor but also serve as preservatives, stabilizers, and emulsifiers, thereby reducing reliance on synthetic additives. This multifunctionality supports the clean-label movement, allowing producers to streamline ingredient lists while ensuring product quality and shelf life, particularly in beverages, dairy products, and ready-to-eat (RTE) food categories.
Investments in high purity "green" phosphoric production
Sustainability pressures are influencing capital allocation toward wet-process purification technologies that minimize heavy-metal contamination and reduce the carbon intensity of food-grade phosphoric acid production. Traditional wet-process methods produce phosphoric acid with concentrations ranging from 30% to 54%, containing impurities such as cadmium, arsenic, and fluoride. These impurities require multi-stage purification to meet food-grade standards of ≥75% assay and arsenic levels below 3 milligrams per kilogram. First Phosphate's December 2024 licensing agreement with Prayon for a 600-tonne-per-day purified phosphoric acid plant in Canada, which employs Prayon's proprietary solvent-extraction technology, highlights the transition toward integrated, low-impurity production processes that eliminate legacy purification challenges. These investments address stricter food-safety standards and brand-owner requirements for traceability, while also reflecting a strategic expectation that premium-priced, low-carbon phosphoric acid will offer margin advantages as carbon border adjustment mechanisms expand in Europe and North America.
Restraints Impact Analysis of Food Grade Phosphoric Acid Market*
| Restraint | (~) % Impact on CAGR Forecast | Geographic Relevance | Impact Timeline |
|---|---|---|---|
| Competition from alternative acids (citric, lactic, malic) | -0.6% | Global, most intense in Europe and North America | Medium term (2-4 years) |
| Health concerns from excessive consumption | -0.5% | North America and Europe, emerging in urban Asia-Pacific | Long term (≥ 4 years) |
| Stringent regulatory restrictions on allowable concentrations | -0.3% | Global, led by FDA and EFSA frameworks | Short term (≤ 2 years) |
| Stringent effluent and phosphogypsum regulations | -0.4% | North America and Europe, tightening in China and India | Medium term (2-4 years) |
| Source: Mordor Intelligence | |||
Competition from alternative acids (citric, lactic, malic)
Citric, lactic, and malic acids are gaining market share in applications where the sharp acidity and mineral aftertaste of phosphoric acid are less critical. These include fruit-flavored beverages, sports drinks, and organic food products. Citric acid, produced through fermentation and perceived as a natural ingredient, is the preferred acidulant for clean-label reformulations. Lactic acid, with its dual functionality as an acidulant and antimicrobial agent, is increasingly used in meat and dairy preservation. Malic acid, although more expensive, is being adopted in premium beverage lines due to its smoother acidity profile and ability to enhance fruit-forward flavors, particularly in sparkling waters and functional drinks aimed at health-conscious consumers. The competitive challenge is most pronounced in Europe and North America, where regulatory standards and consumer preferences favor natural acids. However, phosphoric acid maintains advantages in cola and certain dairy applications due to its unique chemistry, particularly its ability to complex with calcium ions without causing precipitation, which remains difficult to replicate.
Health concerns from excessive consumption
Epidemiological studies linking phosphoric acid consumption to health issues, such as bone density loss, kidney stone formation, and dental erosion, are limiting demand growth in developed markets and influencing global regulatory discussions. This constraint affects the market in two ways: directly, by reducing volumes as consumers shift to citric acid-based alternatives, and indirectly, by exerting margin pressure as beverage manufacturers reformulate premium product lines to avoid negative health perceptions. Consequently, phosphoric acid is increasingly confined to value-tier products with lower pricing power. The impact is most significant in North America and Europe, where health awareness is high. However, similar reformulation trends are emerging in urban areas of China and India, driven by middle-class consumers prioritizing wellness attributes.
*Our forecasts treat driver/restraint impacts as directional, not additive. The impact forecasts reflect baseline growth, mix effects, and variable interactions.
Food Grade Phosphoric Acid Market Segment Analysis
By Purity Grade:
Concentration Drives Application FitFood grade 85% phosphoric acid accounted for 54.69% of the market share in 2025, highlighting its role as the standard concentration for applications such as cola syrup production, processed cheese emulsification, and precise pH adjustment in pharmaceutical-grade food ingredients. This concentration offers a balance between handling efficiency, where higher concentrations reduce shipping costs per unit of active ingredient, and formulation flexibility, as it can be diluted on-site to meet specific application needs without requiring specialized storage facilities.
Food grade 80% phosphoric acid is projected to be the fastest-growing segment, with a CAGR of 5.95% through 2031. This growth is driven by its adoption in cost-sensitive markets, where the 5-percentage-point difference in concentration provides cost savings while maintaining functionality in less demanding applications, such as pH adjustment in processed meats and certain dairy desserts. Regulatory oversight from organizations like the FDA and EFSA ensures that competition in purity grades focuses on meeting or exceeding minimum standards rather than pursuing ultra-high concentrations. This dynamic benefits established producers with advanced purification capabilities over low-cost entrants relying on minimal processing.

By Application:
Beverages Dominate, Food AcceleratesBeverages accounted for 48.10% of the market share in 2025, driven by cola's continued reliance on phosphoric acid for its distinct flavor profile. However, the food segment is projected to grow at a compound annual growth rate (CAGR) of 6.89% through 2031, surpassing beverages due to the increasing use of phosphoric acid in dairy, processed meat, and ready-to-eat meal applications, particularly in Asia-Pacific and Africa. Within the beverage segment, cola represents the majority of phosphoric acid usage, with typical formulations containing 0.05% to 0.08% phosphoric acid by volume to maintain pH levels between 2.4 and 2.6.
This range ensures microbial stability while preserving palatability. However, health-conscious reformulations are limiting growth in the beverage segment, as premium brands shift to citric or malic acids to avoid negative health perceptions. As a result, phosphoric acid usage remains concentrated in value-tier cola and traditional formulations. The "Other Applications" category, which includes fats, shortenings, and jellies, is experiencing modest growth as phosphoric acid's antioxidant properties are utilized to prevent rancidity in lipid-rich formulations.
Geography Analysis
North America Food Grade Phosphoric Acid Market
North America accounted for 28.56% of the market share in 2025, supported by the United States' extensive wet-process phosphoric acid infrastructure and established cola consumption patterns. However, the region's growth is slowing due to health-conscious reformulations and the substitution of alternative acids, which are reducing demand for beverage-grade phosphoric acid. Canada is emerging as a niche player in high-purity production. In December 2024, First Phosphate licensed Prayon technology for a 600-tonne-per-day plant aimed at premium food-grade markets. This initiative leverages Canada's low-carbon electricity grid to produce "green" phosphoric acid with a distinct sustainability profile.
APAC Food Grade Phosphoric Acid Market
The Asia-Pacific region is the fastest-growing market, with a CAGR of 6.18% projected through 2031. Growth is driven by the simultaneous expansion of domestic production capacity in China and India, alongside increasing demand for packaged foods and beverages. Japan and South Korea represent mature, high-value markets where stringent food safety standards favor imports from established producers. However, local demand in these countries is constrained by aging populations and declining per-capita beverage consumption. In Australia, the market remains import-dependent due to the absence of significant domestic phosphoric acid production. Nevertheless, Australia's role as a major phosphate rock exporter to Asia-Pacific presents opportunities for downstream integration if regional demand justifies investment.
Europe and South America Food Grade Phosphoric Acid Market
Europe's market is influenced by stringent environmental regulations and health-driven reformulations. The European Food Safety Authority's quantum satis designation for phosphoric acid (E338) provides regulatory flexibility, but consumer preferences are increasingly shifting toward citric and lactic acids in premium product lines. South America's market is primarily supported by Brazil's large beverage industry and Argentina's processed food sector. However, both countries rely heavily on imports from Morocco and the United States due to limited domestic phosphoric acid production capacity.
Regulatory Landscape
Food-grade phosphoric acid is regulated globally as a permitted food additive, commonly referenced as INS 338 (Codex) and E 338 (EU), with functional roles including acidity regulation and sequestration. In the United States, it is listed as Generally Recognized as Safe (GRAS) for use in food in accordance with good manufacturing practice under 21 CFR 182.1073 and 21 CFR 582.1073, and it also appears in FDA food-substance listings for multiple technical effects including pH control.
In the European Union, phosphoric acid and phosphates (E 338 to E 452) fall under Regulation (EC) No 1333/2008, with additive permissions subject to periodic re-evaluation under the EU additives program. Internationally, JECFA specifications and monographs remain a key compliance anchor for purity and contaminant limits, and JECFA has established a group maximum tolerable daily intake of 70 mg/kg body weight (expressed as phosphorus) for phosphoric acid and related phosphate compounds, keeping impurity management central to cross-border food-grade specifications.
Value Chain Analysis
The value chain starts with phosphate rock sourcing by resource owners and integrated producers, then conversion to wet-process phosphoric acid and purification to food grade using multi-stage, capital-intensive operations (commonly solvent extraction) to reduce impurities such as heavy metals and fluoride. Processing routes and quality-control intensity are shaped by food additive specifications, including JECFA monographs and Food Chemicals Codex requirements, which in turn makes assay and contaminant performance a practical differentiator between commodity-grade acid and food-grade 75% to 85% products.
Downstream, food-grade phosphoric acid is typically handled through integrated chemical hubs and specialized distributors that support bulk logistics, repackaging, and documentation before supply reaches beverage formulators (notably cola syrups) and food processors. These end users rely on it for pH control, emulsification, and microbial management. Upstream-to-midstream capacity anchored by firms such as OCP, Mosaic, ICL, and Ma'aden is complemented by supplier qualification driven by traceability, consistent purity certification, and regional supply positioning to reduce lead times and import dependence in high-consumption markets.
Competitive Landscape
The food-grade phosphoric acid market is moderately consolidated, with a few vertically integrated phosphate producers, Mosaic, OCP, ICL, and Ma'aden, dominating significant wet-process capacity. These companies leverage their scale and integration to maintain a stronghold in the market. However, regional specialists and toll manufacturers continue to carve out competitive niches, particularly in high-purity and specialty-grade segments. This balance between large-scale producers and regional players creates a dynamic market environment where innovation and specialization play critical roles in maintaining competitiveness. Patent activity in the market underscores a focus on improving wet-process efficiency and reducing impurities, with notable advancements such as Ecophos' U.S. Patent 8,425,872 B2. This patent details methods for producing high-purity phosphoric acid from low-grade phosphate rock, a process that not only reduces feedstock costs but also meets stringent food safety standards, highlighting the industry's emphasis on cost efficiency and regulatory compliance.
Emerging disruptors in the market include regional producers in India and Southeast Asia, who are increasingly investing in food-grade production capacity. These investments aim to address growing import-substitution demand in their respective regions, enabling these producers to reduce reliance on imports while catering to local markets. This shift is creating competitive pressure on established exporters, who are now compelled to differentiate themselves through enhanced service offerings, traceability, and technical support rather than relying solely on price competitiveness. The entry of these regional players is reshaping the competitive landscape, as they bring localized expertise and cost advantages to the market, challenging the dominance of traditional exporters and encouraging innovation across the supply chain.
The competitive intensity is particularly high in commodity-grade concentrations of 75% to 80%, where Chinese exports exert significant downward pressure on prices. This segment is characterized by price sensitivity and high-volume demand, making it a challenging space for producers to maintain margins. In contrast, premium-grade 85% and ultra-high-purity segments remain relatively insulated from such pressures due to technical barriers and stringent brand-owner qualification processes. These segments favor incumbents with established track records and proven expertise, as customers prioritize quality, reliability, and compliance with strict standards. As a result, producers in these premium segments benefit from higher margins and long-term customer relationships, reinforcing their position in the market despite the competitive challenges in lower-grade segments.
Food Grade Phosphoric Acid Industry Leaders
-
Brenntag AG
-
OCP SA
-
Guangxi Qinzhou Capital Success Chemical Co. Ltd
-
Aditya Birla Group
-
Innophos Holdings Inc.
- *Disclaimer: Major Players sorted in no particular order
Food Grade Phosphoric Acid Market Companies Covered in this Report
- Aditya Birla Group (Grasim Industries)
- Arkema S.A.
- Brenntag SE
- Guangxi Qinzhou Capital Success Chemical Co., Ltd.
- EuroChem Group AG
- Guizhou U-Share Materials Co. Ltd.
- ICL Group Ltd.
- Innophos Holdings Inc.
- Israel Chemicals Ltd.
- Jordan Phosphate Mines Co.
- LANXESS AG
- Ma’aden
- Merck KGaA
- Mosaic Co.
- Nutrien Ltd.
- OCP S.A.
- Prayon S.A.
- Solvay S.A.
- Spectrum Chemical Mfg. Corp.
- Vinipul Inorganics Pvt. Ltd.
Market Opportunities and Future Outlook
Premiumization around low-impurity and traceable supply remains a consistent opportunity as buyers tighten expectations on contaminant control and prioritize consistent pH precision in beverages, dairy emulsification, and processed foods. Investment signals continue to point to additional upstream and intermediate acids that feed downstream purification capacity. For example, in February 2026, Indo-Jordan Chemicals Company signed a USD 193 million contract with East China Engineering Science and Technology Company for a sulfuric acid plant in Shidiya, linked to increasing phosphoric acid capacity from 330,000 tonnes to 550,000 tonnes annually and expanding the pool of acid available for conversion into higher-value grades.
Import-substitution and regional supply security programs also create openings for producers and distributors that can qualify food-grade material under GRAS and the EU E338 framework, backed by documentation aligned with JECFA and FCC specifications. In India, Rashtriya Chemicals and Fertilizers Ltd received board approval in February 2026 to build a 300 tonne/day phosphoric acid plant at its Thal unit (estimated at USD 95.36 million), which can shorten supply chains for domestic food and beverage manufacturers. Together with earlier moves toward higher-purity production technology, such as the Prayon-licensed purification capacity in Canada, these projects support opportunities for toll purification, certified repackaging, and long-term supply arrangements where supplier selection is tied to qualification and audit readiness.
Recent Industry Developments in Food Grade Phosphoric Acid Market
- February 2026: Rashtriya Chemicals and Fertilizers Ltd (RCF) received board approval to build a 300 tonne/day phosphoric acid plant at its Thal unit in Maharashtra, India, with an estimated investment of about USD 95.36 million. The project strengthens domestic availability of phosphoric acid feedstock that can be upgraded into food-grade material, supporting shorter lead times for food and beverage users and creating additional nodes for purification and distribution partnerships.
- November 2025: Prayon inaugurated a new sodium hexametaphosphate (SHMP) production unit at its Engis site in Belgium, adding 10,000 tonnes per year of capacity following an investment exceeding EUR 30 million. The expansion increases Prayon's output of a key phosphate derivative used across food and beverage applications, reinforcing its scale position in purified phosphate chemistries and supporting integrated supply offerings to ingredient customers.
- December 2024: First Phosphate signed a licensing agreement with Prayon for a 600-tonne-per-day purified phosphoric acid plant in Canada using Prayon solvent-extraction technology. The move accelerates deployment of purification capability designed for low-impurity output, aligning with tighter customer qualification requirements for food-grade applications and supporting differentiation around traceability and cleaner production routes.
Food Grade Phosphoric Acid Market Report Scope and Research Methodology
Market Definition and Coverage
This market covers food grade phosphoric acid sold for use in food, beverage, and closely related formulation needs where food contact and impurity limits apply. Our sizing is value-based and reflects revenue from sales of food grade material across major consuming regions.
Scope exclusions: Excludes fertilizer-grade and industrial-grade phosphoric acid, as well as downstream finished food and beverage product sales.
Segments Covered in This Report
- By Purity Grade
- Food Grade 85%
- Food Grade 75%
- Food Grade 80%
- Others
- By Application
- Food
- Dairy Products
- Processed Meat
- Others
- Beverages
- Other Applications
- Food
- By Geography
- North America
- United States
- Canada
- Mexico
- Rest of North America
- Europe
- Germany
- United Kingdom
- France
- Italy
- Spain
- Rest of Europe
- Asia-Pacific
- China
- Japan
- India
- South Korea
- Australia
- Rest of Asia-Pacific
- South America
- Brazil
- Argentina
- Rest of South America
- Middle East and Africa
- Saudi Arabia
- United Arab Emirates
- South Africa
- Rest of Middle East and Africa
- North America
Data Sources, Market Sizing, and Validation
Desk Research
Desk research was used to build the basic supply and demand context for phosphates and acidulants, and then narrow it to food grade use. We typically rely on public sources such as USGS mineral statistics, UN Comtrade trade flows, FAOSTAT food processing indicators, US FDA food additive and safety references, and EFSA publications on contaminants and limits to understand where food grade specifications matter.
We also reviewed annual reports and investor presentations of major phosphate and specialty chemical producers, association updates on food ingredients, and reputable business press to track capacity changes, plant outages, and price direction. Where needed, we used paid database subscriptions for company financials, patents, and shipment-level import and export checks to reduce gaps in smaller markets and keep assumptions consistent across regions. These desk sources are illustrative, and many other references were also used during data collection, validation, and clarification.
Primary Interviews and Surveys
Primary work focused on confirming how demand forms in beverages and processed foods, and how buyers specify concentration and impurity limits (for example, 75%, 80%, and 85% food grade). We spoke with manufacturers, distributors, and large end users across key consuming regions so the pricing logic, trade substitution behavior, and application shares could be stress-tested against a realistic purchase pattern.
Distribution of primary research fieldwork respondents
| Company type | Respondent position | Region |
|---|---|---|
| Top tier: 27% | CXOs: 12% | APAC: 49% |
| Mid tier: 52% | Functional/Unit leaders: 34% | EMEA: 30% |
| Smaller Players: 21% | Managers: 54% | Americas: 21% |
Market-Sizing & Forecasting
Market size was constructed using a top-down and bottom-up mix, where production and trade data for phosphoric acid and phosphate intermediates are filtered into a food grade demand pool using application-level usage and specification checks. Once that demand pool was formed, it was converted into value using region-specific pricing bands. These bands were adjusted for typical concentration (75%, 80%, 85%) and channel mix.
To keep the model grounded, totals were corroborated through selective bottom-up approximations, such as rolling up sampled supplier revenues where disclosures exist, checking distributor throughput ranges, and validating an ASP x estimated consumption volume for beverage-led demand. Key inputs used as model drivers included carbonated soft drink production trends, processed food output indicators, import dependence by region, typical price spreads between food grade and non-food grades, and the pace of regulatory tightening on impurities that can shift buyers toward higher-quality supply.
For forecasting, we used scenario analysis supported by regression checks on beverage and processed food indicators, followed by expert-led adjustments for expected price cycles and capacity changes. Where country-level data was thin, gaps were handled by proxying from trade shares, known beverage intensity, and validated regional consumption ratios. We then rechecked those proxies in interviews for reasonableness.
Data Validation & Update Cycle
Before finalizing results, outputs are cross-checked against independent signals, including trade balances, reported operating rates, and visible price direction in key regions, then variances are reviewed to identify what is driving the gap. When a number looks off, assumptions are re-tested and, if needed, select respondents are re-contacted to confirm whether the change is due to demand, pricing, or substitution between grades.
Each dataset and calculation goes through multi-step analyst review, followed by a final sign-off pass focused on outliers across applications and geographies. Reports are refreshed annually, and interim updates are completed when material events occur, such as major capacity additions, sustained raw material cost shocks, or sharp demand changes in beverages. Right before delivery, a fresh review is run so clients receive the most current view available.
Mordor Intelligence's Food Grade Phosphoric Acid Market Size Versus Other Published Estimates
Published market sizes for food grade phosphoric acid can differ even when the topic looks similar on the surface, because the definition of food grade is not treated the same way across sources. Differences also come from how each estimate converts volume to value, how it handles concentration mixes, and how often assumptions are refreshed when prices and trade flows move.
The biggest gap drivers in this market usually relate to what is counted as in-scope applications and grades, and whether adjacent uses like metal treatment within food plants or broader phosphate ingredient baskets are blended into the total. Another common cause is pricing logic, where some models use a single global average price, while others apply region-specific price bands and different currency timing. That can swing the reported USD value in years with volatility.
Benchmark comparison
| Source | Market Size | Gaps in Research Methodology |
|---|---|---|
| Mordor Intelligence | USD 2.62 B (2025) | |
| Global Consultancy A | USD 2.67 B (2025) | Uses a broader application lens that groups pharmaceutical use alongside food and beverage demand, and it appears to rely on a smoother global pricing curve with fewer region-level price resets. |
| Industry Publisher B | USD 2.60 B (2025) | Includes extra end uses like metal treatment and sugar refining as named applications, which can shift the split across uses, and it may apply a different concentration mix assumption when converting consumption to value. |
The table shows a tight range around the 2025 value, and the small spread is mainly explained by what gets counted beyond core food and beverage use, plus how concentration and pricing are handled. In Mordor Intelligence's model, the value is tied to food grade sales with concentration-specific pricing and region-based trade checks, which reduces drift when price and import patterns change.
Key Questions Answered in the Report
What is the projected value of the food-grade phosphoric acid market in 2031?
The market is expected to reach USD 3.55 billion by 2031.
Which application currently dominates demand?
Beverages, primarily cola formulations, held 48.10% share in 2025.
Which region will grow fastest through 2031?
Asia-Pacific is forecast to post a 6.18% CAGR, supported by capacity additions in China and India.
Why is Food Grade 85% important?
It combines high assay with versatility, delivering 54.69% market share in 2025 and meeting stringent impurity limits.