
Market Overview
| Study Period | 2021 - 2031 |
|---|---|
| Market Size (2026) | USD 112.92 Billion |
| Market Size (2031) | USD 180.97 Billion |
| Growth Rate (2026 - 2031) | 9.89 % |
| Fastest Growing Market | Asia Pacific |
| Largest Market | North America |
| Market Concentration | Low |
Major Players *Disclaimer: Major Players sorted in no particular order Image © Mordor Intelligence. Reuse requires attribution under CC BY 4.0. | |
Food Fortifying Agents Market Analysis by Mordor Intelligence
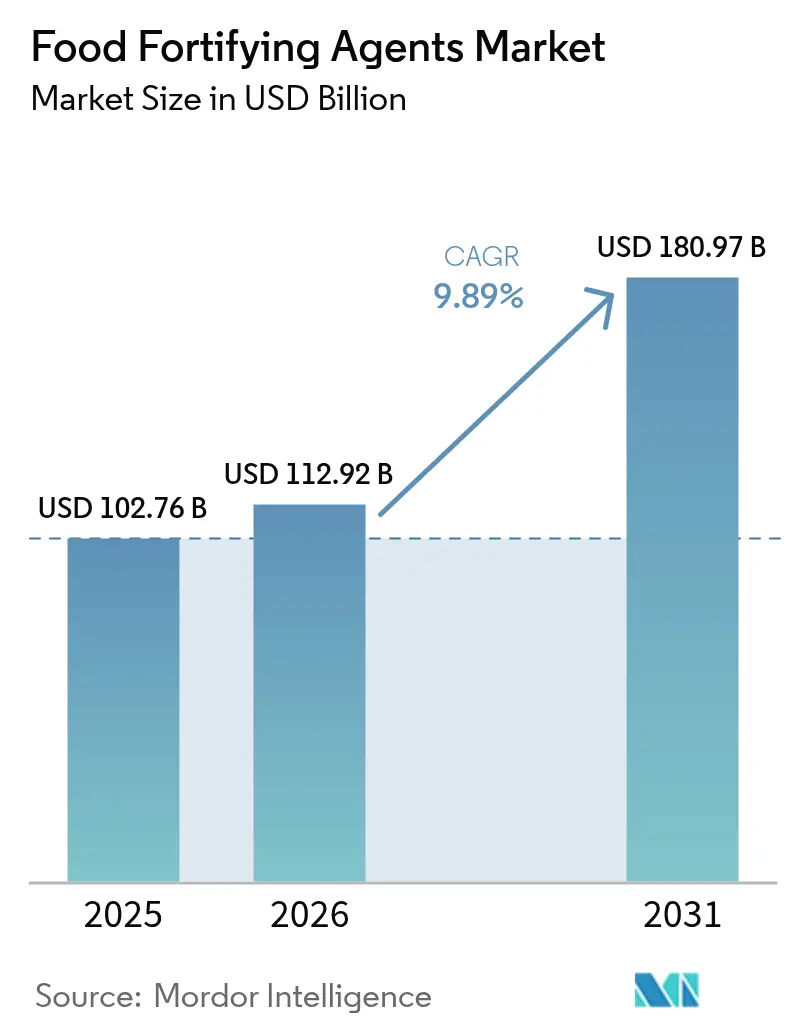
The food fortifying agents market size in 2026 is estimated at USD 112.92 billion, growing from 2025 value of USD 102.76 billion with 2031 projections showing USD 180.97 billion, growing at 9.89% CAGR over 2026-2031. The market growth is driven by rising micronutrient deficiencies globally, especially in developing regions with persistent nutritional gaps. Mandatory fortification regulations in various countries and increasing consumer demand for nutritionally enhanced functional foods support market expansion. The consolidation of ingredient manufacturers has improved operational efficiency and reduced production costs. Advancements in precision fermentation and microencapsulation technologies have enhanced nutrient stability and bioavailability in fortified products. In January, 2025 FDA proposed front-of-package labeling regulations that are shaping product development strategies and fortification processes. Market dynamics differ by region, with North American demand driven by health-conscious consumers, while Asia-Pacific experiences rapid growth through government food fortification programs addressing nutritional deficiencies.
Key Report Takeaways
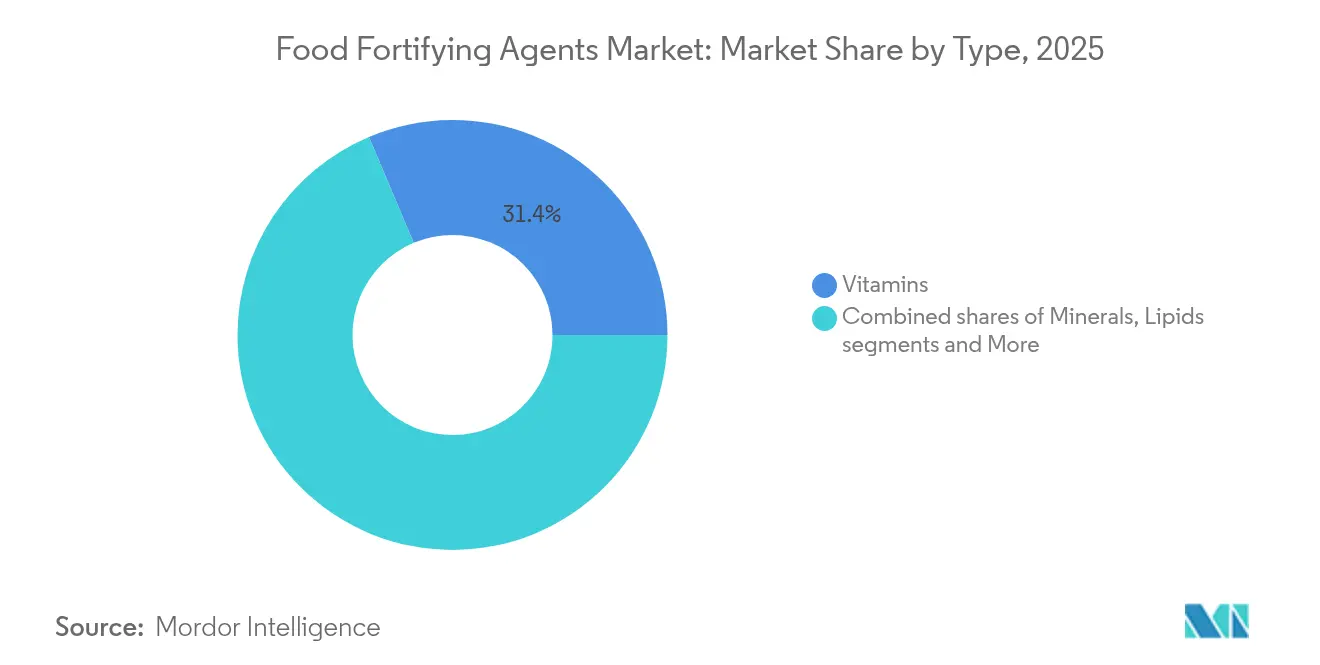
- By type, vitamins led with 31.35% revenue share in 2025, whereas prebiotics and probiotics are advancing at a 12.11% CAGR through 2031.
- By application, dairy and dairy-based products captured 30.10% of the food fortifying agents market share in 2025; beverages recorded the fastest expansion at 12.74% CAGR through 2031.
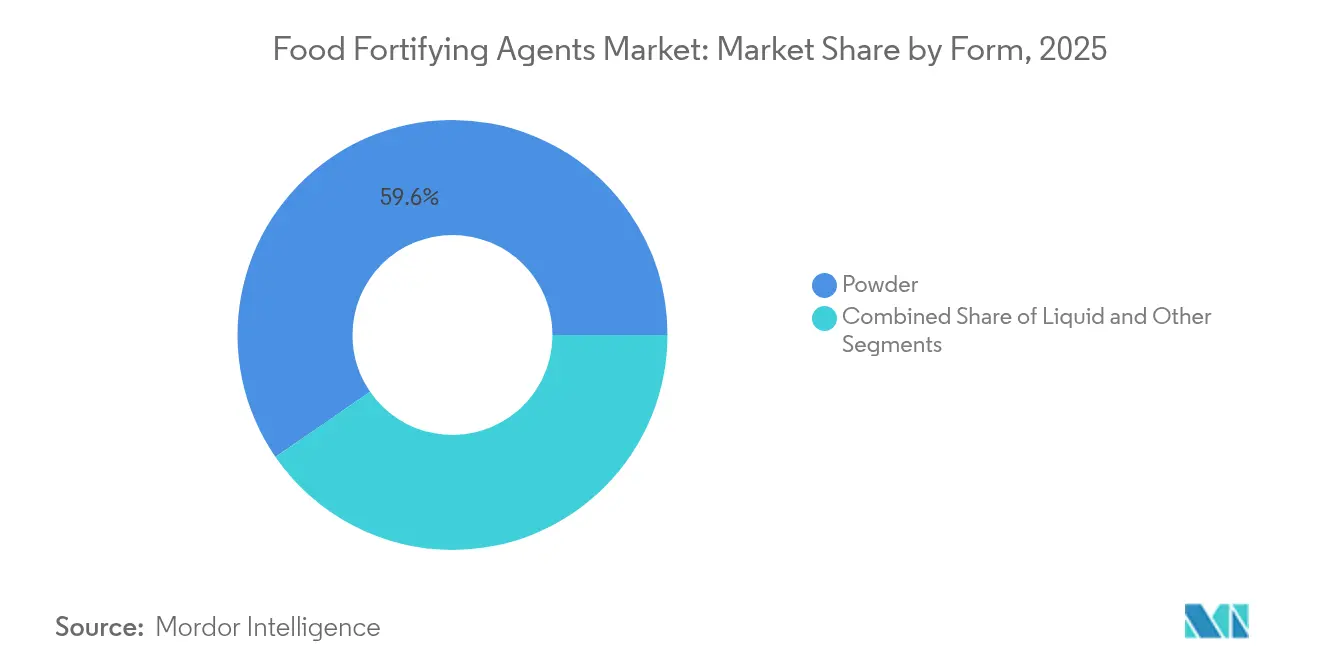
- By form, powder formulations commanded 59.60% of the 2025 food fortifying agents market size, while liquid formats grew at 12.22% CAGR on superior bioavailability.
- By geography, North America held 32.60% of 2025 revenue; Asia-Pacific is set to grow the fastest at 11.95% CAGR to 2031.
Note: Market size and forecast figures in this report are generated using Mordor Intelligence’s proprietary estimation framework, updated with the latest available data and insights as of 2026.
Market Trends and Insights
Drivers Impact Analysis of Food Fortifying Agents Market*
| DRIVER | (~) % IMPACT ON CAGR FORECAST | GEOGRAPHIC RELEVANCE | IMPACT TIMELINE |
|---|---|---|---|
| Increasing prevalence of micronutrient deficiencies | +2.8% | Global, with highest impact in Asia-Pacific and Sub-Saharan Africa | Long term (≥ 4 years) |
| Expansion of mandatory fortification regulations | +2.1% | Global, with early adoption in North America and Europe, expanding to Asia-Pacific | Medium term (2-4 years) |
| Growing consumer demand for functional and fortified foods | +1.9% | North America and Europe core, spill-over to urban Asia-Pacific centers | Medium term (2-4 years) |
| Rising need for fortified foods in child and maternal nutrition programs | +1.6% | Asia-Pacific, Sub-Saharan Africa, Latin America | Long term (≥ 4 years) |
| Increased fortification of staple foods in developing economies | +1.4% | Asia-Pacific, Sub-Saharan Africa, with focus on India, China, Nigeria | Long term (≥ 4 years) |
| Advancements in fortification technologies | +1.2% | Global, with research and development centers in North America and Europe | Short term (≤ 2 years) |
| Source: Mordor Intelligence | |||
Increasing prevalence of micronutrient deficiencies
The global micronutrient deficiency crisis continues to grow, with populations worldwide experiencing inadequate intake of essential nutrients. Iron, vitamin A, and iodine deficiencies are most prevalent, particularly affecting children and pregnant women, with low- and middle-income countries facing the highest burden. According to the World Health Organization, 30.7% of women aged 15-49 years suffered from anaemia in 2023, highlighting the persistent need for fortification programs.[1] The economic impact of these deficiencies, including reduced productivity and increased healthcare costs, has prompted governments to implement large-scale fortification as a cost-effective health intervention. As staple foods serve as the primary nutrient delivery vehicle for vulnerable populations, ingredient suppliers that meet public-sector procurement standards can secure substantial contract volumes. The significant economic burden of micronutrient deficiencies on developing countries has made food fortification a priority public health initiative.
Expansion of mandatory fortification regulations
Many countries have implemented mandatory fortification programs to address widespread nutrient deficiencies. These initiatives, particularly in developing regions, require food manufacturers to incorporate fortifying agents into staple foods, increasing the demand for fortified products across various demographic segments. In March 2025, Tanzania introduced comprehensive regulations mandating all flour millers to fortify their products with essential vitamins and minerals by December 2025. The Ministry of Health, supported by partners like Sanku, launched this initiative to improve nutrition access and combat malnutrition in vulnerable populations. Similarly, Mauritius enacted mandatory wheat flour fortification legislation in 2023 to address micronutrient deficiencies, particularly iron deficiency anemia, which affects a significant portion of its population. This legislation resulted from extensive collaboration between the Government of Mauritius, FFI, the Food and Agriculture Organization of the United Nations (FAO), and the Southern African Development Community (SADC).[2] These mandatory fortification requirements are driving the substantial growth of food fortifying agents in the global market.
Growing consumer demand for functional and fortified foods
The increasing consumer understanding of diet's role in maintaining health drives growth in the fortified foods category. This shift aligns with the broader trend toward preventive healthcare through nutrition. According to the IFIC Food and Health Survey 2024, protein consumption awareness among U.S. consumers has steadily increased from 59% in 2022 to 67% in 2023, reaching 71% in 2024.[3]Moreover, plant-based fortified products continue to gain market share among flexitarian consumers, while clean-label claims strengthen consumer trust in food fortifying agents. The market demonstrates significant innovation in functional beverages containing vitamins, minerals, and gut-health ingredients, offering convenient nutrition solutions for urban consumers. Meal replacement beverages with comprehensive vitamin and mineral profiles address busy lifestyles and nutritional needs. Consumer willingness to pay premium prices for fortified products, especially those with proven health claims and transparent ingredient sourcing, indicates a clear premiumization trend. Advanced delivery technologies, including liposomal encapsulation, improve nutrient absorption and support higher price points.
Rising need for fortified foods in child and maternal nutrition programs
Government feeding programs are expanding the use of nutrient-enriched staple foods to address malnutrition in early childhood. Through targeted interventions and comprehensive nutrition strategies, these programs aim to improve health outcomes in vulnerable populations. The Mission Poshan 2.0, a flagship program of the Government of India, addresses malnutrition challenges and promotes improved health, wellness, and immunity through community engagement, outreach, behavioral change, and advocacy. The scheme focuses on maternal nutrition, infant and young child feeding norms, treatment of Severe Acute Malnutrition (SAM)/Moderate Acute Malnutrition (MAM), and anemia. It implements a multi-faceted approach, incorporating dietary modifications and nutritional education alongside fortification efforts.[4] These contracts include performance metrics and quality assurance protocols to maintain consistent fortification standards. Moreover, in May 2023, delegates at the Seventy-sixth World Health Assembly adopted a resolution to accelerate efforts to prevent micronutrient deficiencies through safe and effective food fortification.[5] The resolution urges Member States to make decisions on food fortification with micronutrients and supplementation while considering ways to strengthen financing and monitoring mechanisms.
Restraints Impact Analysis of Food Fortifying Agents Market*
| RESTRAINT | (~) % IMPACT ON CAGR FORECAST | GEOGRAPHIC RELEVANCE | IMPACT TIMELINE |
|---|---|---|---|
| High costs of fortification ingredients and processes | -1.8% | Global, with highest impact in price-sensitive developing markets | Short term (≤ 2 years) |
| Low awareness of fortified foods in rural and underserved | -1.2% | Rural areas in Asia-Pacific, Sub-Saharan Africa, Latin America | Medium term (2-4 years) |
| Lack of specialized equipment and skilled workforce | -0.9% | Developing economies, particularly small-scale manufacturers | Medium term (2-4 years) |
| Inconsistent quality and standardization among ingredient | -0.7% | Global, with concentration in emerging supplier markets | Short term (≤ 2 years) |
| Source: Mordor Intelligence | |||
High costs of fortification ingredients and processes
Supply chain disruptions and production constraints are causing significant cost increases across vitamin categories, with vitamin A and carotenoids facing severe price pressures due to production facility incidents. A fire at BASF's plant in Ludwigshafen, Germany, in late July 2024, resulted in a force majeure declaration for specific vitamin and aroma ingredient products. The incident, which occurred at a facility manufacturing vitamin A, vitamin E, carotenoid precursors, and aroma ingredients, led to a production shutdown and supply disruptions. BASF estimated production of vitamins A and E, and carotenoids will not resume until early 2025, creating potential shortages in the global vitamin supply chain. Small food manufacturers face financial pressure from capital requirements for blending, dosing, and quality-control equipment, which often requires substantial initial investment and ongoing maintenance costs.
Low awareness of fortified foods in rural and underserved regions
Limited consumer education and traditional dietary habits restrict the reach of voluntary programs in rural markets. High logistics costs from distribution challenges, including poor road infrastructure, inadequate storage facilities, and unreliable transportation networks, discourage market entry, even with regulatory support. While health workers and extension agents are essential for community engagement, gaps in their training, resources, and deployment remain widespread across rural regions. Traditional marketing channels are less effective in areas with limited media access, requiring direct outreach through village fairs, school demonstrations, door-to-door campaigns, and community meetings. Success in these markets depends on culturally appropriate communication strategies, comprehensive stakeholder engagement, and substantial joint investments in rural supply-chain infrastructure development.
*Our forecasts treat driver/restraint impacts as directional, not additive. The impact forecasts reflect baseline growth, mix effects, and variable interactions.
Food Fortifying Agents Market Segment Analysis
By Type:
Vitamins Lead While Probiotics Drive InnovationVitamins held the dominant position in the market with a 31.35% share in 2025, driven by established regulatory frameworks and economical premix solutions. The vitamin segment is expected to grow consistently, supported by mandatory fortification requirements for flour, rice, and oil. Prebiotics and probiotics are experiencing rapid growth at a 12.11% CAGR, supported by research demonstrating the relationship between gut microbiome balance, immune function, and metabolic health. Manufacturers are implementing microencapsulation technology to achieve 85-86% viability under thermal and acidic conditions, enhancing stability in shelf-stable beverages. The protein and amino acid segment benefits from growth in sports nutrition, while omega-3 lipids contribute cardiovascular benefits to conventional food products. Minerals, particularly iron and zinc, remain crucial for public health programs targeting anemia and growth deficiency.
The market demonstrates ongoing innovation in delivery systems. Carbohydrates are gaining renewed interest through prebiotic fiber additions, responding to increased consumer interest in digestive health. The "others" category includes emerging compounds such as polyphenols and plant-based proteins, creating opportunities for specialized manufacturers. The anticipated streamlining of probiotic strain registration and postbiotic approval processes is expected to transform market competition and increase formulation requirements in the food fortifying agents industry.

By Application:
Dairy Dominance Challenged by Beverage InnovationDairy and dairy-based products hold 30.10% of the market share in 2025, driven by established fortification protocols for vitamins A and D. This segment maintains its position through widespread household consumption and government-supported school milk programs. The beverage category is projected to grow at 12.74% CAGR (2026-2031), driven by ready-to-drink products that incorporate comprehensive micronutrient profiles, electrolytes, and live cultures. The food fortifying agents market in beverages is expected to surpass traditional categories due to increasing consumer preference for convenience and portable nutrition.
The market sees technological advancements such as liposomal vitamin C in isotonic beverages for enhanced absorption, while plant-based meal replacements combine protein, omega-3, and prebiotic fibers. Mandatory flour fortification sustains demand for bakery products, though increasing consumer preference for clean-label products drives interest toward minimally processed grains. The infant nutrition segment maintains strict regulatory standards, requiring suppliers to use high-purity, pharmaceutical-grade ingredients. The expansion of fortification into meat alternatives, snack bars, and ready-to-eat meals indicates growth beyond traditional products, creating opportunities for manufacturers to develop premium offerings.
By Form:
Powder Stability Versus Liquid BioavailabilityPowder formats accounted for 59.60% of the food fortifying agents market revenue in 2025. This dominance stems from their thermal stability, extended shelf life, and compatibility with dry-mix processing lines. Quality assurance tests, including loss-on-drying and accelerated-aging protocols, confirm that vitamin and mineral powders maintain their potency under ambient conditions, making them suitable for bulk distribution.
The liquid format segment is growing at a CAGR of 12.22%, driven by increasing demand for fortified beverages and shots. Liquid formulations, including suspensions, emulsions, and nano-dispersion technologies, demonstrate enhanced nutrient absorption and higher bioavailability compared to powder formats. In June 2024 Singapore has established a USD 14.8 million precision fermentation center, signaling strong institutional commitment to microbial production of vitamin-rich liquids. The remaining market segment comprises tablets, gummies, and encapsulates, with emerging technologies like self-assembling nanoparticles offering controlled release properties. While powder formats maintain their market position due to cost-effectiveness, heat resistance, and bulk transport advantages, the nutritional benefits and convenience of liquid formats continue to reshape the food fortifying agents market distribution.
Geography Analysis
North America Food Fortifying Agents Market
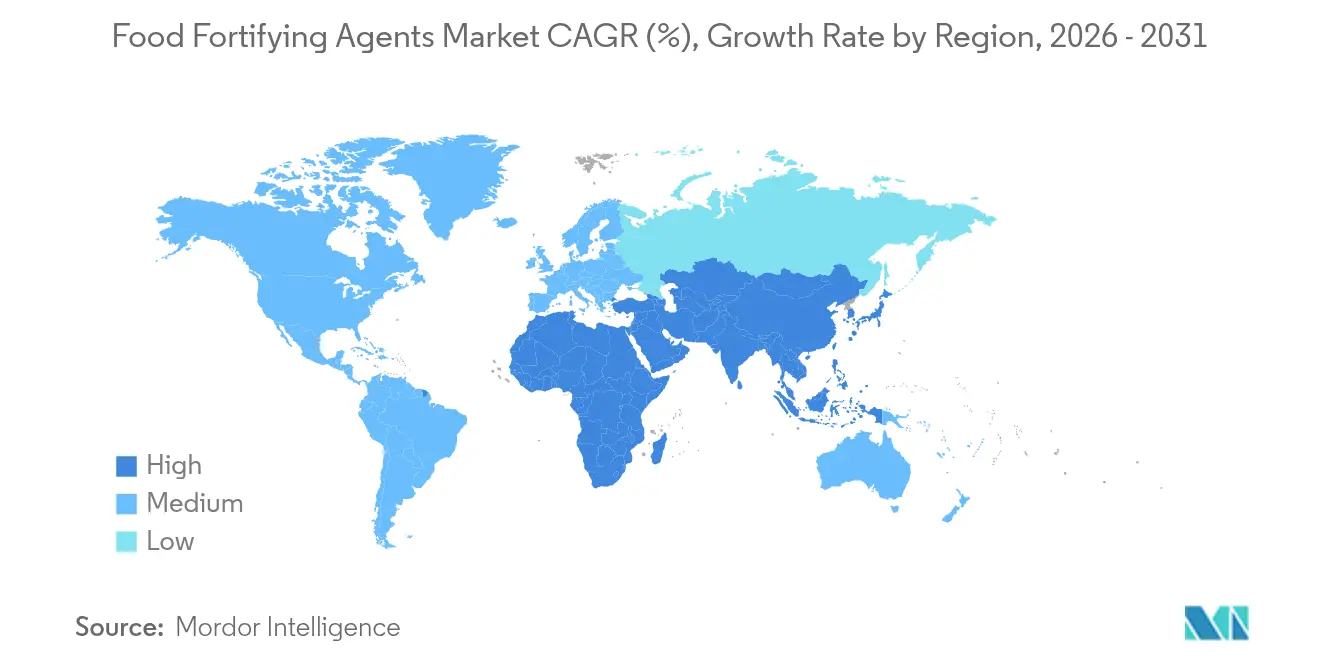
North America held 32.60% of global sales in 2025, supported by FDA guidance on nutrient addition and labeling requirements. The United States maintains high volumes through flour, cereal, and beverage fortification, while Canada's standardized regulations facilitate ingredient trade. Mexico's participation in USMCA enhances regional sourcing capabilities and provides scale benefits to processors. The region's growth focuses on personalized beverages, brain-health formulations, and vegan fortification blends.
APAC Food Fortifying Agents Market
Asia-Pacific shows 11.95% CAGR through 2031, supported by government initiatives and increased health awareness among middle-class consumers. India's rice fortification program targets 65% of the population with vitamin B12, iron, and folic acid supplementation to address anemia. China develops biotech capabilities for omega-3 and vitamin production, while Japan's FOSHU system validates probiotic and prebiotic applications. South Korea utilizes its dairy and fermented-food expertise in lactic-acid-bacteria fortification, as demonstrated by LG H&H's FGO-based children's product launch in June 2025. ASEAN countries implement unified fortification guidelines for noodles and edible oils.
EMEA and LATAM Food Fortifying Agents Market
Europe maintains moderate growth based on clear regulations and consumer preference for natural, sustainable ingredients. Latin America, the Middle East, and Africa show gradual growth through public-health initiatives and NGO-supported staple-food fortification programs. These regional developments contribute to the food fortifying agents market's global presence with distinct regional growth factors.
Regulatory Landscape
Food fortification is governed by a combination of international guidance and country-specific mandates that set permitted nutrients, addition levels, and labeling. Codex Alimentarius guidance (CXG 9-2015) underpins many national large-scale staple food fortification programs, while the United States applies FDA fortification policy in 21 CFR 104.20 to guide “rational” nutrient addition and limit indiscriminate fortification. In January 2025, FDA also proposed front-of-package labeling rules that shape how fortified products present nutrition.
Recent regulatory actions show both expansion and tighter oversight. In April 2026, Colombia’s Ministerio de Salud y Proteccion Social issued Decree 380 of 2026, mandating fortification of rice, wheat flour, and corn flour with vitamins and minerals (with implementation details that vary by category). In February 2026, India temporarily discontinued fortified rice distribution under PMGKAY and other welfare channels after reported concerns around shelf life and nutrient stability. In Europe, the EU framework for addition of vitamins and minerals is anchored in Regulation (EC) No 1925/2006, and in July 2026 Ireland opened a public consultation on potential mandatory folic acid fortification of non-wholemeal flour, with the consultation closing on October 5, 2026.
Value Chain Analysis
The value chain runs from upstream micronutrient production, including vitamins, minerals, amino acids, omega-3s, and bioactives, to premix formulation and blending, and then into downstream incorporation by food and beverage manufacturers and staple-food millers. Large ingredient groups, including BASF, dsm-firmenich, Cargill, ADM, and Kerry, supply standardized fortificants and tailor premixes for applications such as dairy, beverages, infant nutrition, and cereals and bakery. Delivery technologies such as microencapsulation and liquid dispersions support nutrient stability and bioavailability. Public-sector procurement for large-scale staple food fortification programs adds another specification layer, covering assay, stability, and traceability.
Quality assurance and regulatory compliance are central midstream steps, particularly for flour milling and fortified rice kernel (FRK) ecosystems that depend on dosing accuracy and food safety systems. Industry initiatives like Millers for Nutrition provide technical assistance and management systems (including FSMS and ISO 22000:2018 pathways for rice units), which support execution in developing markets. Regulatory fragmentation and enforcement variation affect how programs operate: in March 2026, Saudi Arabia’s SFDA introduced tighter controls on fortification claims and restricted fortification in certain fresh, unprocessed foods, while Colombia’s April 2026 Decree 380 expands mandatory demand for fortified staples. Program continuity can also change quickly, as reflected in India’s February 2026 pause on fortified rice in welfare distribution, which impacts FRK, premix, and miller offtake planning.
Competitive Landscape
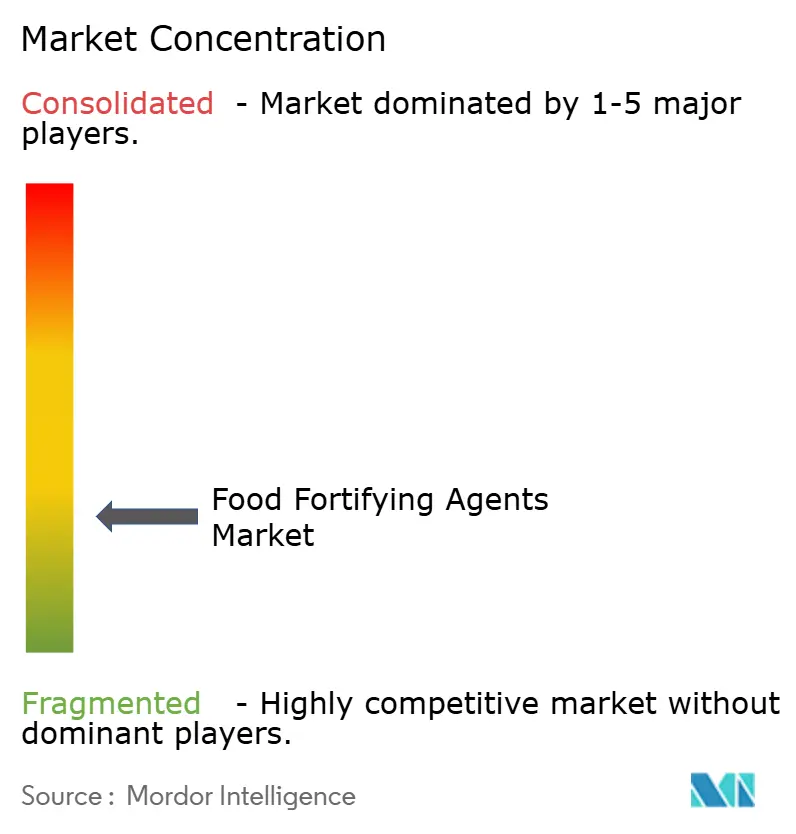
The food fortifying agents market demonstrates a fragmented competitive structure, where both established companies and new entrants compete for market share through product differentiation and technological innovations. Companies are increasingly focusing on technological advancements, particularly in microencapsulation, precision fermentation, and delivery systems to improve nutrient bioavailability and stability. Major players in the market include BASF SE, DSM-Firmenich AG, Cargill Incorporated, Archer-Daniels-Midland Company, and Kerry Group plc.
Major players are implementing vertical integration strategies to maintain supply chain control and ensure consistent quality standards. In contrast, smaller companies concentrate on niche segments, including organic fortification, plant-based nutrients, and personalized nutrition solutions. The complex regulatory environment surrounding fortification creates entry barriers that benefit established companies with proven compliance track records and technical knowledge.
The industry is witnessing an increase in innovation partnerships, as exemplified by Cargill and ENOUGH's expanded collaboration in February 2024. This partnership aims to develop nutritious and sustainable alternative meat and dairy products, with Cargill investing in ENOUGH's Series C funding round and securing a commercial agreement to utilize and market its fermented protein. Innovation through partnerships, including university collaborations and supplier-manufacturer development projects, helps companies manage risks and accelerate product launches.
Food Fortifying Agents Industry Leaders
-
BASF SE
-
DSM-Firmenich AG
-
Cargill, Incorporated
-
Archer-Daniels-Midland Company
-
Kerry Group plc
- *Disclaimer: Major Players sorted in no particular order
Food Fortifying Agents Market Companies Covered in this Report
- BASF SE
- DSM-Firmenich AG
- Cargill, Incorporated
- Archer-Daniels-Midland Company
- Kerry Group plc
- International Flavors & Fragrances, Inc.
- Ingredion Incorporated
- Tate and Lyle PLC
- Nestle S.A.
- CHR. Hansen Holding
- Kalsec Inc.
- Eastman Chemical Company
- Kemin Industries
- Glanbia PLC
- Univar Solutions LLC.
- Corbion NV
- Stern-Wywiol Group
- Arla Foods Ingredients
- Givaudan SA
- Prinova Group
Market Opportunities and Future Outlook
Large-scale staple fortification programs continue to support volume demand for vitamins and minerals, while tighter governance increases the value of compliance-ready premixes and monitoring support. In March 2026, Cambodia’s National Council on Nutrition launched the National Strategy for Food Fortification 2025 to 2030, covering vehicles such as rice, salt, and cooking oil, which highlights a policy-backed pathway for suppliers that can meet public procurement and testing requirements. The OECD’s May 2026 work on good practice principles for food fortification regulation further emphasizes more structured national frameworks, raising the importance of documented stability, quality systems, and traceability across the supply chain.
Innovation is also shaping opportunity in clean-label and alternative-source micronutrients, along with delivery systems used in beverages and processed foods. In July 2026, Fermenta Biotech received FSSAI approval in India for VITADEE Green, a 100% plant-sourced vitamin D3 ingredient for food and beverage fortification, expanding options for brands targeting vegetarian and sustainability-positioned products. Capability investments support localization efforts as well, including Bayer’s February 2026 investment of EUR 5 million at its Cimanggis, Indonesia consumer health supply center to upgrade production lines and expand R&D for multiple micronutrient supplements, which can feed fortified food and functional nutrition pipelines.
Recent Industry Developments in Food Fortifying Agents Market
- February 2026: Cargill completed an investment to upgrade postbiotic fermentation infrastructure at its Cedar Rapids, Iowa facility, expanding capacity tied to its Micronutrition and Health Solutions portfolio. The update expands supply capability for fermentation-derived functional ingredients that can be formulated into fortified nutrition products and adjacent wellness-positioned applications.
- November 2025: Cargill completed a major expansion at its Engerwitzdorf, Austria facility, adding six raw-material silos and increasing annual micronutrient production capacity by 50%. The added storage and handling capability supports scale-up and more resilient fulfillment for premixes and micronutrient blends used in food fortification programs.
- September 2024: dsm-firmenich launched Dry Vitamin A Palmitate NI, a clean-label dry vitamin A form designed for flour fortification. The product targets stability and processing-loss challenges that can reduce effective micronutrient delivery in staple foods, supporting more consistent compliance with fortification specifications.
Food Fortifying Agents Market Report Scope and Research Methodology
Market Definition and Coverage
This market covers ingredients added to foods and beverages to increase or restore nutrition, including vitamins, minerals, proteins and amino acids, lipids, carbohydrates, and prebiotics and probiotics. The sizing is reported in value terms for global demand across common fortified food and supplement applications.
Scope exclusions: We exclude retail sales value of finished fortified products and only count the value of fortifying ingredients supplied into manufacturing and formulation.
Segments Covered in This Report
- By Type
- Proteins and Amino Acids
- Vitamins
- Lipids
- Prebiotics and Probiotics
- Minerals
- Carbohydrates
- Others
- By Form
- Powder
- Liquid
- Others
- By Application
- Dairy and Dairy-Based Products
- Beverages
- Infant Formula and Early-Life Nutrition
- Cereals and Bakery
- Dietary Supplements
- Others
- By Geography
- North America
- United States
- Canada
- Mexico
- Rest of North America
- Europe
- United Kingdom
- Germany
- Spain
- France
- Italy
- Russia
- Rest of Europe
- Asia-Pacific
- China
- India
- Japan
- Australia
- Rest of Asia-Pacific
- South America
- Brazil
- Argentina
- Rest of South America
- Middle East and Africa
- Saudi Arabia
- South Africa
- Rest of Middle East and Africa
- North America
Data Sources, Market Sizing, and Validation
Desk Research
Desk work started with mapping where fortification is mandated or strongly guided, and where voluntary fortification is most common. We used public source types such as the World Health Organization, FAO, and national health and food safety agencies to track nutrition standards and micronutrient focus areas, including iron, iodine, vitamin A, folic acid, and vitamin D.
To keep the market model aligned with demand signals, we also reviewed nutrition deficiency indicators and food consumption context from sources such as UNICEF, the World Bank, and official population and household statistics. Trade association publications and ingredient supplier public materials were used to understand typical use levels, product forms (powder or liquid), and application patterns across dairy, cereals, beverages, infant nutrition, and supplements. In parallel, we used paid subscriptions for company financials and business intelligence, and for patent trend scanning around delivery systems such as microencapsulation, to triangulate where new capacity and formulation activity is building. These examples are not exhaustive, and other public and paid sources were also referenced for data collection, validation, and clarification.
Primary Interviews and Surveys
Primary conversations were held with ingredient manufacturers, blenders and distributors, and formulation and quality teams at food and supplement companies. These inputs were used to confirm typical inclusion rates by application, pricing behavior for key micronutrients, and how demand shifts when regulations change or when cost pressure forces reformulation.
Because this is a global market, we balanced discussion across APAC, EMEA, and the Americas so differences in mandates, staple fortification programs, and consumer supplementation habits could be reflected in the final assumptions.
Distribution of primary research fieldwork respondents
| Company type | Respondent position | Region |
|---|---|---|
| Top tier: 37% | CXOs: 14% | APAC: 42% |
| Mid tier: 47% | Functional/Unit leaders: 26% | EMEA: 33% |
| Smaller Players: 16% | Managers: 60% | Americas: 25% |
Market-Sizing & Forecasting
The core sizing used a top-down demand reconstruction, where food category consumption and fortification prevalence were converted into ingredient demand using typical dosage levels, and then valued using application-level pricing assumptions. To keep totals realistic, the model was checked with selective bottom-up approximations, such as sampled supplier revenue splits, channel checks on volume movements, and simple volume times average selling price builds for high-visibility nutrient groups.
We treated a few market fingerprints as key inputs because they change the output quickly. These include the share of staple foods under mandatory fortification programs, the pace of infant nutrition and dietary supplement consumption, the shift between powder and liquid forms in industrial use, and price movements in core vitamins and minerals that are sensitive to input costs. Where country data was thin, proxy assumptions were applied using similar regulatory status and comparable per capita consumption, and then refined after expert feedback.
For forecasting, scenario analysis was used around regulation intensity and fortification adoption, and it was supported by trend-based techniques such as exponential smoothing on pricing and demand indicators. In each major region, the forward view was adjusted only after interview-based agreement on realistic adoption speed and likely reformulation cycles.
Data Validation & Update Cycle
Each output was tested against independent signals, including whether implied ingredient volumes match what fortified food penetration and typical dosage levels would suggest, and whether implied pricing sits inside the ranges seen in public disclosures and expert feedback. When a jump looked too large for a single year, the drivers were rechecked and the assumptions were revisited with follow-up calls.
Before sign-off, the model and narrative go through multiple analyst reviews so inputs, calculations, and logic remain consistent across regions and applications. The report is refreshed annually, and interim updates are made when material events occur, such as major regulatory shifts or sharp raw material price moves. Right before delivery, a final review pass is done so clients receive the most current view available.
Mordor Intelligence's Food Fortifying Agents Market Estimate Compared With Other Published Estimates
Published market values for food fortifying agents can differ even when the topic sounds the same, because timing and pricing rules are not uniform across studies. Small methodological choices, such as which year-average exchange rate is used and whether pricing is taken at contract level or modeled as spot-like, can move the value number noticeably.
Key gap drivers in this market usually come from scope boundaries (ingredients only versus finished fortified foods), which applications are counted (including or excluding supplements or infant nutrition), and how average selling prices are progressed when vitamins and minerals face cost swings. In this study, the currency conversion and price decks are refreshed on a set cadence with anomaly checks linked to dosage norms and application mix, and then the final figure is locked for publication, a refresh-led step applied by Mordor Intelligence.
Benchmark comparison
| Source | Market Size | Gaps in Research Methodology |
|---|---|---|
| Mordor Intelligence | USD 112.92 B (2026) | |
| Industry Research Publisher A | USD 111.36 B (2025) | Uses a different base year and pricing window, and its scope description suggests a broader application net in some sections, which can shift ASP and volume mixes even if growth rates look similar. |
| Industry Research Publisher B | USD 100.43 B (2024) | Anchors the series to an earlier historical base and a shorter forecast window, and the implied valuation appears more conservative on ingredient pricing progression during periods of micronutrient cost volatility. |
Taken together, the spread is mainly explained by year selection, what is counted inside the ingredient value pool, and how pricing and currency timing are handled. By keeping inputs traceable to adoption, dosage, and application-mix logic, the methodology supports a balanced number that can be replicated and stress-tested with clear adjustments.
Key Questions Answered in the Report
What is the current size of the food fortifying agents market?
The market is valued at USD 112.92 billion in 2026 and is projected to reach USD 180.97 billion by 2031.
Which ingredient type holds the largest share?
Vitamins lead with 31.35% of 2025 revenue, driven by longstanding regulatory adoption in staple-food programs.
Which application segment is expanding the fastest?
Beverages are growing at 12.74% CAGR through 2031 as consumers seek on-the-go nutrition in ready-to-drink formats.
Why is Asia-Pacific the fastest-growing region?
Large-scale mandates such as India’s rice fortification and rising middle-class health awareness are pushing Asia-Pacific to a 11.95% CAGR.