
Market Overview
| Study Period | 2020 - 2031 |
|---|---|
| Market Size (2026) | USD 28.47 Billion |
| Market Size (2031) | USD 35.86 Billion |
| Growth Rate (2026 - 2031) | 4.72 % |
| Fastest Growing Market | Asia Pacific |
| Largest Market | North America |
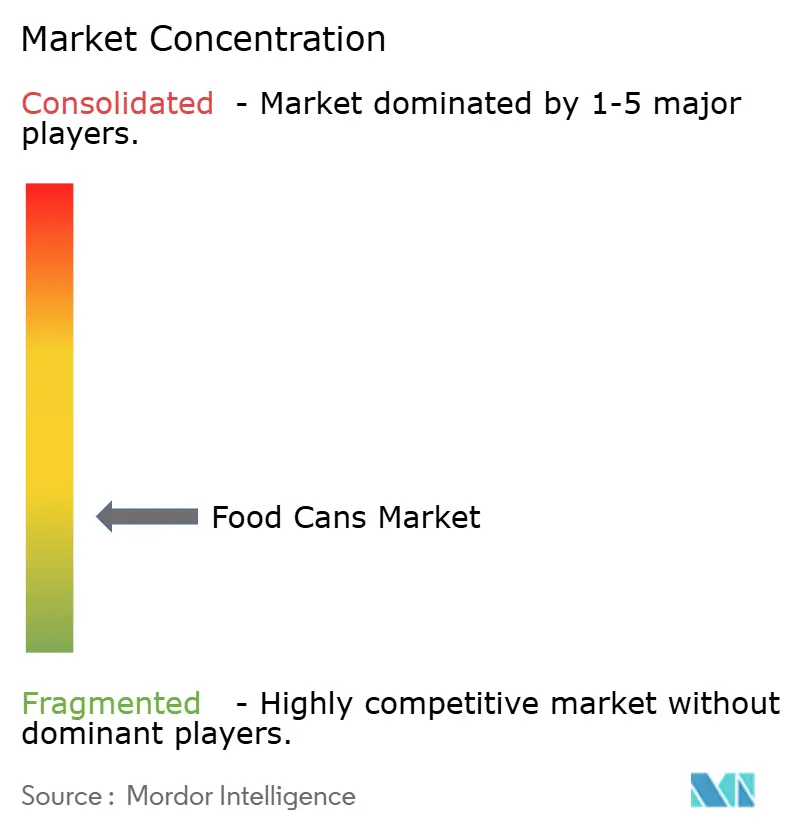
| Market Concentration | Low |
Major Players *Disclaimer: Major Players sorted in no particular order Image © Mordor Intelligence. Reuse requires attribution under CC BY 4.0. | |
Food Cans Market Analysis by Mordor Intelligence
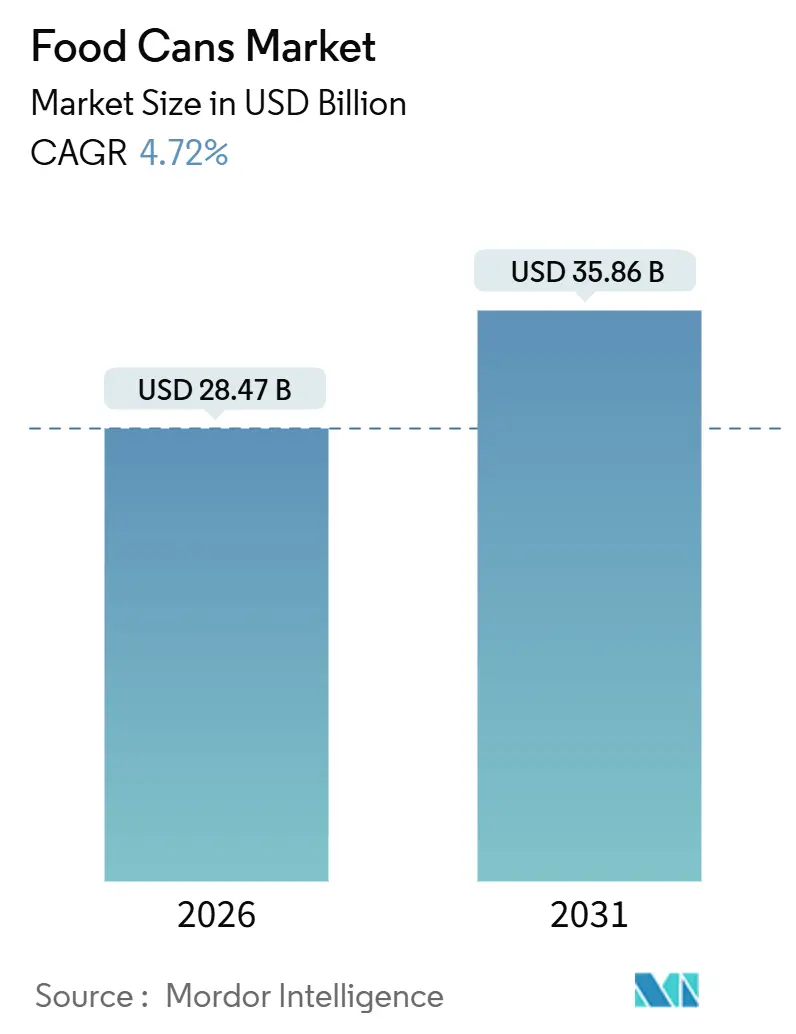
The food cans market size stands at USD 28.47 billion in 2026 and is forecast to reach USD 35.86 billion by 2031, progressing at a 4.72% CAGR. Growth is anchored by resilient demand across shelf-stable proteins, vegetables, and premium wet pet food, even as raw material price swings and coating regulation changes compress converter margins. Lightweight aluminum is gaining ground because brand owners are under extended producer responsibility mandates, while medium-format SKUs fit the rise in single-person households. Investments in high-speed two-piece lines across the Asia-Pacific region illustrate a strategic pivot toward faster-growing geographies, and sustainability-focused retailers are pushing for BPA-free interiors to future-proof their private-label assortments.
Key Report Takeaways
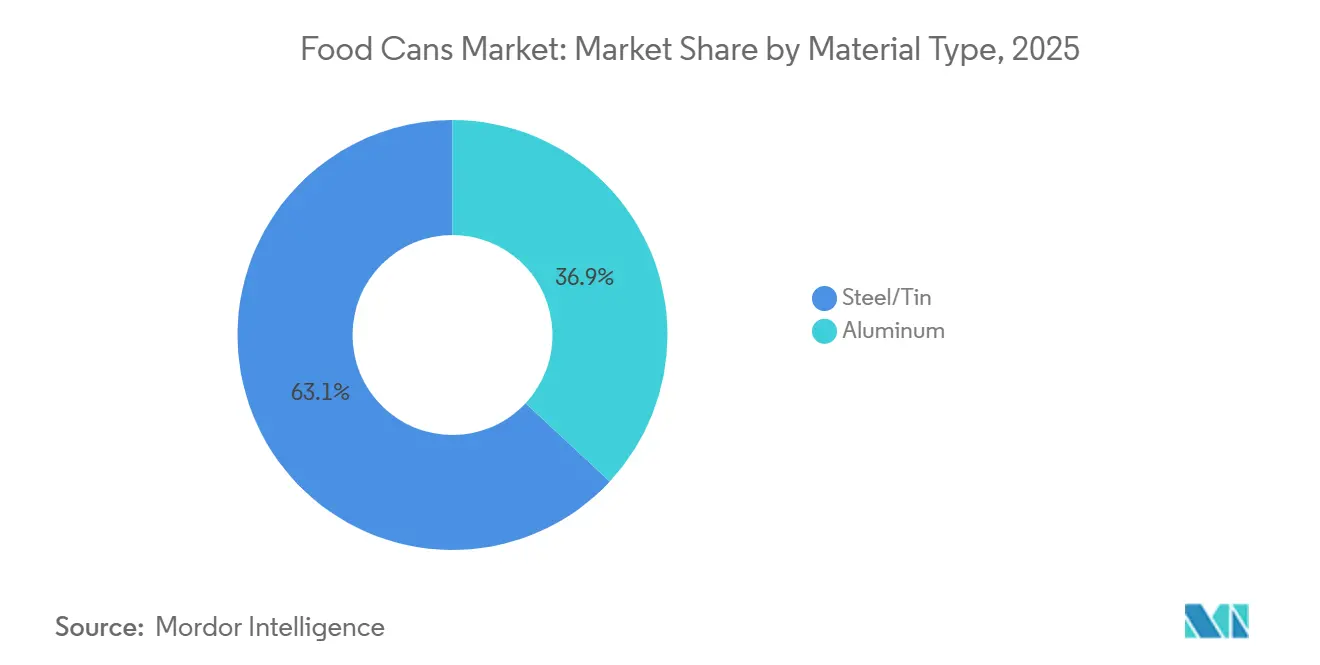
- By material type, steel and tin-based cans held 63.06% of the food cans market share in 2025, and aluminum variants are advancing at a 5.43% CAGR through 2031.
- By can type, three-piece welded formats commanded 58.63% revenue share in 2025, while two-piece drawn-and-ironed cans are expanding at a 5.32% CAGR to 2031.
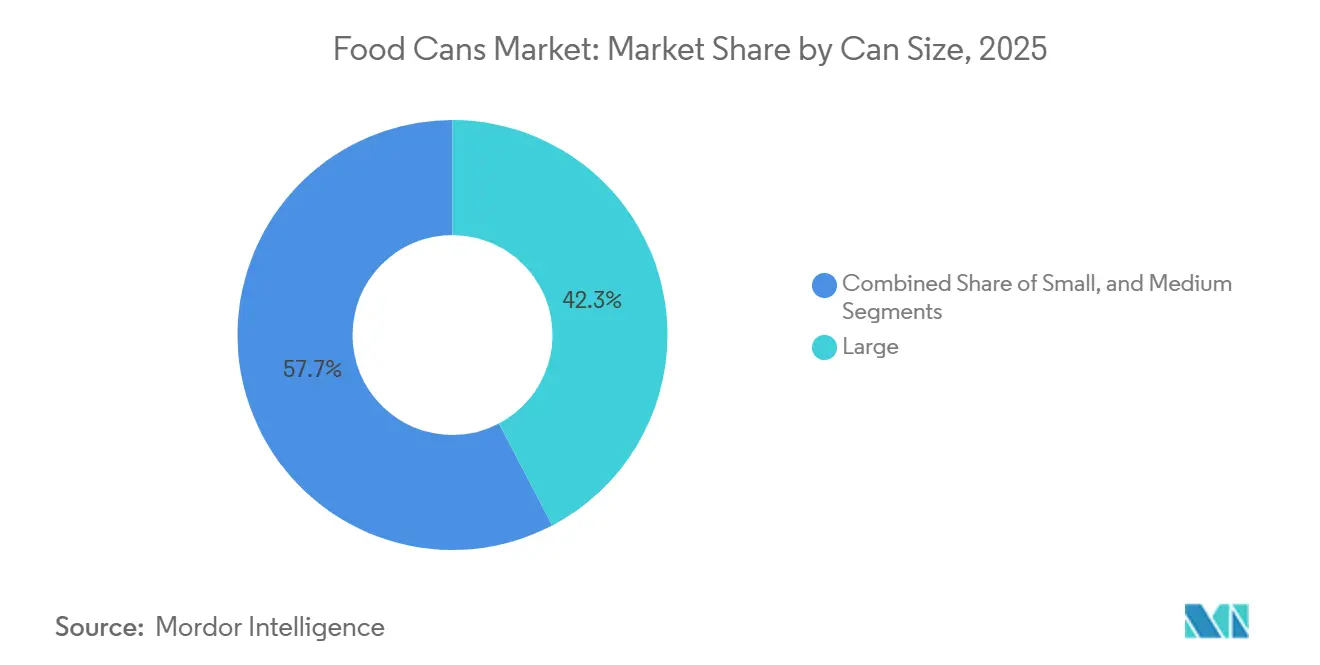
- By can size, large (more than 500 g) commanded 42.32% of the food cans market share in 2025, while medium formats between 201 grams and 500 grams are projected to grow at a 5.87% CAGR from 2026-2031, outpacing both small and large formats.
- By application, ready meals led with a 34.32% revenue share in 2025; however, pet food is the fastest-growing segment at a 6.21% CAGR through 2031.
- By geography, North America retained 39.87% of global revenue in 2025, while the Asia-Pacific region is set to grow at a 6.42% CAGR and narrow the gap by 2031.
Note: Market size and forecast figures in this report are generated using Mordor Intelligence’s proprietary estimation framework, updated with the latest available data and insights as of January 2026.
Market Trends and Insights
Drivers Impact Analysis of Food Cans Market*
| Driver | (~) % Impact on CAGR Forecast | Geographic Relevance | Impact Timeline |
|---|---|---|---|
| Rising Disposable Incomes and Urbanization Boosting Packaged Food Consumption | +0.9% | Asia-Pacific core, spillover to Middle East and Africa | Medium term (2-4 years) |
| Expansion of Modern Retail and E-commerce Grocery Channels | +0.7% | Global, early gains in North America and Europe | Short term (≤ 2 years) |
| Superior Barrier Properties and Shelf Life Extension Compared to Flexible Packaging | +0.6% | Global | Long term (≥ 4 years) |
| Increasing Pet Ownership Driving Demand for Wet Pet Food in Metal Cans | +0.8% | North America and Europe, emerging in Asia-Pacific | Medium term (2-4 years) |
| Increased Adoption of High-speed Two-piece Can Manufacturing Lines in Emerging Markets | +0.5% | Asia-Pacific, South America | Medium term (2-4 years) |
| Growing Use of Smart Can QR Codes Enabling Traceability and Consumer Engagement | +0.3% | North America and Europe, pilot programs in Asia-Pacific | Long term (≥ 4 years) |
| Source: Mordor Intelligence | |||
Rising Disposable Incomes and Urbanization Boosting Packaged Food Consumption
Rapid migration to cities across India, Indonesia, and Brazil is shrinking the window for home cooking, so households are stocking shelf-stable proteins, fruits, and vegetables that require no refrigeration. India’s Reliance Consumer Products has committed INR 40,000 crore (USD 4.8 billion) to integrated food parks, with the inaugural plant in Kurnool focusing on canned produce. This signals that processors view metal packaging as a first wave before cold-chain infrastructure matures.[1]Brazil’s retail turnover reached USD 183 billion in 2024, with consumers trading down into value-priced canned staples rather than exiting categories, a pattern replicated in secondary cities across South America.
Expansion of Modern Retail and E-commerce Grocery Channels
Direct-to-consumer grocery models rely on packaging that can withstand last-mile bumps without refrigeration, giving metal cans a structural advantage over glass. Mexico’s modern retail sector captured more than 50% of household food expenditures in 2024, with e-commerce sales reaching USD 542 million, thereby widening shelf space for private-label canned beans and chilies.[2]The United Arab Emirates banned several single-use plastic items in 2026, prompting quick-service restaurants to adopt ambient-stable canned soups for delivery platforms.[3]
Superior Barrier Properties and Shelf Life Extension Compared to Flexible Packaging
Metal cans block oxygen, light, and moisture, extending shelf life to as much as five years without the need for preservatives or refrigeration, an advantage in regions with erratic power supplies. The European Union banned BPA in food-contact articles in December 2024, steering converters toward polyester and acrylic coatings that preserve barrier performance and eliminate regulatory overhang. U.S. regulators are reviewing similar petitions, prompting processors to pre-emptively specify BPA-free linings and de-risk export compliance.
Increasing Pet Ownership Driving Demand for Wet Pet Food in Metal Cans
The United States pet food sector reached USD 58.5 billion in 2024 and is projected to reach USD 68.6 billion by 2029, with wet formulations in cans securing a premium position, as owners associate hermetic sealing with freshness. European single-person households tend to favor 200-gram and 400-gram cans, which reduce spoilage. Novelis recycled more than 82 billion used cans in fiscal 2024 and is building a USD 4.1 billion mill in Alabama, where over half of the capacity will be dedicated to food and beverage packaging, underscoring aluminum’s closed-loop value.
Restraints Impact Analysis of Food Cans Market*
| Restraint | (~) % Impact on CAGR Forecast | Geographic Relevance | Impact Timeline |
|---|---|---|---|
| Shift Toward Flexible Plastic Pouches and Cartons Due to Cost and Weight Advantages | -0.6% | Global, concentrated in North America and Europe | Short term (≤ 2 years) |
| Volatility in Aluminum and Steel Prices Affecting Profit Margins | -0.5% | Global | Short term (≤ 2 years) |
| Stringent Regulations Against BPA-based Epoxy Linings | -0.4% | Europe, emerging in North America | Medium term (2-4 years) |
| Limited Recycling Infrastructure for Multilayer Polymer-Coated Steel Cans in Developing Economies | -0.3% | Asia-Pacific, Middle East and Africa, South America | Long term (≥ 4 years) |
| Source: Mordor Intelligence | |||
Shift Toward Flexible Plastic Pouches and Cartons Due to Cost and Weight Advantages
Flexible pouches weigh up to 40% less than equivalent cans, so brand owners chasing lower transport emissions adopt them for fruit cups and gravy toppers. Toyo Seikan reported share gains for its retort-pouch line in 2024 as private labels sought cheaper single-serve options. Carton suppliers such as SIG use thin aluminum laminate to approximate metal-can barrier properties, challenging ambient soup SKUs across Europe.
Volatility in Aluminum and Steel Prices Affecting Profit Margins
The London Metal Exchange's aluminum traded above USD 2,525 per metric ton in June 2025, while the U.S. Producer Price Index for steel cans rose about 2% in early 2025, squeezing converters locked into fixed-price contracts. Crown Holdings said raw-material inflation clipped gross margin by 150 basis points in Q3 2024 despite operating-efficiency gains.
*Our forecasts treat driver/restraint impacts as directional, not additive. The impact forecasts reflect baseline growth, mix effects, and variable interactions.
Food Cans Market Segment Analysis
By Material Type:
Aluminum Builds Momentum on SustainabilitySteel and tin-based cans generated 63.06% of food cans market revenue in 2025, yet aluminum posted the fastest 5.43% CAGR through 2031. The food cans market size for aluminum formats is widening because lightweight alloys allow 10%-15% thinner walls that reduce freight cost without compromising burst strength. Novelis delivered 63% recycled content across its rolled-product mix in 2024, validating closed-loop economics that reduce carbon intensity by more than 90% relative to primary production. Aluminum’s malleability enables seamless two-piece designs that attract premium pet food and ready-meal brands, while steel stays dominant in price-led categories where deep-draw tooling amortizes over high volumes.
Converters favor aluminum when shipping to e-commerce warehouses that bill by dimensional weight, and the material’s non-ferrous nature avoids corrosion in acidic tomato bases. Still, magnetic steel simplifies municipal sortation, an edge in mature North American recycling systems. In emerging markets, limited remelt capacity caps aluminum uptake, so steel maintains hold in staple canned vegetables. The dual-material landscape means processors often dual-source to hedge price swings, further advancing the food cans market as players align substrate to channel and geography.
By Can Type:
Two-Piece Formats Gain TractionThree-piece welded cans captured 58.63% of revenue in 2025, but two-piece drawn-and-ironed designs are expanding at a 5.32% CAGR through 2031. Krones filling lines now process more than 120,000 units per hour, allowing converters to amortize higher tooling costs faster and achieve a sub-USD 0.30 cost for a standard 400-gram can. Seamless bodies eliminate side welds, reducing coating needs and enhancing shelf appeal, which boosts adoption in premium pet food and microwavable ready meals.
The food cans market share for two-piece formats climbs fastest in the Asia-Pacific region, where greenfield plants often skip legacy welding altogether. Ball Corporation will invest USD 60 million in Andhra Pradesh to add two-piece capacity, in line with India’s double-digit growth in metal packaging demand. Three-piece technology remains favored for institutional cans weighing above 500 grams because deep draws would require more costly tooling. As processors balance cost, speed, and material intensity, both formats coexist, giving the food cans market resilient substrate diversity.
By Can Size:
Medium Formats Fit Changing LifestylesLarge cans, above 500 grams, still account for 42.32% of the 2025 volume, as foodservice and multi-person households value bulk economics. However, medium cans, weighing between 201 grams and 500 grams, register the quickest 5.87% CAGR to 2031. Single-person households, now comprising more than 30% of urban dwellings in the United States, tend to gravitate toward portion-controlled SKUs that minimize leftovers. Mexican retailers have widened shelf space for 300-gram beans and tomatoes that anchor meal-kit recipes.
The food cans market size allocated to medium formats benefits from e-commerce: smaller units fit parcel constraints and reduce kerbside waste. Small cans under 200 grams stay niche, yet command high per-unit prices in infant nutrition or gourmet tuna. Bulk institutional formats will persist, especially in school meal programs and catering, but their lower growth tempers overall demand, prompting converters to retool lines toward agile, mid-size production runs.

By Application:
Pet Food Surges Ahead of Ready MealsReady meals contributed 34.32% of segment revenue in 2025, but pet food is sprinting at a 6.21% CAGR through 2031. Humanization trends mean owners buy wet food cans with human-grade meats, trusting the metal’s hermetic seal for freshness. The food cans market size tied to pet food will therefore outstrip that for some traditional center-store items. Tuna, salmon, and sardine processors rely on cans to secure three-year shelf lives for export corridors from Southeast Asia to Europe, thereby reinforcing the relevance of metal for protein preservation.
Vegetable and fruit canning remains a pantry staple, yet growth is modest as fresh and frozen alternatives gain retail end-caps. Processed soup and sauce brands defend their share with BPA-free tins and QR-code engagement. The diverse application matrix sustains the food cans market by pairing mature center-store categories with ascendant premium pet food.
Geography Analysis
North America Food Cans Market
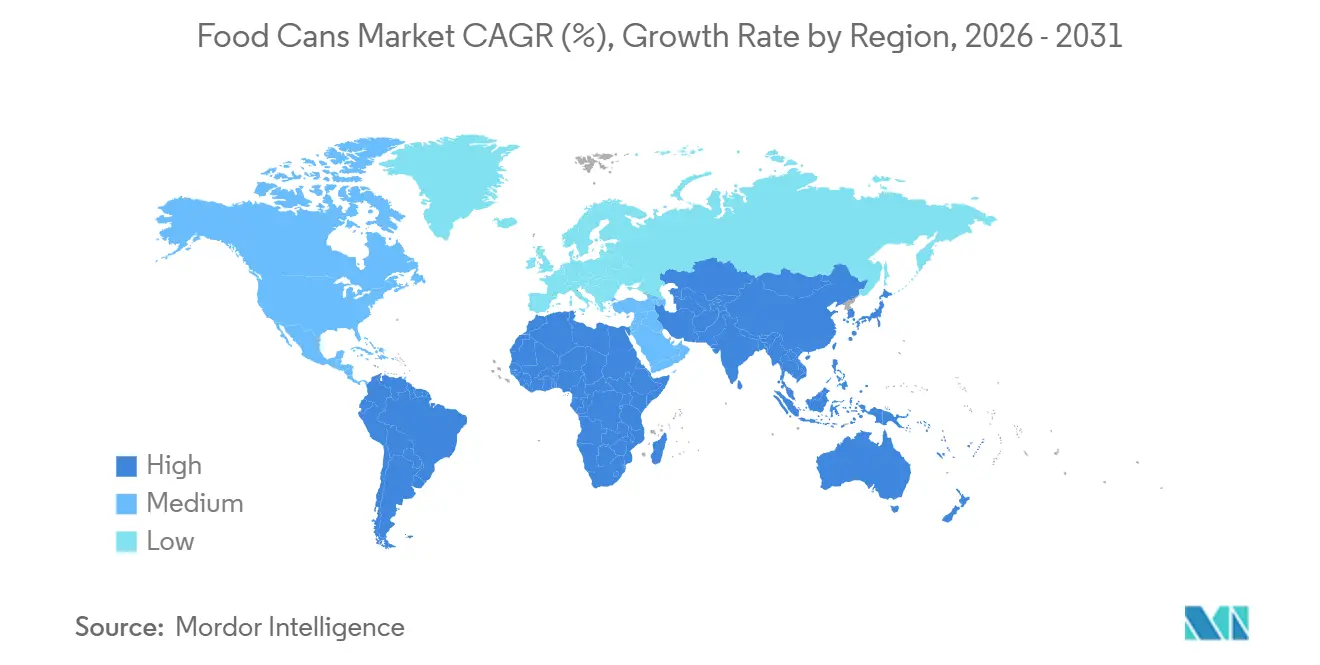
North America held 39.87% of the global revenue in 2025, as entrenched canning lines, established supply chains, and high per-capita consumption sustain baseline volumes. Growth lags behind the global CAGR as the population plateaus, yet operational upgrades support margins. Crown Holdings sold its European tinplate arm to reallocate capital toward North American specialty food cans, underscoring a shift to higher-margin niches. Steel price volatility and a 43% aluminum-can recycling rate in 2023 have tightened scrap supply, nudging converters to pass through surcharges.
APAC Food Cans Market
The Asia-Pacific region expands at the fastest rate, with a 6.42% CAGR, driven by urbanization, increased disposable income, and investment in local supply chains. Ball’s Sri City and Taloja expansions demonstrate how global majors are localizing two-piece lines to cater to multinational food processors entering India. China’s tinplate mills and Southeast Asian tuna corridors attract joint ventures blending Japanese coating know-how with local distribution. India’s World Food India summit drew INR 1.02 trillion (USD 12.2 billion) in pledges, pivoting toward canned produce to circumvent limited cold chains.
EMEA and South America Food Cans Market
Europe advances at roughly 4.3% CAGR, a pace dampened by slow demographic growth but energized by sustainability rules. The December 2024 BPA ban forces converters to adopt next-generation linings, amplifying capital needs yet giving early movers a marketing edge. Private-label penetration continues to rise as discounters promote value-oriented canned assortments. South America and the Middle East and Africa grow at mid-single digits; Brazil’s USD 183 billion retail market shows resilience and the UAE plastic-ban shift adds incremental can volumes in foodservice settings.
Regulatory Landscape
Food can makers are working through tighter chemical-compliance requirements for food-contact materials, with Europe a primary driver. Commission Regulation (EU) 2024/3190 restricts bisphenols such as BPA in food-contact applications, and key rules for single-use articles apply from 20 July 2026. This timeline is pushing converters toward BPA-free interior coatings, alongside qualification work across converters and brand owners.
Packaging policy is also tightening around substances of concern and circularity. The EU Packaging and Packaging Waste Regulation (PPWR), which has been in force since February 2025, includes a PFAS restriction for food-contact packaging that applies from 12 August 2026. That change increases reformulation and supplier-approval demands for coatings, inks, and auxiliaries used on can bodies and ends. In the United States, the FDA continues to govern food-contact substances through its Food Contact Notification system and inventory updates (last updated 31 May 2026), while the 3 January 2025 determination that 35 PFAS-related FCNs were no longer effective supports ongoing compliance checks for materials used in food can systems.
Value Chain Analysis
The food cans value chain starts with upstream metal and chemistry inputs, primarily tin-mill steel/tinplate and aluminum sheet/coil, along with interior coatings, varnishes, and sealants that must meet food-contact requirements. Those inputs move to can manufacturers operating slitting, lithography/printing, body forming (three-piece welding or two-piece drawing and ironing), end-making, and lining/curing, before distribution to food processors and co-packers that fill, seam, and retort/sterilize for retail and foodservice channels.
In 2025-2026, procurement and cost pass-through became more prominent across the chain as trade and supply concentration intensified. The US move to double tariffs on imported steel and aluminum to 50% in June 2025 increased exposure for tin-mill steel, a category where US domestic production has materially declined and can makers rely heavily on imports. That dynamic has supported reshoring and regionalization steps in North America, including Ideal Can announcing a CAD 100 million expansion in Ontario and opening a Hamilton plant in April 2026 to bring steel-cutting and varnishing closer to demand. At the same time, large global participants such as Crown, Silgan, Ardagh, Ball, Trivium, and CANPACK continue to balance footprints across high-growth and cost-advantaged geographies.
Competitive Landscape
The food cans market features a top-five cohort, including Crown Holdings, Silgan Holdings, Trivium Packaging, Ardagh Metal Packaging, and Ball Corporation, which controls approximately 55%-60% of global revenue, with no single player holding a share above 20%. Crown’s Q3 2024 net sales reached USD 3.0 billion, yet segment income increased because operational efficiency offset the impact of soft volumes. The firm’s exit from European tinplate underlines a pivot away from commodity lines toward specialty formats.
Ardagh trimmed wall gauges by 15% on select SKUs, cutting per-unit alloy consumption and logistics cost, and reinforcing its sustainability pitch. Silgan’s USD 1.025 billion Weener Plastik deal broadens closures and dispensing capabilities, allowing the company to bundle cans and caps for sauces, an approach that secures contracts and counters flexible-pouch threats. Ball bets on Asia-Pacific, committing fresh capital to India, while Trivium leans on recycled-content messaging to win European tenders.
Start-ups in flexible packaging are eroding share in price-sensitive gravies and fruit cups, so incumbents deploy smart-code printing and rapid changeover lines to defend shelf presence. The competitive focus for 2026-2031 rests on material efficiency, regional capacity balancing, and digital engagement. This environment keeps pricing discipline tight and underscores why converters pursue vertical integration into coatings, lids, and logistics.
Food Cans Industry Leaders
-
Crown Holdings, Inc.
-
Toyo Seikan Group Holdings Ltd.
-
CANPACK S.A.
-
Ardagh Metal Packaging
-
Ball Corporation
- *Disclaimer: Major Players sorted in no particular order
Food Cans Market Companies Covered in this Report
- Crown Holdings Inc.
- Silgan Holdings Inc.
- Trivium Packaging
- Toyo Seikan Group Holdings Ltd.
- CANPACK S.A.
- Sonoco Products Company
- Ardagh Metal Packaging
- Ball Corporation (Food Can Division)
- Wells Can Company
- Kian Joo Group
- Visy Industries
- Jamestrong Packaging
- Colep Packaging
- Aaron Packaging Inc.
- CPMC Holdings Ltd.
- Greif Inc.
- Daeryuk Can Co. Ltd.
- Huber Packaging Group
- Crown Asia Pacific Holdings
- HPM Packaging
Market Opportunities and Future Outlook
A key opportunity is the accelerated shift to compliant, next-generation food-contact coatings and packaging chemistries in Europe ahead of 2026 deadlines. The EU BPA restrictions under Regulation (EU) 2024/3190 (with single-use requirements applying from 20 July 2026) and the PPWR PFAS restriction applying from 12 August 2026 create a defined conversion window for canmakers, coaters, and end suppliers to qualify polyester/acrylic and other alternatives. It also supports share gains for standardized BPA-free and PFAS-compliant specifications among private label and export-oriented food processors.
A second opportunity involves supply-chain regionalization and capacity placement closer to demand and metal supply, driven by trade friction and input volatility. The June 2025 increase in US tariffs on imported steel and aluminum, combined with reliance on imported tin-mill steel, is pushing investment in domestic processing steps, including Ideal Can opening its Hamilton plant in April 2026. It is also encouraging multi-sourcing strategies among processors and converters. Separately, large can industry capital allocation toward new lines in growth markets, together with investments that strengthen recycled-content credentials, creates a clearer whitespace for lightweighted formats and closed-loop claims in premium segments. CANPACK reporting 65% recycled content in aluminum cans in its 2024 sustainability reporting supports this direction, which is most visible in wet pet food and ready meals where brand owners use packaging sustainability and compliance as differentiators.
Recent Industry Developments in Food Cans Market
- June 2026: CANPACK formalized a collaboration with Canovation to advance the CanReseal resealable aluminum can-end system toward pilot-scale deployment and commercial readiness. The initiative focuses on convenience and differentiation in metal packaging formats, with implications for premium food and pet food brands that use packaging features to defend share against pouches and cartons.
- October 2025: CANPACK closed a USD 175 million bridge term loan facility with BNP Paribas Bank Polska SA to support ongoing expansion projects across multiple geographies including Poland, Brazil, India, and Colombia. The financing supports capacity and footprint moves intended to shorten lead times and align production closer to demand centers.
- August 2024: Toyo Seikan Group Holdings commenced mass production of its 190 ml 202 SOT aluminum beverage can using compression bottom reform technology, positioned as a lightweighting step. While beverage-focused, the manufacturing know-how and material-efficiency gains reflect broader canmaking priorities that shape equipment choices and sustainability claims across metal packaging operations.
Food Cans Market Report Scope and Research Methodology
Market Definition and Coverage
This market covers metal cans used to pack food products, counted in value terms based on shipments and consumption across major regions, with typical can formats and sizes used for shelf-stable and processed foods.
Scope exclusions: We exclude glass, pouches, cartons, and non-can rigid packs, and we also exclude beverage cans and aerosol cans.
Segments Covered in This Report
- By Material Type
- Steel/Tin
- Aluminum
- By Can Type
- 2-piece Cans
- 3-piece Cans
- By Can Size
- Small (Less than Equal to 200 g)
- Medium (201-500 g)
- Large (More than 500 g)
- By Application
- Ready Meals
- Fish and Seafood
- Fruits and Vegetables
- Processed Food
- Pet Food
- Other Applications
- By Geography
- North America
- United States
- Canada
- Mexico
- South America
- Brazil
- Argentina
- Rest of South America
- Europe
- Germany
- United Kingdom
- France
- Italy
- Spain
- Rest of Europe
- Asia-Pacific
- China
- Japan
- India
- South Korea
- Australia
- Rest of Asia-Pacific
- Middle East and Africa
- Middle East
- Saudi Arabia
- United Arab Emirates
- Turkey
- Rest of Middle East
- Africa
- South Africa
- Egypt
- Nigeria
- Rest of Africa
- Middle East
- North America
Data Sources, Market Sizing, and Validation
Desk Research
Desk work starts by anchoring demand and production realities for canned foods and metal packaging. We rely on public, repeatable references such as FAO food supply statistics, UN Comtrade trade flows for steel and aluminum products, World Steel Association publications, Aluminum Association materials, and OECD manufacturing indicators.
On top of this, we review company annual reports, investor presentations, sustainability disclosures, and packaging association websites to understand can-format mix, lightweighting direction, and pricing drivers. Patent databases are also checked to see where new can-end designs and coatings are being filed, which helps validate technology shifts that affect average pricing. This list is not exhaustive, and many other sources are used for data collection, validation, and research clarification.
Primary Interviews and Surveys
Primary work is used to pressure-test the desk assumptions, especially on can-end pricing, steel versus aluminum mix, and how demand shifts by application (ready meals, fish and seafood, fruits and vegetables, processed food, and pet food). We spoke with a mix of can manufacturers, material suppliers, converters, and large buyers across APAC, EMEA, and the Americas so the final inputs reflect real purchasing and production behavior.
Distribution of primary research fieldwork respondents
| Company type | Respondent position | Region |
|---|---|---|
| Top tier: 36% | CXOs: 14% | APAC: 42% |
| Mid tier: 50% | Functional/Unit leaders: 40% | EMEA: 31% |
| Smaller Players: 14% | Managers: 46% | Americas: 27% |
Market-Sizing & Forecasting
Sizing begins from the demand pool for canned food and the metal-packaging supply footprint, where production and trade data reconstruct the likely can consumption by region and application. We then translate this into market value using a practical set of price and mix assumptions, which are adjusted using interview inputs on contract timing and pass-through behavior.
To corroborate the totals, selective bottom-up approximations are run, such as sampled manufacturer revenue splits, channel checks on can-end and body pricing, and an ASP times volume sanity check for major applications. Key model inputs include steel and aluminum price direction, can size mix (small, medium, large), the split between 2-piece and 3-piece formats, canned food output trends, and trade intensity for metal packaging products. For the forecast, we use scenario analysis supported by expert views on raw material cycles, lightweighting pace, and demand stability in core canned categories. Where company disclosures are limited, gaps are handled by using regional peer ranges and then re-checking the implied per-can value against known material and conversion cost bands.
Data Validation & Update Cycle
Validation is done through a set of cross-checks so the final value is not driven by one single assumption. We compare model outputs against independent signals like canned food production trends, metal price indices, and import export movements, and then investigate variances that look too sharp by geography or application.
Before sign-off, the work goes through multi-step analyst review, and follow-up calls are triggered when a key price, mix share, or regional growth input changes the result beyond a reasonable range. Reports are refreshed annually, with interim updates when material events occur, such as a major raw material swing or a packaging regulation change. Right before delivery, a fresh pass is completed so clients receive the latest updated view.
Mordor Intelligence's Food Cans Market Size Measured Against Other Published Estimates
Published market numbers for food cans do not always match, even when they look similar on the surface, because the scope and the conversion from volume to value are not handled the same way. Differences tend to come from what gets counted as a food can, which year is treated as the current year, and how price and mix changes are applied across regions.
The table shows a spread around the 2026 size, and in Mordor Intelligence's model the value is built for food cans only, with beverage cans and aerosol cans kept outside the count, and the pricing logic is aligned to the 2026 to 2031 forecast window shown on the report page.
Benchmark comparison
| Source | Market Size | Gaps in Research Methodology |
|---|---|---|
| Mordor Intelligence | USD 28.47 B (2026) | |
| Trade Journal A | USD 25.70 B (2025) | Uses a broader metal cans definition for food and beverage packaging, which changes the denominator and can pull average pricing down when mixed-use cans are blended. |
| Regional Consultancy B | USD 37.50 B (2024) | Appears to report an earlier base year with a different current-year assumption and may apply a more aggressive value uplift, which can occur when price progression is not tied back to material and format mix checks. |
Taken together, the comparison mostly comes down to scope and timing, followed by how price and mix are refreshed in the model. By keeping the calculation traceable to food applications, can formats, and region-level demand signals, the final number stays easier to reproduce and to update when inputs shift.
Key Questions Answered in the Report
How large is the global food cans market in 2026?
The food cans market size is USD 28.47 billion in 2026 and is forecast to grow to USD 35.86 billion by 2031 at a 4.72% CAGR.
Which material is growing fastest in food can production?
Aluminum cans are advancing at a 5.43% CAGR because lightweighting and high recycled content align with retailer sustainability goals.
Why are medium-size cans gaining traction?
Units between 201 grams and 500 grams fit single-serve meal planning and e-commerce parcel limits, driving a 5.87% CAGR through 2031.
What is the leading application segment in revenue terms?
Ready meals lead with 34.32% of 2025 revenue, although pet food is expanding faster at 6.21% CAGR.
Which region will add the most incremental volume by 2031?
Asia-Pacific, growing at 6.42% CAGR, will add the largest share of new food can demand due to urban population and local capacity investments.
How are regulations shaping coating technology?
The European Union’s BPA ban effective from December 2024 is pushing converters toward polyester and acrylic linings, a change likely to influence other regions.