
Food Antioxidants Market Size and Share
Market Overview
| Study Period | 2021 - 2031 |
|---|---|
| Market Size (2026) | USD 1.94 Billion |
| Market Size (2031) | USD 2.71 Billion |
| Growth Rate (2026 - 2031) | 6.97 % |
| Fastest Growing Market | South America |
| Largest Market | Asia Pacific |
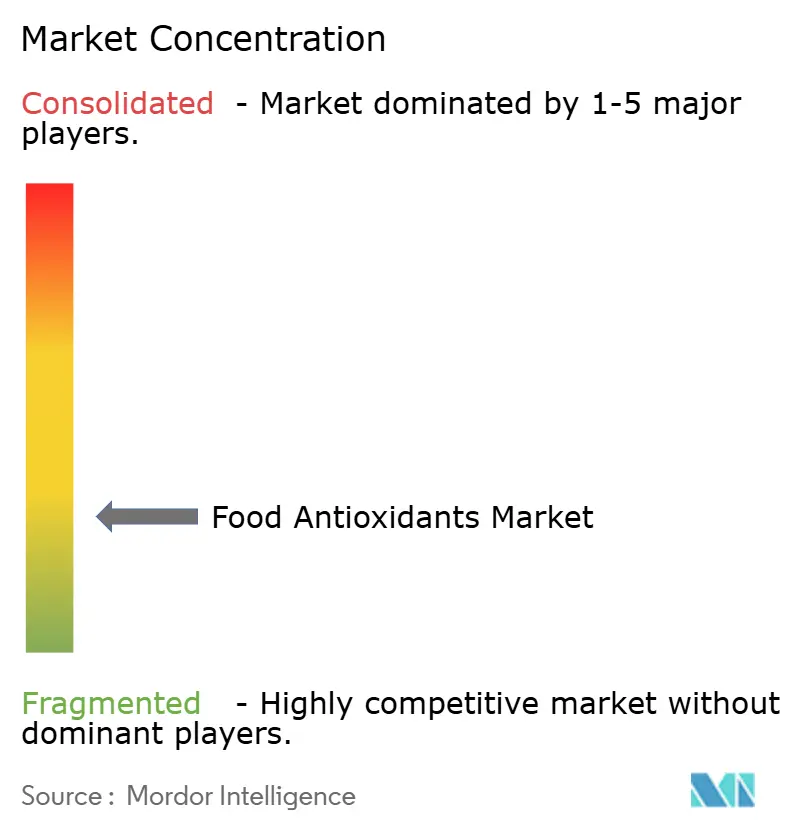
| Market Concentration | Low |
Major Players *Disclaimer: Major Players sorted in no particular order Image © Mordor Intelligence. Reuse requires attribution under CC BY 4.0. | |
Food Antioxidants Market Analysis by Mordor Intelligence
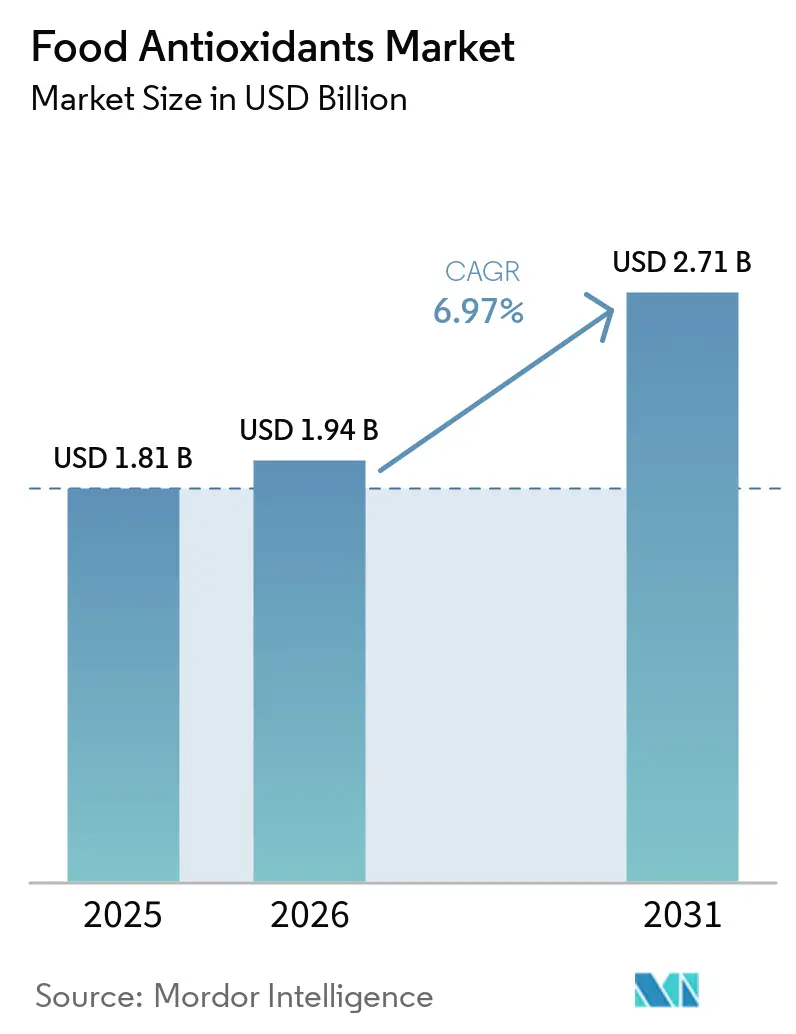
Food Antioxidants market size in 2026 is estimated at USD 1.94 billion, growing from 2025 value of USD 1.81 billion with 2031 projections showing USD 2.71 billion, growing at 6.97% CAGR over 2026-2031. This growth trajectory reflects the market's resilience amid shifting consumer preferences toward clean-label products and heightened awareness of oxidative deterioration in food products. The food antioxidants sector is experiencing a fundamental transformation as manufacturers pivot from synthetic to natural alternatives, responding to regulatory pressures and evolving consumer health consciousness. The convergence of food safety concerns, extended shelf-life requirements, and clean-label demands is driving innovation in delivery systems, with nanoencapsulation and liposome technologies enabling more efficient and targeted antioxidant applications in diverse food matrices.
Key Report Takeaways
- By type, synthetic antioxidants held 52.88% of the food antioxidants market share in 2025, while natural alternatives are forecast to grow at a 9.12% CAGR from 2026-2031.
- By source, chemically synthesized ingredients accounted for 35.12% of the food antioxidants market size in 2025; algae-based sources are on track for a 10.08% CAGR through 2031.
- By form, dry antioxidants captured 74.12% of the food antioxidants market in 2025, whereas liquid formats are set to expand at an 8.42% CAGR to 2031.
- By application, processed foods commanded 45.45% of the food antioxidants market size in 2025, and infant & clinical nutrition is poised for a 9.35% CAGR to 2031.
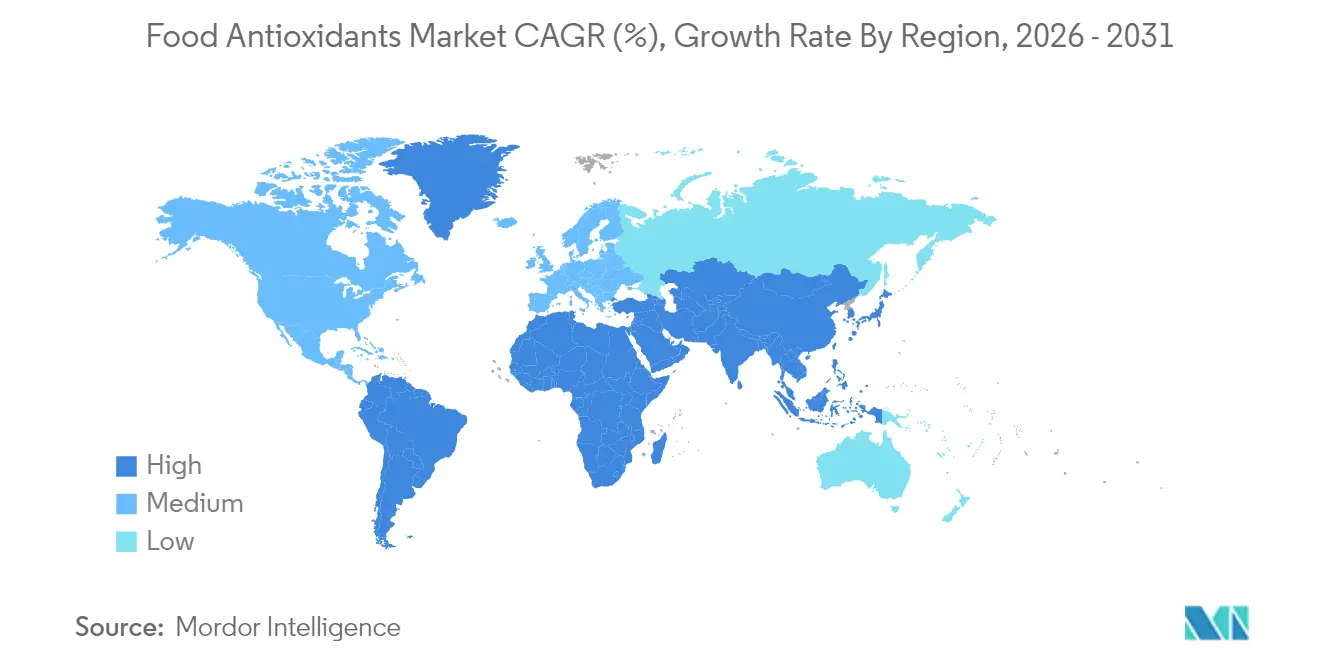
- By geography, Asia-Pacific led with 33.72% of the 2025 food antioxidants market share, while South America is projected to rise at an 8.01% CAGR through 2031.
Note: Market size and forecast figures in this report are generated using Mordor Intelligence’s proprietary estimation framework, updated with the latest available data and insights as of 2026.
Market Trends and Insights
Drivers Impact Analysis of Food Antioxidants Market*
| Driver | (~) % Impact on CAGR Forecast | Geographic Relevance | Impact Timeline |
|---|---|---|---|
| Expansion of processed and convenience food requiring extended shelf-life | +2.14% | Global, with concentration in North America, Europe, and Asia-Pacific | Medium term (2-4 years) |
| Regulatory approvals widening antioxidant usage across emerging markets | +1.52% | Asia-Pacific, South America, Middle East and Africa | Long term (≥ 4 years) |
| Growing functional food and nutraceutical launches formulated with antioxidants | +1.08% | North America, Europe, Asia-Pacific | Medium term (2-4 years) |
| Rising awareness about oxidative stress and age-related disorders | +0.95% | Global, with higher impact in developed regions | Long term (≥ 4 years) |
| Growing innovations in food processing and antioxidant formulations | +0.42% | North America, Europe, Asia-Pacific | Short term (≤ 2 years) |
| Rising consumer demand for natural antioxidants in clean-label foods | +0.33% | Global, with higher impact in North America and Europe | Medium term (2-4 years) |
| Source: Mordor Intelligence | |||
Expansion of Processed and Convenience Food Requiring Extended Shelf-life
The growth in processed and convenience food products is driving increased demand for antioxidant solutions that prevent oxidative deterioration and extend shelf life. Global urbanization and consumer preference for ready-to-eat options have prompted manufacturers to implement advanced antioxidant systems for maintaining product quality across distribution networks. The need for effective preservation methods has become particularly critical as supply chains lengthen and products require longer shelf stability. Antioxidants in processed foods now serve dual purposes - preserving products while protecting their nutritional value and sensory characteristics. The integration of these technologies has expanded the application scope of antioxidants across various food categories, including bakery, meat products, antioxidant beverages, and dairy items.
The food industry's focus on clean label ingredients has also influenced antioxidant selection, with natural alternatives gaining prominence over synthetic options. Technological developments in antioxidant delivery, such as microencapsulation and edible coatings, enable more precise and effective applications in complex food formulations. These advanced delivery systems improve the stability of antioxidant compounds and ensure their sustained release throughout the product's shelf life. The integration of these technologies has expanded the application scope of antioxidants across various food categories, including bakery, meat products, beverages, and dairy items.
Regulatory Approvals Widening Antioxidant Usage across Emerging Markets
Regulatory frameworks governing food antioxidants are evolving rapidly, creating both opportunities and challenges for market participants. Recent approvals, such as China's National Health Commission's authorization of hydroxytyrosol in August 2024, are expanding the toolkit available to food manufacturers in key emerging markets. These regulatory shifts are particularly significant in Asia-Pacific and South America, where growing middle-class populations are driving demand for processed foods with longer shelf lives.
The approval process for novel antioxidants is becoming more streamlined in many jurisdictions, with regulatory bodies increasingly recognizing the dual benefits of food waste reduction and enhanced nutritional preservation. However, manufacturers must navigate a complex patchwork of regional regulations, with the European Food Safety Authority (EFSA)[1] maintaining particularly stringent requirements for safety assessments of food additives, including antioxidants, in 2025. This regulatory diversification is creating competitive advantages for companies with robust regulatory affairs capabilities and global compliance expertise.
Growing Functional Food and Nutraceutical Launches Formulated with Antioxidants
The functional food and nutraceutical sectors are increasingly leveraging antioxidants not merely as preservatives but as bioactive ingredients with specific health benefits. This trend is transforming how antioxidants are positioned in product formulations, with marketing emphasis shifting from technical preservation functions to positive health attributes. Manufacturers are strategically incorporating antioxidant-rich ingredients like polyphenols, carotenoids, and tocopherols to create premium products with enhanced health positioning.
Recent clinical studies demonstrating the efficacy of specific antioxidants in addressing oxidative stress-related conditions are providing scientific substantiation for product claims, further driving consumer interest and market growth. The convergence of food preservation and health functionality is creating new product categories and reformulation opportunities across multiple food and beverage segments.
Rising Awareness About Oxidative Stress and Age-related Disorders
Consumer understanding of oxidative stress and its relationship to aging and chronic disease is reaching unprecedented levels, driving demand for antioxidant-rich foods and supplements. This awareness is transcending traditional health-conscious demographics, becoming mainstream knowledge that influences purchasing decisions across consumer segments. Recent research has strengthened the connection between dietary antioxidants and specific health outcomes.
This scientific validation is creating market opportunities for targeted antioxidant formulations addressing specific health concerns, moving beyond general wellness positioning. Food manufacturers are responding with innovative product concepts that highlight the protective benefits of antioxidants against cellular damage and premature aging. The trend is particularly pronounced in developed markets where aging populations are seeking preventative health solutions, but is rapidly expanding globally as health literacy improves in emerging economies.
Restraints Impact Analysis of Food Antioxidants Market*
| Restraint | (~) % Impact on CAGR | Geographic Relevance | Impact Timeline |
|---|---|---|---|
| Price volatility and limited supply of natural raw materials | -0.42% | Global, with higher impact in regions dependent on imports | Medium term (2-4 years) |
| Safety concerns and regulatory scrutiny of synthetic antioxidants | -0.33% | North America, Europe, developed Asia-Pacific markets | Long term (≥ 4 years) |
| Efficacy loss in plant-based meat analogues during processing | -0.28% | North America, Europe, Australia, developed Asia-Pacific markets | Medium term (2-4 years) |
| Competition from non-additive shelf-life technologies | -0.24% | Global, with higher impact in technologically advanced markets | Long term (≥ 4 years) |
| Source: Mordor Intelligence | |||
Price Volatility and Limited Supply of Natural Raw Materials
The shift toward natural antioxidants is creating supply chain vulnerabilities that threaten market growth and price stability. Natural antioxidant sources, including plant extracts, spices, and algae, are subject to agricultural variability, climate impacts, and geopolitical disruptions that synthetic alternatives largely avoid. This supply uncertainty is particularly challenging for food manufacturers accustomed to the consistent availability and pricing of synthetic antioxidants.
Manufacturers are responding by developing vertical integration strategies, investing in controlled cultivation of key botanical sources, and exploring novel extraction technologies to improve yield and reduce costs. The development of more stable, standardized natural antioxidant ingredients is becoming a strategic priority for suppliers seeking to overcome these supply chain challenges and provide food manufacturers with the reliability needed for large-scale commercial applications.
Safety Concerns and Regulatory Scrutiny of Synthetic Antioxidants
Synthetic antioxidants face mounting regulatory challenges and consumer skepticism despite their cost advantages and technical performance. Concerns regarding the safety of common synthetic antioxidants like BHA (butylated hydroxyanisole) and BHT (butylated hydroxytoluene) have intensified, with California's Food Safety Law[2] banning several synthetic food additives starting in 2025. These regulatory restrictions are compelling manufacturers to reformulate products, often at significant cost and technical complexity.
The scientific debate regarding the long-term safety of synthetic antioxidants remains contentious, with some studies suggesting potential health risks while others affirm their safety at permitted usage levels. This regulatory uncertainty creates market hesitation and investment risk, particularly for multinational companies navigating diverse regional requirements. The clean label movement has further accelerated the shift away from synthetic antioxidants, with consumers increasingly rejecting ingredients perceived as artificial regardless of their regulatory status or safety profile.
*Our forecasts treat driver/restraint impacts as directional, not additive. The impact forecasts reflect baseline growth, mix effects, and variable interactions.
Food Antioxidants Market Segment Analysis
By Type:
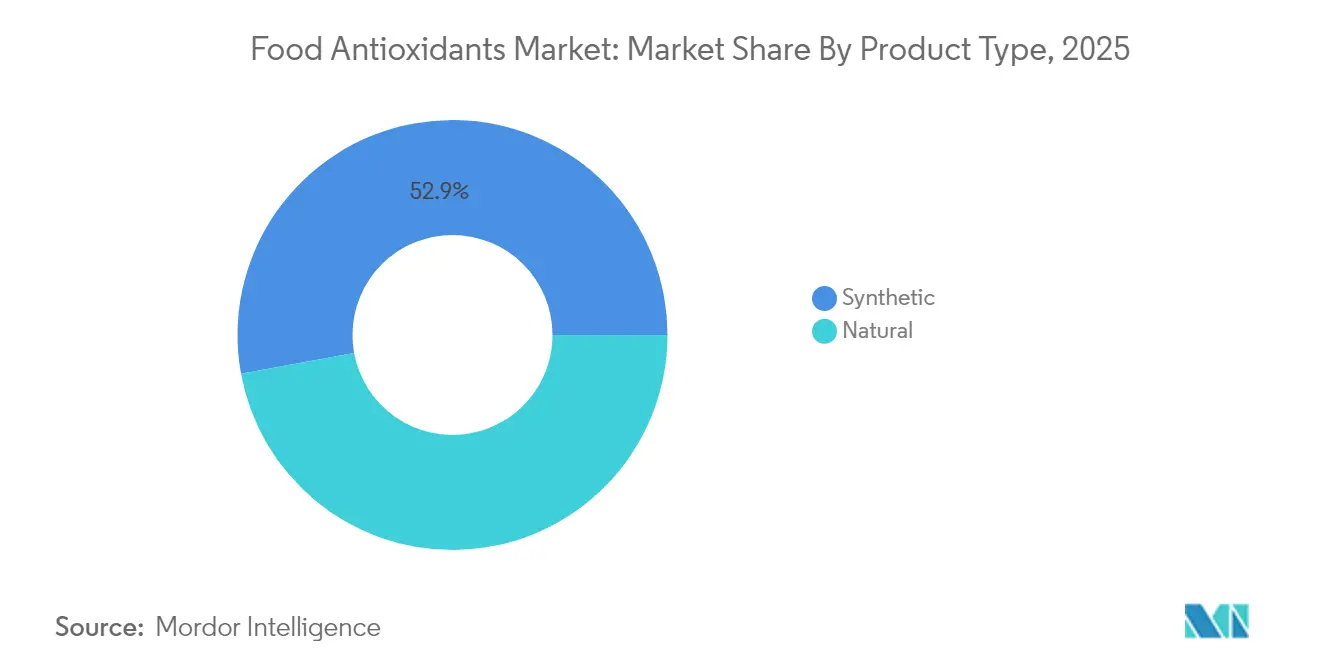
Natural Antioxidants are Gaining Momentum, While Synthetic Maintain Market LeadershipSynthetic antioxidants maintain their market leadership with a 52.88% share in 2025, driven by their cost-effectiveness, stability, and established performance in food preservation applications. However, the market is witnessing a pronounced shift as natural antioxidants are projected to grow at a CAGR of 9.12% from 2026-2031, significantly outpacing the overall market growth rate. This transition is fueled by mounting consumer demand for clean-label products and increasing regulatory scrutiny of synthetic alternatives like BHA and BHT. The natural segment encompasses diverse antioxidant classes, including carotenoids, tocopherols, ascorbates, and polyphenols, each offering unique functional properties and application advantages.
The competitive dynamics between natural and synthetic segments are evolving rapidly, with technological innovations narrowing the performance gap that has historically favored synthetic options. Recent advancements in extraction technologies and formulation science have enhanced the stability and efficacy of natural antioxidants, making them viable alternatives in applications previously dominated by synthetic options. Within the natural segment, polyphenols are emerging as particularly promising due to their potent antioxidant activity and additional health benefits, creating opportunities for value-added product positioning beyond simple preservation claims.

By Source:
Algae-based Solutions are Gaining MomentumThe chemically synthesized source segment leads the market with a 35.12% share in 2025, benefiting from established manufacturing infrastructure and consistent quality attributes. However, algae-based antioxidants are revolutionizing the market with a projected CAGR of 10.08% from 2026-2031, the highest growth rate among all source segments. This exceptional growth is driven by the unique advantages of microalgae as antioxidant producers, including their sustainability credentials, high bioactive compound concentration, and ability to be cultivated on non-arable land without competing with traditional agriculture. Plant extracts maintain a significant market position, offering familiar natural options derived from rosemary, green tea, and other botanical sources.
Technological advancements in microalgae cultivation are accelerating this trend, with innovations in photobioreactors and harvesting techniques improving production efficiency and reducing costs. The "other" source segment, which includes animal-derived antioxidants and novel sources like bacterial fermentation products, represents a small but innovative portion of the market with specialized applications in premium food products.
By Form:
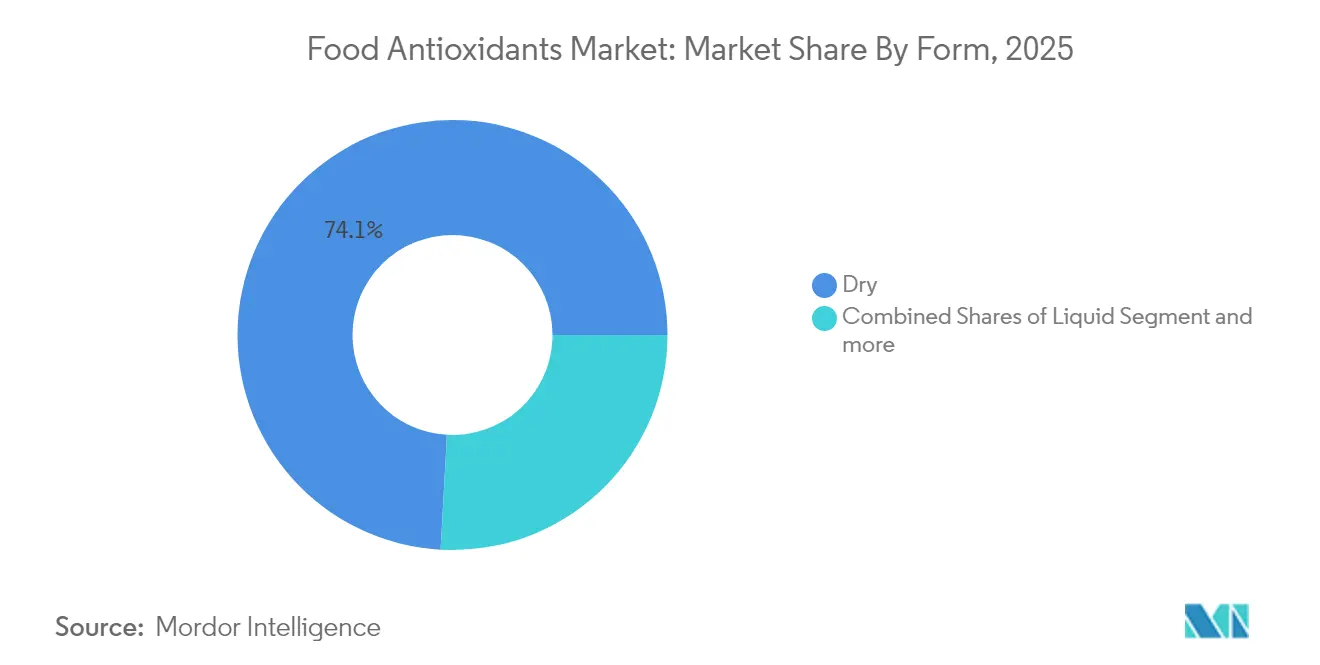
Dry Formulations Dominate Through Stability AdvantagesDry antioxidant formulations command 74.12% of the market in 2025, valued for their extended shelf life, ease of handling, and precise dosing capabilities in food manufacturing environments. This dominance is particularly pronounced in applications requiring extended storage periods or distribution through complex supply chains where moisture sensitivity is a concern. Despite this leadership position, liquid antioxidants are gaining momentum with a projected CAGR of 8.42% from 2026-2031, driven by their superior dispersion characteristics in certain food matrices and emerging applications in beverage formulations. The "other" form segment, which includes novel delivery systems such as emulsions and microencapsulated formats, represents a small but rapidly evolving portion of the market.
Innovations in dry antioxidant technology are reinforcing this segment's market position, with advancements in particle engineering enhancing dispersibility and efficacy. Microencapsulation techniques are increasingly employed to protect sensitive antioxidant compounds from degradation while enabling controlled release in food applications. Liquid antioxidants are finding particular success in oil-based applications and beverages where uniform distribution is critical, with emulsion technologies enabling the incorporation of water-soluble antioxidants into lipid systems. The market is witnessing increased customization of antioxidant forms to match specific application requirements, with suppliers developing tailored solutions for different food matrices and processing conditions.
By Application:
Infant and Clinical Nutrition gains momentum supported by scientific researchProcessed foods constitute the largest application segment with 45.45% market share in 2025, encompassing diverse categories including bakery, confectionery, snacks, meat, poultry, and dairy products. The susceptibility of these products to oxidative deterioration, particularly those with high fat content, drives substantial antioxidant demand. Emerging research indicates that innovative antioxidant applications in processed meats can significantly reduce the formation of potentially harmful compounds during cooking, addressing both preservation and food safety concerns. Beverages represent another significant application segment, with antioxidants playing dual roles in preserving product quality and delivering functional benefits in health-positioned drinks.
Infant and clinical nutrition is emerging as the fastest-growing application segment with a projected CAGR of 9.35% from 2026-2031, reflecting increasing scientific evidence linking antioxidants to developmental benefits and immune support in early life. Recent research has demonstrated that antioxidants in infant formulas can enhance cognitive development and provide protective effects against oxidative stress-related conditions, according to the DSM-Firmenich 2025 report. The fats and oils segment maintains a significant market share, as these products are particularly vulnerable to oxidation and rancidity. The "others" application segment encompasses emerging uses in pet food, animal feed, and specialized nutritional products, representing diverse growth opportunities beyond traditional food applications.
Geography Analysis
APAC Food Antioxidants Market
Asia-Pacific dominates the Food Antioxidants Market with a 33.72% share in 2025, driven by rapid urbanization, expanding food processing industries, and increasing consumer awareness of food safety and quality. China leads regional consumption, with its food antioxidant market bolstered by regulatory developments, including the National Health Commission's approval of five new food raw materials and eight new food additives in February 2025, expanding the toolkit available to manufacturers. India is emerging as a high-growth market within the region. Japan's mature market is characterized by sophisticated consumer preferences for clean-label products and natural preservation solutions, driving innovation in plant-based antioxidants. The region's growth is further supported by the increasing adoption of Western dietary patterns and the expansion of convenience food sectors across developing economies.
The Americas and EMEA Food Antioxidants Market
North America represents the second-largest regional market, characterized by advanced regulatory frameworks and consumer-driven demand for natural antioxidants. Europe follows closely, with its market distinguished by stringent regulatory oversight from the European Food Safety Authority (EFSA) and strong consumer preference for clean-label products. Key markets within Europe include Germany, France, the UK, and the Netherlands, which are significant importers of natural additives and centers for food innovation. South America is emerging as the fastest-growing region with a projected CAGR of 8.01% from 2026-2031. The region's growth is fueled by increasing exports of processed foods, rising domestic consumption of packaged products, and a growing focus on natural ingredients. Argentina's food industry is increasingly focused on value-added exports, creating opportunities for antioxidant applications in shelf-life extension of premium products. The Middle East and Africa region, while currently the smallest market, is showing promising growth potential driven by urbanization, increasing disposable incomes, and the expansion of modern retail formats that favor packaged foods with extended shelf lives.
Regulatory Landscape
Food antioxidants are regulated as food additives in major markets, with approvals and use conditions tied to demonstrated safety and dietary exposure. In the European Union, Regulation (EC) No 1333/2008 provides the core framework for food additives, including antioxidants, and the European Food Safety Authority (EFSA) continues systematic re-evaluation of legacy authorizations; as of February 2026, EFSA re-evaluation activity covered 315 additives authorized before January 2009, reinforcing the need for updated dossiers and data packages when maintaining or expanding uses.
In the United States, the FDA regulates direct food additives under Title 21 CFR Part 172 (including specified antioxidant use limits such as 0.02% of the oil or fat content for certain uses), alongside food additive petition and GRAS pathways. In May 2026, the FDA requested updated information related to BHT usage, including market share and exposure data, signaling greater emphasis on post-market data collection for widely used synthetic antioxidants. Across jurisdictions, the tightening of data requirements and ongoing re-evaluations is increasing the compliance workload for suppliers and shaping formulation decisions in favor of well-documented antioxidant systems.
Value Chain Analysis
The food antioxidants value chain starts with feedstocks from agriculture, marine/algae cultivation, and petrochemical intermediates, followed by extraction and purification (for plant extracts, tocopherols, carotenoids, and polyphenols) or chemical synthesis (for BHA, BHT, TBHQ and related antioxidants). Ingredient manufacturers then standardize and formulate antioxidants into dry, liquid, or specialty delivery formats (including microencapsulated or emulsified systems) suited to specific food matrices, before moving through distributors and compounders to food and beverage manufacturers for incorporation into processed foods, beverages, fats and oils, and infant and clinical nutrition.
Key friction points concentrate in raw-material availability and logistics. The 2026 supply shocks highlighted vulnerability to geopolitical and regional disruptions, including maritime chokepoints affecting upstream chemical supply chains and the Sudan conflict disrupting gum acacia (E414) supply, which can influence formulation choices and inventory strategies in broader food-ingredient systems. As a result, suppliers increasingly emphasize multi-origin sourcing, tighter quality documentation, and application support for reformulation, while large food manufacturers manage risk through dual sourcing, safety stocks, and greater use of standardized natural extracts and tocopherol systems where supply and specifications can be secured.
Competitive Landscape
The Food Antioxidants Market exhibits fragmented concentration, with leading players like BASF SE, Archer Daniels Midland Company, Cargill Incorporated, Advanced Organic Materials, Inc., and DSM Firmenich commanding significant market share through their comprehensive product portfolios and global distribution networks. The competitive dynamics are evolving as specialized players like Kalsec Inc. and Kemin Industries leverage their expertise in natural extraction technologies to gain market share in premium segments, creating a more fragmented competitive landscape in the natural antioxidants category.
Strategic partnerships and acquisitions are reshaping the competitive environment, as companies seek to expand their technological capabilities and access to sustainable raw material sources. Vertical integration strategies are becoming increasingly common, particularly for natural antioxidant production, where control over botanical supply chains provides competitive advantages in consistency and cost management. Innovation is centered on enhancing the efficacy and stability of natural antioxidants, with significant R&D investments in delivery systems, including microencapsulation and emulsion technologies.
A recent patent filed by a leading ingredient company describes a novel process for enhancing the stability of rosemary extract in high-temperature applications, potentially expanding its use in baked goods and fried products where synthetic antioxidants have traditionally dominated. White space opportunities exist in developing specialized antioxidant solutions for emerging food categories such as plant-based proteins, where oxidation challenges differ from traditional applications and require tailored approaches to maintain product quality and consumer acceptance.
Food Antioxidants Industry Leaders
-
Cargill Incorporated
-
Archer Daniels Midland Company
-
BASF SE
-
Advanced Organic Materials, S.A.
-
DSM-Firmenich
- *Disclaimer: Major Players sorted in no particular order
Food Antioxidants Market Companies Covered in this Report
- BASF SE
- Archer-Daniels-Midland Company (ADM)
- Cargill Incorporated
- International Flavors and Fragrances Inc.
- DSM-Firmenich
- Eastman Chemical Company
- Kalsec Inc.
- Kemin Industries Inc.
- Advanced Organic Materials S.A.
- Camlin Fine Sciences Ltd.
- BTSA Biotecnologías Aplicadas
- Vitablend Nederland B.V.
- Naturex (Givaudan)
- Kerry Group plc
- Galactic S.A.
- Lycored Corp.
- Algatech Ltd.
- Prinova Group LLC
- Barentz International
Market Opportunities and Future Outlook
Opportunities are concentrated where regulatory scrutiny and re-evaluation programs intersect with demand for clean-label reformulation. EFSA's ongoing food additive re-evaluation work (under EU rules including Regulation (EC) No 1333/2008) and the FDA's May 2026 information request on BHT create a stronger premium on antioxidants with robust safety documentation, traceable sourcing, and clear exposure and stability data. This supports whitespace for suppliers that can translate regulatory requirements into application-ready solutions for processed foods and fats and oils, where oxidation control is tightly linked to shelf life and sensory stability.
Natural antioxidant systems offer a second, evidence-backed opportunity area tied to supply resilience and technical performance in complex formulations. Company actions in 2026 underline investment in reformulation support capabilities: ADM completed a USD 26 million expansion of its Erlanger, Kentucky, flavor and color innovation campus to support food and beverage reformulation, aligning with industry needs for integrated solutions that combine taste, color, and preservation in cleaner labels. Strategic moves that improve access to natural ingredient streams and application-specific blending (including tocopherol and botanical platforms) also address the market constraint of natural raw-material volatility noted across the sector.
Recent Industry Developments in Food Antioxidants Market
- May 2026: The US FDA issued a Federal Register notice requesting updated information on BHT (butylated hydroxytoluene), including usage and dietary exposure-related inputs, as part of its post-market information gathering. The action increased compliance focus on synthetic antioxidants and encouraged suppliers to strengthen documentation packages and customer-facing stewardship for legacy additives.
- January 2026: Archer Daniels Midland Company completed a USD 26 million expansion of its Erlanger, Kentucky, flavor and color innovation campus, adding 3,600 square feet to support food and beverage reformulation work. The site upgrade strengthened ADM's ability to develop and scale clean-label systems where antioxidant performance is delivered alongside taste and color optimization.
- December 2024: BASF SE signed a binding agreement to divest its Food and Health Performance Ingredients business, including the Illertissen, Germany production site, to Louis Dreyfus Company. The transaction reshaped supply-side positioning in selected nutrition and health ingredient lines and signaled portfolio refocusing among large ingredient suppliers.
Food Antioxidants Market Report Scope and Research Methodology
Market Definition and Coverage
This market covers food-grade antioxidant ingredients that are added to human food and beverages to slow oxidation and improve shelf life during processing, storage, and distribution. We size the market as revenue generated from these antioxidant additives sold for food use.
Scope exclusions: Feed antioxidants, nutraceutical capsules, cosmetics, fuels, and polymer stabilizers are excluded.
Segments Covered in This Report
- By Type
- Natural
- Carotenoids
- Tocopherols
- Ascorbates
- Polyphenols
- Others
- Synthetic
- Natural
- By Source
- Plant Extracts
- Algae-based
- Chemically-Synthesized
- Others
- By Form
- Dry
- Liquid
- Others
- By Application
- Processed Foods
- Bakery and Confectionery
- Snack Products
- Meat and Poultry
- Dairy and Frozen Desserts
- Other Processed Foods
- Beverages
- Fats and Oils
- Infant and Clinical Nutrition
- Others
- Processed Foods
- By Geography
- North America
- United States
- Canada
- Mexico
- Rest of North America
- Europe
- Germany
- United Kingdom
- Italy
- France
- Spain
- Netherlands
- Rest of Europe
- Asia-Pacific
- China
- India
- Japan
- Australia
- Rest of Asia-Pacific
- South America
- Brazil
- Argentina
- Rest of South America
- Middle East and Africa
- South Africa
- Saudi Arabia
- United Arab Emirates
- Rest of Middle East and Africa
- North America
Data Sources, Market Sizing, and Validation
Desk Research
Desk research was used to build the first layer of the model and to ensure the scope stayed limited to food-grade usage. We typically start with public regulatory and safety references, such as FDA food additive information, EFSA opinions, and Codex Alimentarius guidance, and then align these definitions with what is used in association and standards documents.
To quantify demand signals, we also review public food processing and trade indicators, such as USDA and Eurostat statistics, UN Comtrade trade flows for key antioxidant chemicals and natural extracts (where classification allows), and relevant peer reviewed food science journals for usage rates and stability needs by food type. Company filings, investor presentations, and reputable press are then used to cross-check capacity moves, pricing direction, and formulation trends, with paid subscriptions for company financials and patent databases where needed. These examples are not exhaustive, and many other sources were also used for data collection, validation, and clarification.
Primary Interviews and Surveys
Primary work focused on validating how antioxidants are used and purchased across major food manufacturing categories, and on checking how price and mix have been changing for natural versus synthetic options. We spoke with a balanced set of raw material suppliers, ingredient blenders, distributors, and food manufacturers across APAC, EMEA, and the Americas so that assumptions from desk work could be confirmed and adjusted where practical.
Distribution of primary research fieldwork respondents
| Company type | Respondent position | Region |
|---|---|---|
| Top tier: 25% | CXOs: 15% | APAC: 44% |
| Mid tier: 59% | Functional/Unit leaders: 25% | EMEA: 29% |
| Smaller Players: 16% | Managers: 60% | Americas: 27% |
Market-Sizing & Forecasting
Sizing starts with a top-down build where food additive demand is reconstructed from the packaged food output base, the typical antioxidant inclusion rates by food group, and the penetration split between natural and synthetic systems, which is then converted into revenue using observed price bands. To keep the totals realistic, the model is corroborated through selective bottom-up checks, such as rolling up a sample of supplier revenues tied to food-grade antioxidant portfolios and testing implied volumes against trade and production signals.
Inputs used in the model include processed food production growth by region, edible oils and fats throughput (a high antioxidant use area), shelf-life and oxidation sensitivity of key categories, regulatory acceptance and labeling pressure that shifts mix, and observed price movements for common antioxidant chemistries and natural extracts. Where a bottom-up view has gaps, the missing part is filled using conservative distribution channel splits and normalized price assumptions, and then rechecked with interview feedback.
For forecasting, scenario analysis is used because mix change is a key driver and it does not move in a straight line. Base, conservative, and accelerated cases are built around clean-label reformulation speed, inflation in ingredient pricing, and regional packaged food growth, and then the final forecast is selected after expert consensus checks.
Data Validation & Update Cycle
Outputs are validated through triangulation across independent signals, not just by matching one published number. We run variance checks by region and by major application logic, so sudden jumps in implied usage rates or pricing get flagged and corrected before sign-off.
A multi-step review is followed, including peer checks on scope, units, and conversion logic, and then a final analyst pass that focuses on year alignment and currency consistency. Reports are refreshed annually, and interim updates are triggered when material events occur, such as regulatory changes, major capacity additions, or sharp input price moves, so clients receive a current view at the time of delivery.
Mordor Intelligence's Food Antioxidants Market Sizing Compared With Other Published Estimates
Published market values for food antioxidants do not always match because each study draws the line differently on what counts as food-grade demand and how pricing is averaged across natural and synthetic ingredient systems. Timing also matters, since some sources anchor on a different base year and then project forward using assumptions that are not always visible.
Some estimates fold in adjacent uses like pet food or non-food antioxidant demand and then apply a broad average price, but Mordor Intelligence counts only food-grade antioxidants used in human food and beverages and excludes feed and non-food applications, which keeps the total tied to a more specific demand pool.
Benchmark comparison
| Source | Market Size | Gaps in Research Methodology |
|---|---|---|
| Mordor Intelligence | USD 1.94 B (2026) | |
| Global Consultancy A | USD 2.38 B (2025) | The scope appears broader for end uses, and pet food is presented within applications, which can lift the total versus a human food only definition. The base year also differs, and the pricing mix between natural and synthetic systems is not clearly explained. |
| Industry Publisher B | USD 1.72 B (2024) | The estimate is anchored on an earlier base year, and the scope description is high level, which can understate the market if mix upgrades to higher priced natural antioxidants are not fully captured. Limited visibility on how regional consumption and average pricing were normalized can also compress the final value. |
Across the three figures, most of the spread comes from end-use inclusion choices and base-year timing, followed by how average prices are blended across ingredient types. By keeping scope limited to human food usage and tying revenue to observable production and pricing signals, the resulting value stays transparent and repeatable when assumptions are revisited.
Key Questions Answered in the Report
What is the current Food Antioxidants Market size?
The food antioxidants market is worth USD 1.94 billion in 2026 and is projected to hit USD 2.71 billion by 2031.
Which region leads global demand?
Asia-Pacific holds the largest share at 33.72% in 2025, driven by China’s regulatory approvals and expanding processed-food sectors.
Which application is growing the fastest?
Infant and clinical nutrition shows the highest growth, with a 9.35% CAGR forecast for 2026-2031.
Why are natural antioxidants gaining traction?
Clean-label preferences, safety concerns over synthetic additives, and supportive regulatory changes are moving manufacturers toward plant-based and algae-derived options.