
Folic Acid Market Size and Share
Market Overview
| Study Period | 2021 - 2031 |
|---|---|
| Market Size (2026) | USD 1.1 Billion |
| Market Size (2031) | USD 1.37 Billion |
| Growth Rate (2026 - 2031) | 4.49 % |
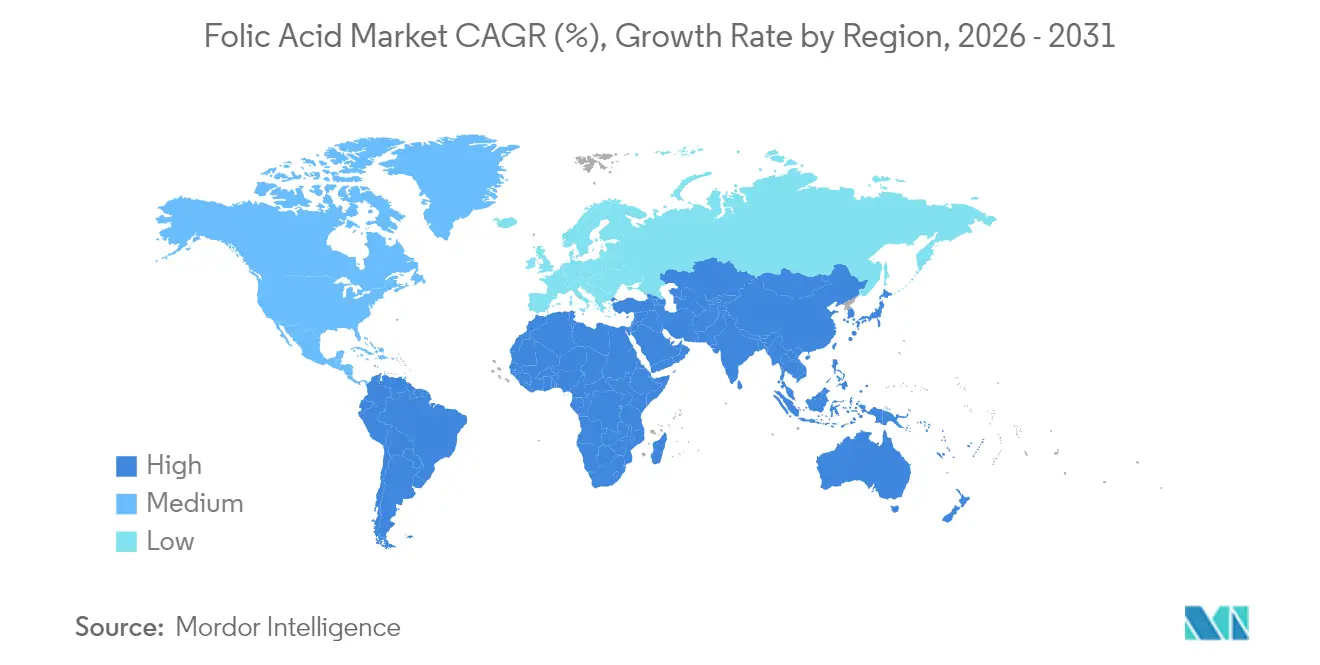
| Fastest Growing Market | South America |
| Largest Market | Asia Pacific |
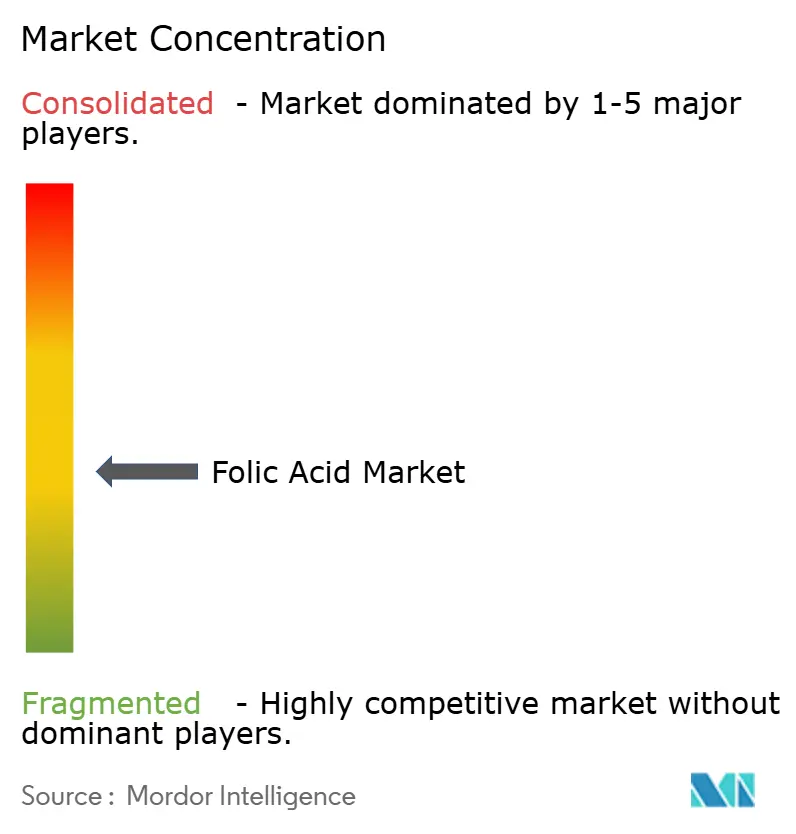
| Market Concentration | Medium |
Major Players *Disclaimer: Major Players sorted in no particular order Image © Mordor Intelligence. Reuse requires attribution under CC BY 4.0. | |
Folic Acid Market Analysis by Mordor Intelligence
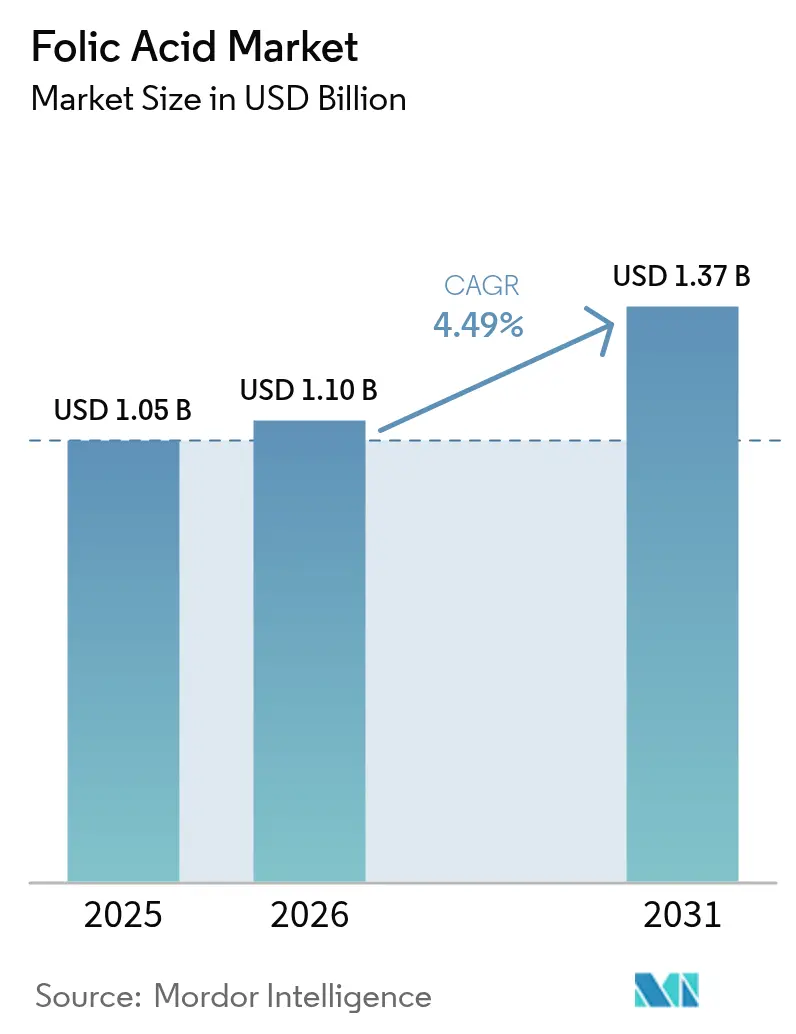
The folic acid market size is expected to grow from USD 1.05 billion in 2025 to USD 1.1 billion in 2026 and is forecast to reach USD 1.37 billion by 2031 at 4.49% CAGR over 2026-2031. This steady expansion is built on mandatory fortification policies, higher anemia prevalence, and the pharmaceutical sector’s widening use of high-purity folic acid in biopharmaceutical manufacturing [1]. Regulatory momentum is reshaping demand: the United Kingdom’s decision to enrich non-wholemeal wheat flour by December 2026 anchors a multiyear uptick in raw material offtake that buffers the folic acid market against economic cycles. At the same time, functional foods and fermentation-derived folate ingredients are gaining traction as consumers shift toward clean-label nutrition and seek bioavailable options tailored to MTHFR genetic variants. South America illustrates a different yet complementary growth engine; Brazil’s long-standing flour mandate and expanding neural-tube-defect prevention programs underpin regional gains that outpace the global average. Cost volatility in para-aminobenzoic acid inputs, coupled with tighter oversight of unmetabolized folic acid exposure, adds operating complexity that favors manufacturers able to secure raw material supply, execute fermentation scale-ups, and navigate evolving label rules.
Key Report Takeaways
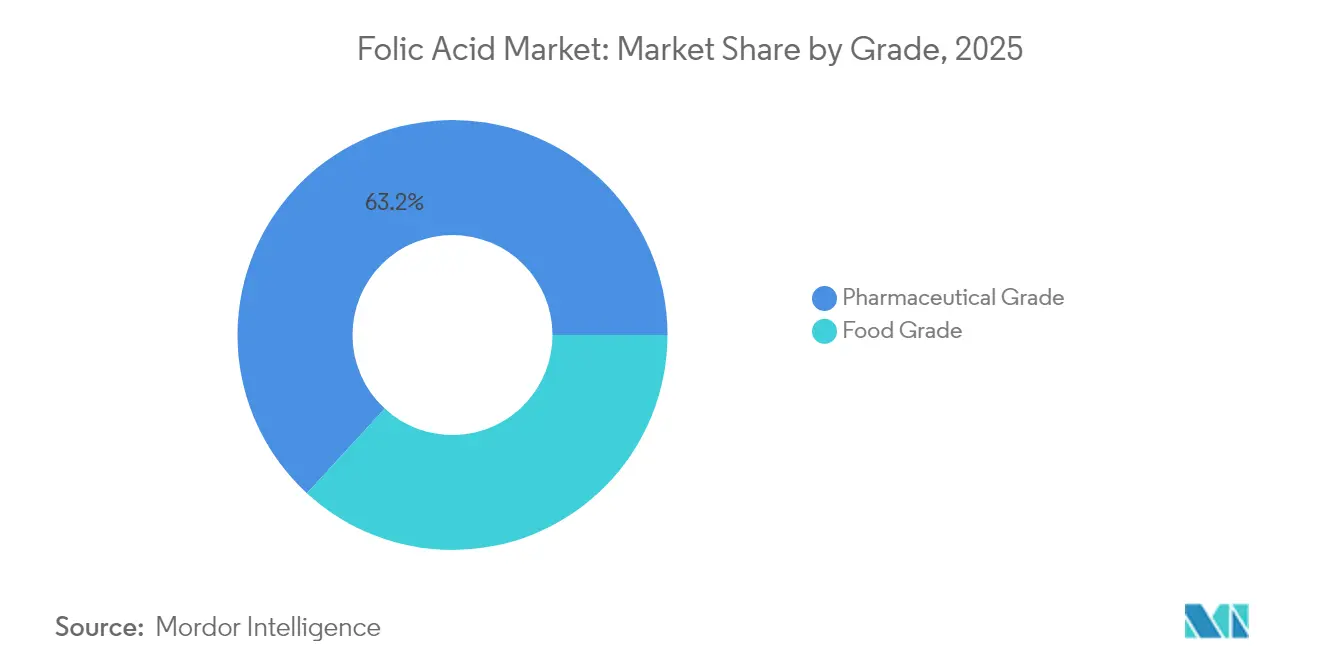
- By grade, pharmaceutical grade dominated with a 63.16% share of the folic acid market in 2025, while the food grade segment is expected to grow at a 6.17% CAGR through 2031.
- By source, the chemical synthesis segment led with 90.77% of the folic acid market in 2025, with the fermentation-derived segment projected to achieve the highest CAGR at 8.02% through 2031.
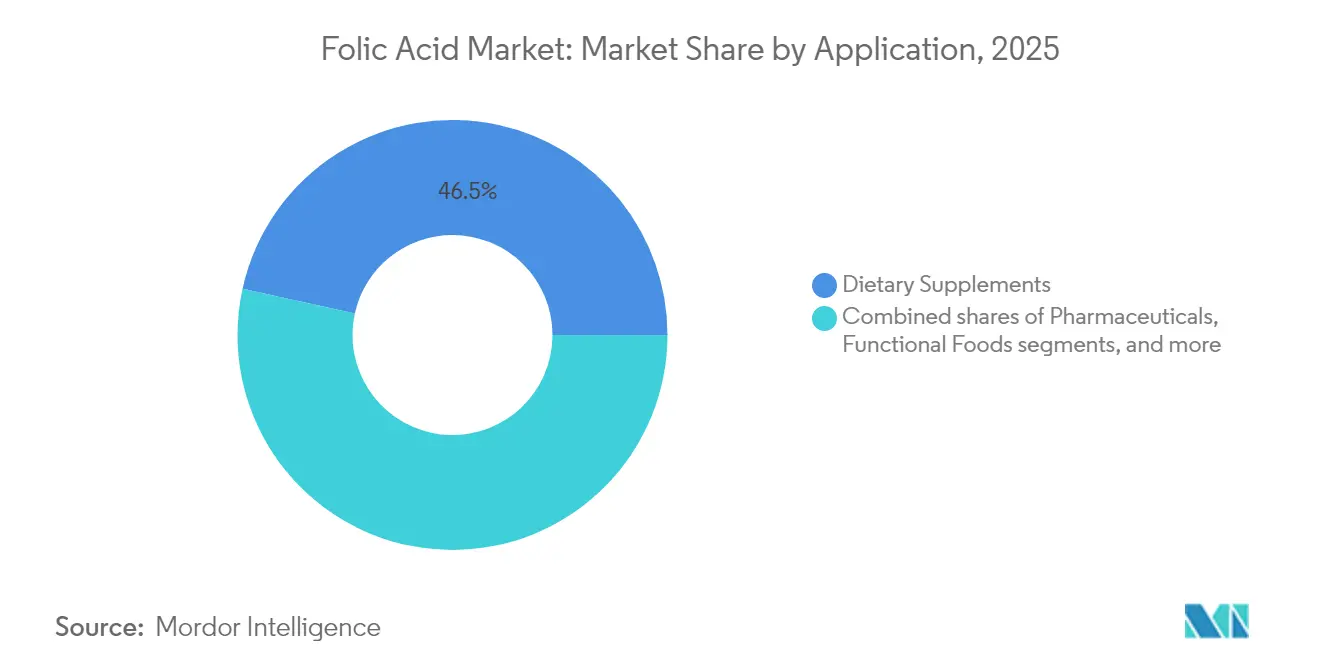
- By application, the dietary supplements segment led with 46.54% market share in 2025, while functional foods are projected to expand at a 6.2% CAGR through 2031.
- By geography, Asia-Pacific commanded 38.07% of the folic acid market in 2025, with South America projected to achieve the highest regional growth rate at 6.73% CAGR through 2031
Note: Market size and forecast figures in this report are generated using Mordor Intelligence’s proprietary estimation framework, updated with the latest available data and insights as of 2026.
Market Trends and Insights
Drivers Impact Analysis of Folic Acid Market*
| Driver | (~) % Impact on CAGR Forecast | Geographic Relevance | Impact Timeline |
|---|---|---|---|
| Mandatory folic acid fortification policies fueling demand for folic acid | +1.2% | Global, with early gains in United Kingdom, Australia, Brazil | Medium term (2-4 years) |
| Increase in prenatal supplement uptake | +0.8% | North America and Europe, Asia-Pacific core | Short term (≤ 2 years) |
| Increased prevalence of anemia and deficiency disorders | +0.9% | Global, concentrated in Sub-Saharan Africa, South Asia | Long term (≥ 4 years) |
| Expansion of functional foods and beverages | +0.7% | Asia-Pacific core, spill-over to North America | Medium term (2-4 years) |
| Growth of clean-label vegan vitamins driving plant-derived folic acid ingredients | +0.6% | North America and Europe, emerging in Asia-Pacific | Long term (≥ 4 years) |
| Rise in the adoption of high-purity folic acid for biopharmaceutical applications | +0.4% | Global, concentrated in developed markets | Medium term (2-4 years) |
| Source: Mordor Intelligence | |||
Mandatory folate fortification policies fueling demand for folic acid
Government mandates for flour fortification maintain consistent market demand, independent of economic cycles and consumer trends. These regulations require manufacturers to add specific nutrients to flour products to address public health concerns and nutritional deficiencies in the population. The United Kingdom's mandate for folic acid fortification in non-wholemeal wheat flour, effective December 2026, aims to prevent 200 neural tube defects annually and generate USD 25 million in NHS cost savings over a decade. This initiative aligns with global public health objectives and demonstrates the increasing focus on preventive healthcare measures through food fortification. The expansion of fortification regulations across 142 countries as of 2024 enables manufacturers to confidently invest in production capacity and technology upgrades. This widespread adoption creates a stable regulatory environment that supports long-term planning and development in the flour fortification industry.
Increase in prenatal supplement uptake
The growing awareness of maternal health has driven increased adoption of folic acid supplementation across all income segments, particularly among health-conscious consumers and expectant mothers. According to the Centers for Disease Control and Prevention's 2024 data, anemia affects approximately 13.0% of females in the United States compared to 5.5% of males, emphasizing the importance of gender-specific nutritional interventions and preventive healthcare measures [2]. This demographic trend has generated robust demand in market segments with reduced price sensitivity and high brand loyalty, especially in premium supplement categories and physician-recommended products. Scientific evidence demonstrating that adequate folate intake during pregnancy reduces neural tube defects, cardiovascular complications, and other pregnancy-related health issues has reinforced medical guidelines for supplementation throughout pregnancy and preconception periods. The demand for folic acid supplements has expanded beyond developed countries, with emerging economies experiencing urbanization and better healthcare access, creating new consumer bases focused on prenatal nutrition and preventive healthcare practices. This expansion has been particularly notable in regions with improving healthcare infrastructure and rising disposable incomes.
Increased prevalence of anemia and deficiency disorders
Anemia affects millions of people worldwide, persisting as a significant global health challenge despite established treatment programs that heavily rely on folic acid supplementation. The limitations of current folic acid-based solutions present market opportunities for pharmaceutical companies to develop improved absorption formulations and targeted delivery methods, particularly in addressing folate deficiency anemia. Healthcare organizations are increasing investments in prevention programs and new therapeutic solutions, including enhanced folic acid supplements and combination therapies, due to anemia's economic impact through reduced workplace productivity and higher medical costs. The increased understanding of anemia's effects on health and economic output is driving greater demand for effective folic acid treatments, particularly those with superior bioavailability and absorption rates, in healthcare markets. The development of novel folic acid delivery systems and fortification strategies has become a key focus for pharmaceutical companies seeking to address the growing global burden of anemia.
Expansion of functional foods and beverages
Consumers are increasingly seeking health-enhanced foods, creating new opportunities for folate fortification beyond traditional supplement formats. The functional beverage market is growing as consumers become more health-conscious and modify their dietary habits, with folic acid supplementation becoming a key focus. Food and beverage companies are incorporating essential vitamins, minerals, and bioactive compounds, including folate, to enhance their products' nutritional value. As companies reduce sugar content in beverages to meet consumer preferences, they are developing methods to incorporate nutrients, particularly folic acid, while maintaining product appeal. The increase in plant-based diets, driven by veganism and lactose intolerance, has created a need for additional folate fortification since plant-based alternatives contain less folate than animal-derived products. Manufacturers can achieve higher profit margins through functional foods while providing consumers with convenient access to essential nutrients, including folate. The FDA's regulatory framework supports this trend by permitting companies to make specific health claims regarding folate's role in preventing neural tube defects [3].
Restraints Impact Analysis of Folic Acid Market*
| Restraint | (~) % Impact on CAGR Forecast | Geographic Relevance | Impact Timeline |
|---|---|---|---|
| Stability issues of folic acid in high-temperature food processing limiting its application in fortified snacks | -0.3% | Global, particularly in processed food manufacturing | Medium term (2-4 years) |
| Stringent regulatory approvals and labeling requirements | -0.4% | North America and Europe, expanding to Asia-Pacific | Short term (≤ 2 years) |
| Risk of overconsumption and unmetabolized folic acid | -0.5% | Global, concentrated in developed markets | Long term (≥ 4 years) |
| Price volatility of raw materials | -0.6% | Global, with supply chain concentration in China | Short term (≤ 2 years) |
| Source: Mordor Intelligence | |||
Stability issues of folates in high-temperature food processing limiting its application in fortified snacks
Thermal degradation of folic acid during food processing limits fortification applications in products manufactured at high temperatures. Studies show that folic acid maintains stability under anaerobic conditions but undergoes significant degradation when exposed to oxygen, with 5-methyl-5,6,7,8-tetrahydrofolate being particularly susceptible to heat. Folic acid losses occur through diffusion and thermal degradation, with diffusivity constants varying across different food matrices. This technical challenge limits folic acid addition in popular snack categories such as extruded cereals, baked goods, and fried products that require high-temperature processing for texture development and shelf stability. Manufacturers must balance processing requirements with nutrient retention, often needing to over-fortify to offset processing losses, which raises costs and regulatory complexities. This limitation especially affects emerging markets where processed snacks are growing in popularity but lack the technical capabilities for controlled-atmosphere processing or post-processing fortification methods.
Risk of overconsumption and unmetabolized folic acid
Health authorities are implementing stricter regulations on folic acid due to its increasing accumulation in populations, while consumer health concerns affect market growth. The health implications include potential masking of vitamin B-12 deficiency, which can lead to neurological complications, and possible cancer risks associated with excessive folic acid intake. Individuals with the MTHFR genetic variation face particular challenges as they cannot effectively convert folic acid into its usable form, methylfolate, resulting in accumulation in their bloodstream and potential adverse effects. Regulatory bodies have responded by enhancing labeling requirements and evaluating intake limits, which may restrict fortification levels in staple foods and supplement concentrations, especially in regions with mandatory food fortification programs. These regulatory changes aim to balance the benefits of folic acid fortification in preventing birth defects with the potential risks of overconsumption in the general population.
*Our forecasts treat driver/restraint impacts as directional, not additive. The impact forecasts reflect baseline growth, mix effects, and variable interactions.
Folic Acid Market Segment Analysis
By Grade:
Pharmaceutical Standards Command Premium, Food Grade Gains MomentumPharmaceutical grade folic acid continues to lead the market with a 63.16% share in 2025, as companies focus on meeting rigorous quality standards for medical treatments and high-end supplements. The segment's higher pricing reflects the investment in advanced manufacturing processes, thorough quality testing, and compliance with regulatory requirements to deliver consistent product quality. Companies in this segment serve both medical applications and premium supplement manufacturers who emphasize product quality to stand out in competitive markets.
The food grade market is set to expand at 6.17% CAGR through 2031, as more countries implement food fortification programs and companies develop new functional food products. This growth comes as regulators increasingly support food-grade folic acid in national nutrition programs that prioritize cost-effective solutions. Companies benefit from reduced production costs in large-scale fortification projects while meeting necessary quality benchmarks. The segment's expansion reflects a shift in public health strategies toward broader nutrition improvements, allowing manufacturers to streamline production while meeting regulatory standards.

By Source:
Synthetic Dominance Faces Fermentation ChallengeChemical synthesis remains the primary production method, holding a commanding 90.77% market share in 2025. This dominance stems from well-established manufacturing facilities and significant cost benefits in large-volume production. Manufacturers prefer synthetic folic acid for its reliable quality standards, longer shelf life, and established regulatory framework. The method allows companies to maintain stable production costs and efficiently adjust their output to meet market demands without requiring significant new investments.
The fermentation-based folate production is experiencing robust growth, with an expected CAGR of 8.02% through 2031. This growth reflects changing consumer preferences toward naturally produced ingredients. Companies are responding to increasing consumer understanding of how natural folate forms differ from synthetic alternatives in terms of bioavailability, especially among people with specific genetic variations. While production expenses remain higher than chemical synthesis, companies can implement premium pricing strategies for these natural alternatives while addressing regulatory concerns regarding synthetic folic acid consumption levels.
By Application:
Supplements Drive Volume, Foods Accelerate GrowthDietary supplements account for 46.54% of the market share in 2025, supported by consumer preferences and healthcare professional endorsements for specific nutritional needs. The segment benefits from direct-to-consumer sales channels and higher profit margins compared to food fortification products. The growth in this segment is particularly strong in developed markets where consumers are increasingly health-conscious and willing to invest in preventive healthcare. The widespread availability of dietary supplements through various retail channels, including pharmacies, supermarkets, and online platforms, contributes to their market dominance. Additionally, the segment's growth is reinforced by continuous product innovations and formulations targeting specific health conditions and demographic groups.
The functional foods segment is expected to grow at a 6.2% CAGR through 2031, driven by consumer preference for obtaining nutrients through regular food consumption. This growth reflects the increasing demand for clean-label products, with consumers preferring naturally fortified foods over synthetic supplements. The expansion of functional foods is supported by technological advancements in food fortification processes and increasing research and development investments by major food manufacturers. Consumer awareness about the health benefits of functional foods and their integration into daily dietary habits continues to drive market growth. The segment also benefits from the growing trend of preventive healthcare and the increasing popularity of fortified beverages, cereals, and dairy products.
Geography Analysis
APAC Folic Acid Market
The Asia-Pacific region demonstrates its market dominance by capturing 38.07% of the global share in 2025, underpinned by well-structured fortification programs implemented across 10 countries under the Food Fortification Initiative guidance. The region's strength lies in China's robust manufacturing ecosystem, which provides significant cost benefits and streamlined supply chains. India's expanding healthcare accessibility has opened new avenues for both therapeutic and preventive applications. The pharmaceutical manufacturing infrastructure in the region has proven instrumental in meeting domestic requirements while serving global export markets, particularly in supplying high-purity grades essential for biopharmaceutical applications.
South America Folic Acid Market
South America's market demonstrates robust performance, achieving a CAGR of 6.73% through 2031. The region's healthcare systems are implementing neural tube defect prevention programs while strengthening medical infrastructure. This growth aligns with South America's economic development, as governments increase investments in public health initiatives, particularly maternal and child nutrition programs across urban centers. The implementation of these programs has resulted in improved healthcare outcomes and increased market penetration across various regions. The combination of government support, healthcare infrastructure development, and rising awareness among healthcare providers has created favorable conditions for sustained market growth.
North America and Europe Folic Acid Market
North America and Europe maintain stable market positions through established regulatory frameworks and high per-capita consumption. While these markets have matured, growth opportunities exist in premium segments and specialized applications. The United Kingdom's mandate for flour fortification by December 2026 indicates renewed potential in developed markets where voluntary programs have reached maximum effectiveness. This regulatory shift is expected to influence other European nations to review and potentially strengthen their fortification policies. The market in these regions continues to evolve through innovation in product formulations and expanding applications across different food categories.
Regulatory Landscape
Mandatory fortification remains a primary policy lever shaping folic acid demand. In the United Kingdom, legislation requires non-wholemeal wheat flour to be fortified with folic acid by December 2026 (250 micrograms per 100 grams) across England, Scotland, and Northern Ireland. This is pushing millers and premix suppliers to align procurement, dosing, and QA protocols to a common framework.
In the European Union, Commission Regulation (EU) 2025/2224 (November 2025) expanded the list of authorized folate sources by including the monosodium salt of L-5-methyltetrahydrofolic acid for foods and food supplements. In the United States, FDA regulations continue to permit folic acid addition to specified enriched grain products (21 CFR 172.345), which anchors ongoing use in staple fortification and shapes label, specification, and compliance expectations for ingredient suppliers.
Competitive Landscape
The folic acid market is a moderately fragmented market experiencing significant changes as major chemical companies reshape their portfolios. Major players in the market are BASF, DSM-Firmenich, and Parchem, among others. BASF's recent decision to sell its food and health ingredients business to Louis Dreyfus Company in 2025 reflects this transformation, while in DSM-Firmenich continues to build its market presence through its comprehensive vitamin portfolio, achieving 8% organic sales growth despite price pressures. These established players maintain their competitive edge through extensive regulatory expertise and production capabilities, setting high barriers for new market entrants.
Companies are increasingly focusing on innovation and technological advancement to maintain their market positions. DSM-Firmenich's OVN Optimum Vitamin Nutrition guidelines have become the industry benchmark for animal feed applications, while companies like Gnosis by Lesaffre are revolutionizing the market with technologies such as Quatrefolic, which doubles the bioavailability of standard folic acid. The competitive landscape now favors organizations that can combine fermentation-derived production expertise with the ability to navigate complex regulatory requirements across different regions.
The market offers significant opportunities across emerging segments, including personalized nutrition based on genetic variations, animal feed optimization for aquaculture, and pharmaceutical-grade applications in biopharmaceutical manufacturing. Companies that develop natural folate through fermentation processes are gaining market share by meeting the demand for clean-label products. These companies can charge premium prices while established manufacturers maintain their position in high-volume applications. Market success depends on managing regulatory compliance alongside efficient production methods, creating an environment where both established and new companies can succeed in their target segments.
Folic Acid Industry Leaders
-
BASF SE
-
DSM-Firmenich
-
Parchem
-
Xinfa Pharmaceutical Co., Ltd.
-
Medicamen Biotech Ltd.
- *Disclaimer: Major Players sorted in no particular order
Folic Acid Market Companies Covered in this Report
- BASF SE
- DSM-Firmenich
- Parchem
- Xinfa Pharmaceutical Co., Ltd.
- Medicamen Biotech Ltd.
- Nantong Changhai Food Additive Co., Ltd.
- Hema Pharma
- Makers Nutrition
- Gnosis by Lesaffre
- Emcure Pharmaceuticals Ltd.
- Hebei Jiheng (Group) Pharmaceutical Co., Ltd.
- Shengda Pharmaceutical Co., Ltd.
- Zydus Pharmaceuticals Ltd.
- Kirkman Group, Inc.
- Superior Supplement Manufacturing
- Prinova Group LLC
- Foodchem International Corporation
- Jiangxi Tianxin Pharmaceutical
- Jarrow Formulas Inc.
- Merck KGaA / MilliporeSigma
Market Opportunities and Future Outlook
The clearest volume growth sits in mandated and program-linked fortification, where compliance timelines translate into steady industrial offtake for food-grade folic acid and premixes. California implemented a requirement effective January 2026 to add folic acid to corn masa flour used in traditional foods, and the UK flour-fortification deadline of December 2026 keeps procurement, reformulation, and verification work active across flour supply chains. Together, these policy actions expand the addressable fortification base beyond voluntary adoption.
Product premiumization is also widening opportunities through bioactive folate forms and condition-specific positioning for consumers focused on bioavailability and genetic variability (MTHFR-related preferences). In May 2026, China National Health Commission approval for 6S-5-methyltetrahydrofolate calcium (Magnafolate) for infant complementary food nutritional supplements supports broader use of active folates in regulated nutrition formats, while Triquetra Healths folinic acid product launch (May 2026) reflects ongoing formulation innovation around alternative folate forms and multi-cofactor systems.
Recent Industry Developments in Folic Acid Market
- March 2026: BASF announced a global price increase of up to 20% for selected active pharmaceutical ingredients and excipients, effective immediately or as existing contracts allow. For folic-acid-related formulations, this raised near-term cost and sourcing sensitivity for pharmaceutical and supplement manufacturers that rely on multi-API or excipient-heavy dosage forms.
- September 2025: Louis Dreyfus Company completed the acquisition of BASFs Food and Health Performance Ingredients business. The ownership change reshaped supplier options for vitamins and nutrition ingredients customers and signaled continued portfolio realignment among large chemical and ingredients groups.
- May 2024: Balchem Corp. launched Optifolin+, a bioactive, choline-enriched folate (L-5-methyltetrahydrofolate) ingredient targeting dietary supplement brands in the United States. The launch broadened commercial availability of active folate systems and intensified differentiation beyond standard folic acid in premium supplement formulations.
Folic Acid Market Report Scope and Research Methodology
Market Definition and Coverage
This market covers the value of folic acid sold into end-use applications, including nutrition, food fortification, and pharmaceutical uses, counted as revenues generated by producers and suppliers across major regions.
Scope exclusions (for clarity): We exclude naturally occurring folate in whole foods, and we also exclude finished multivitamin products when folic acid value cannot be separated as a distinct ingredient line.
Segments Covered in This Report
- By Grade
- Food Grade
- Pharmaceutical Grade
- By Source
- Chemical Synthesis
- Fermentation-Derived
- By Application
- Dietary Supplements
- Pharmaceuticals
- Functional Foods
- Animal Feed
- Others
- By Geography
- North America
- United States
- Canada
- Mexico
- Rest of North America
- Europe
- United Kingdom
- Germany
- France
- Russia
- Italy
- Spain
- Rest of Europe
- Asia-Pacific
- India
- China
- Japan
- Australia
- Rest of Asia-Pacific
- South America
- Brazil
- Argentina
- Rest of South America
- Middle East and Africa
- South Africa
- Saudi Arabia
- Rest of Middle East and Africa
- North America
Data Sources, Market Sizing, and Validation
Desk Research
Desk work starts with building a clean fact base on demand drivers and supply signals, and then checking how those signals move over time. For folic acid, we relied on public health and nutrition signals, including deficiency and supplementation guidance, and on food fortification policy references that help maintain steady volume offtake.
We typically use sources such as the World Health Organization (WHO), the US CDC, and the US FDA for nutrition and fortification references, along with FAOSTAT for food production context, and UN Comtrade for trade flow direction checks for vitamin ingredients. We also reviewed company filings, investor presentations, and credible press coverage to understand capacity additions, formulation shifts, and pricing commentary. Where needed, paid subscriptions were used only for company financials and intelligence, and for patent databases to cross-check innovation activity. This list is illustrative only, and many other public sources were also consulted for data collection, validation, and clarification.
Primary Interviews and Surveys
Primary work focused on validating real purchasing patterns and confirming what is being counted in the market value, before finalizing the model. We spoke with stakeholders across ingredient manufacturing, distribution, and downstream users in supplements, food fortification, and pharma formulation, and we also covered major consuming regions (APAC, EMEA, and the Americas) so the regional mix would not be assumed from a single geography.
Distribution of primary research fieldwork respondents
| Company type | Respondent position | Region |
|---|---|---|
| Top tier: 35% | CXOs: 13% | APAC: 44% |
| Mid tier: 45% | Functional/Unit leaders: 40% | EMEA: 32% |
| Smaller Players: 20% | Managers: 47% | Americas: 24% |
Market-Sizing & Forecasting
Sizing is built using top-down and bottom-up logic, but the core structure stays simple and repeatable. A top-down demand pool is reconstructed from application-level consumption anchors, such as supplement penetration, fortification program coverage, and pharma usage intensity, and then translated into ingredient demand using typical dosage and inclusion rates.
Those totals are then corroborated through selective bottom-up approximations, including supplier revenue cross-checks, sampled price per kg by grade, and channel checks on import reliance in markets with limited local production. When gaps show up in smaller countries, we fill them using proxy indicators like population, birth cohort size, and packaged food fortification intensity, then adjust using regional trade and price signals.
For forecasting, scenario analysis was used so near-term swings in raw material pricing and regulatory enforcement are not treated as a straight line. The model leans on a small set of inputs that interviewees usually agree on, such as birth rates and prenatal supplementation rates, anemia and deficiency awareness programs, changes in mandatory fortification coverage, pharma grade demand growth, and observed price movement by grade.
Data Validation & Update Cycle
Validation is done in layers so one data point does not dominate the outcome. We compare modeled values against independent signals like trade values, public production clues, and company revenue direction, then run variance checks at region and application level to catch unusual jumps.
Before sign-off, the full workbook is reviewed by another analyst, and any large deltas trigger a re-check of the conversion factors and a re-contact of selected interviewees. Reports are refreshed annually, and interim updates are made when material events occur, such as major capacity changes or meaningful regulatory shifts. Right before delivery, a final review pass is completed so clients receive the most current view available.
Mordor Intelligence's Folic Acid Market Size Measured Against Other Published Estimates
Published market sizes for folic acid often do not match because firms do not count the same thing, even when they use similar words in the title. Differences usually come from how grades and use cases are grouped, how pricing is averaged across regions, and whether trade flows are treated as demand or just as supply movement.
Some estimates fold in finished dosage forms and broader supplement retail value. In Mordor Intelligence's model, we count the ingredient-level folic acid value across defined applications, and we keep naturally occurring folate in foods and non-separable multivitamin value outside the total, which changes the starting point before forecasting begins.
Benchmark comparison
| Source | Market Size | Gaps in Research Methodology |
|---|---|---|
| Mordor Intelligence | USD 1.10 B (2026) | |
| Global Research Publisher A | USD 1.09 B (2025) | Uses a different base year and can blend broader downstream value signals, such as fortified food and supplement channels, which may include margin layers beyond ingredient pricing. Their model also states 2024 as the estimation base, which shifts currency timing and average price assumptions versus a 2026 current-year view. |
| Analytics Firm B | USD 0.76 B (2024) | Builds the market through finished form categories (for example, tablets and soft gels) and source buckets that can undercount ingredient sold into food fortification and pharma-grade applications. A 2024 anchor year, combined with narrower inclusion rates, typically results in a smaller market value when compared with broader application-led demand pooling. |
The spread in the table is mainly explained by what is being priced and at what point in the value chain the pricing is captured, followed by the choice of base year. By keeping the inputs tied to clear consumption drivers and then cross-checking them with supplier and trade signals, the sizing stays transparent and easier to replicate when assumptions are updated.
Key Questions Answered in the Report
What is the current value of the folic acid market?
The folic acid market stands at USD 1.1 billion in 2026 and is projected to reach USD 1.37 billion by 2031.
Why are mandatory fortification policies important for folic acid demand?
Mandates ensure flour and staple foods carry folic acid, creating reliable baseline demand that shields manufacturers from shifts in consumer behavior.
Which region is growing the fastest in folic acid consumption?
South America shows the highest growth trajectory with a 6.73% CAGR through 2031, propelled by Brazil’s longstanding fortification program.
How does fermentation-derived folate differ from synthetic folic acid?
Fermentation products use bacterial processes to generate bioactive folate forms that improve absorption and align with clean-label claims, though they cost more to produce.
Which application dominates sales today?
Dietary supplements hold the largest revenue share at 46.54% in 2025 but face rising competition from fortified functional foods advancing at the quickest pace.