
Foam Glass Market Size and Share
Market Overview
| Study Period | 2020 - 2031 |
|---|---|
| Market Size (2026) | USD 2.96 Billion |
| Market Size (2031) | USD 3.77 Billion |
| Growth Rate (2026 - 2031) | 4.97 % |
| Fastest Growing Market | Asia Pacific |
| Largest Market | Asia Pacific |
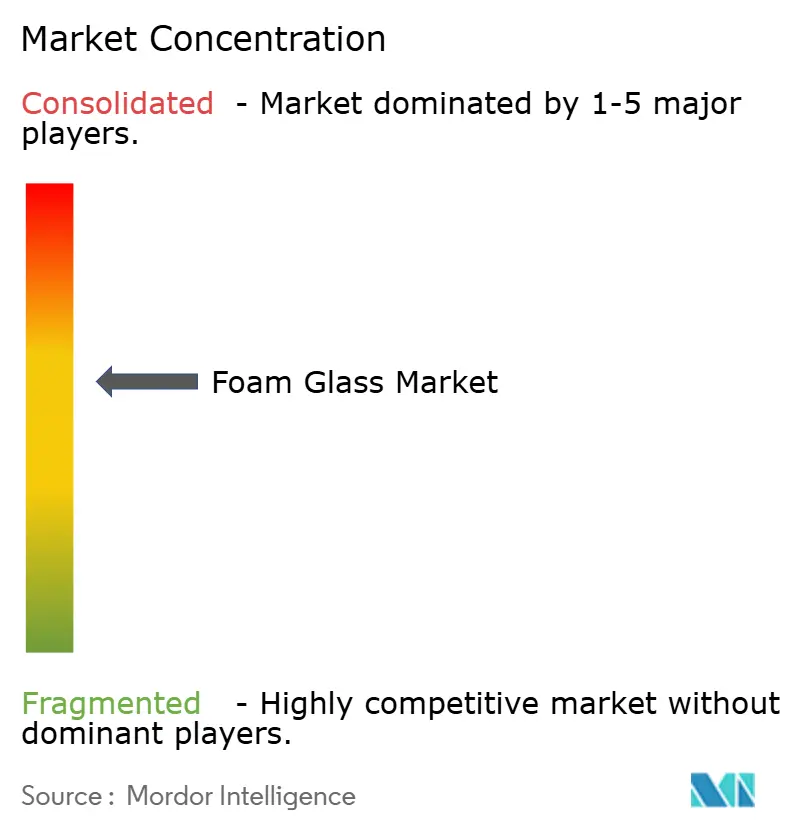
| Market Concentration | Medium |
Major Players *Disclaimer: Major Players sorted in no particular order Image © Mordor Intelligence. Reuse requires attribution under CC BY 4.0. | |
Foam Glass Market Analysis by Mordor Intelligence
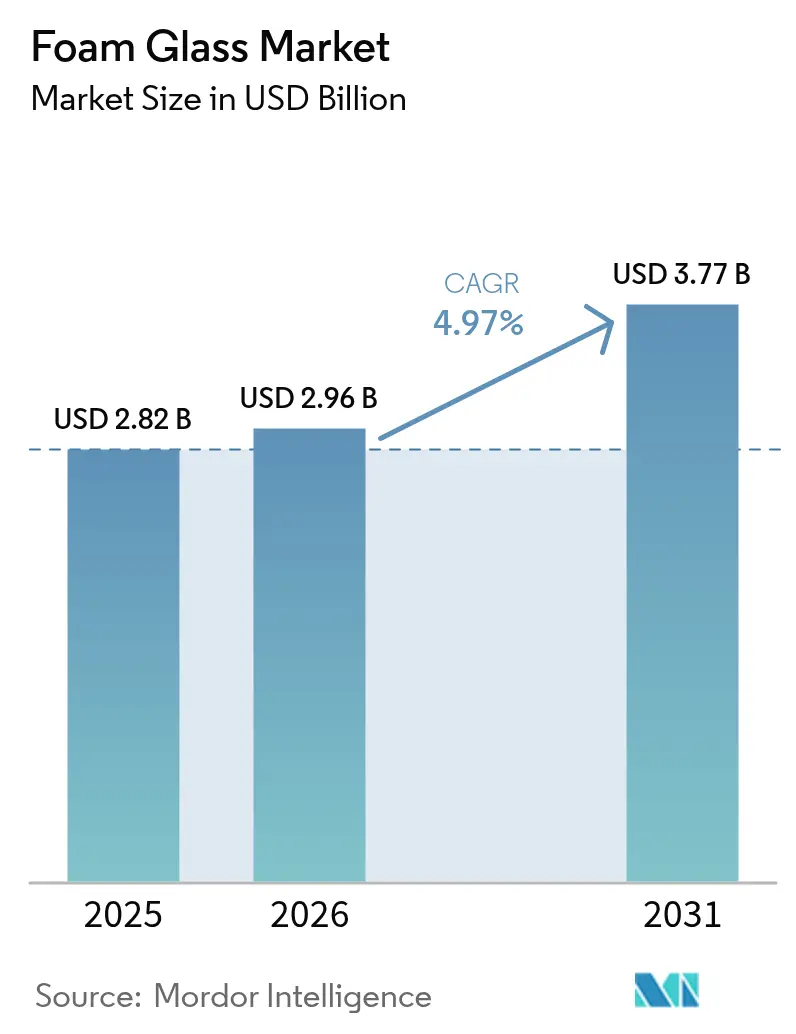
Foam Glass market size in 2026 is estimated at USD 2.96 billion, growing from 2025 value of USD 2.82 billion with 2031 projections showing USD 3.77 billion, growing at 4.97% CAGR over 2026-2031. Sustained growth reflects rising demand for thermally efficient, fire-resistant, and chemically inert insulation across construction, cryogenic storage, and transportation infrastructure. Lightweight aggregates made from recycled glass are easing geotechnical challenges in road building, while policy pressure for circular materials secures a steady cullet supply for manufacturers. Incremental process innovations, led by additive manufacturing and cold-expansion foaming, are lowering energy use and enabling bespoke components. Moderate but persistent price competition from polymeric foams tempers adoption in cost-sensitive segments, yet premium applications continue to value lifecycle performance over initial costs.
Key Report Takeaways
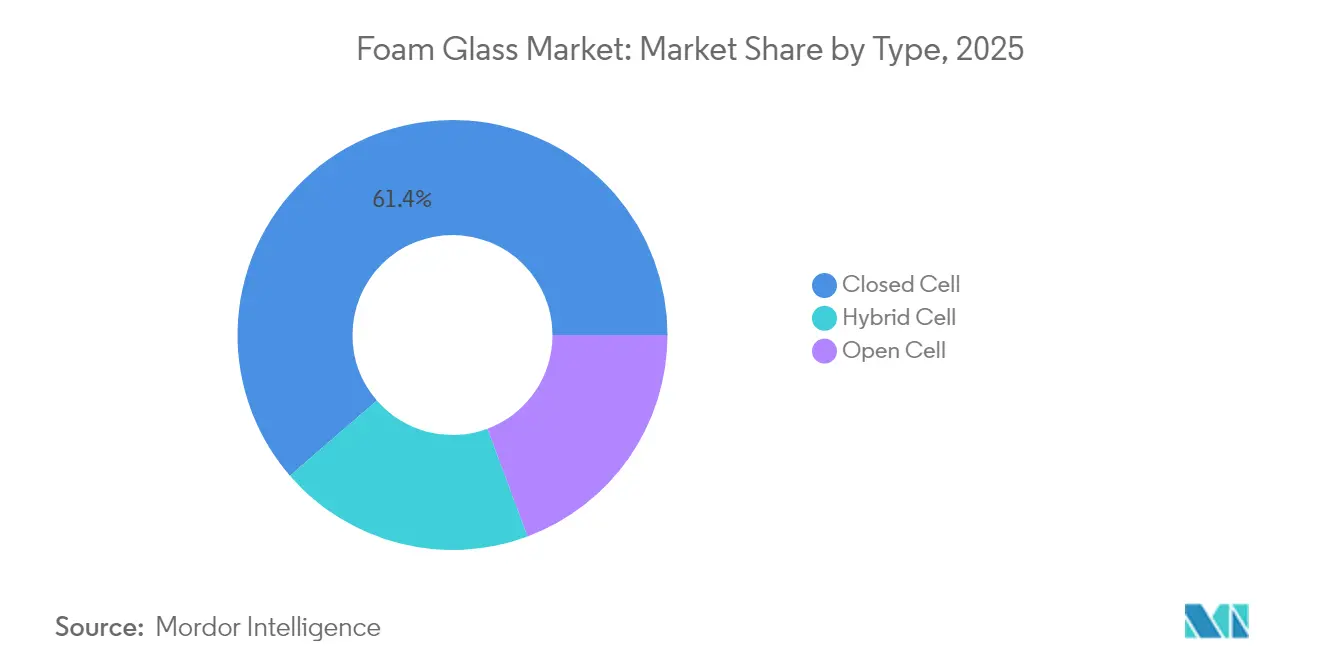
- By type, closed-cell foam glass captured 61.35% of the foam glass market share in 2025, whereas hybrid-cell variants are projected to expand at 5.69% CAGR to 2031.
- By Manufacturing Process, continuous foaming processes held 62.60% of the foam glass market size in 2025, while additive manufacturing is forecast to register the highest 5.78% CAGR through 2031.
- By application, building and construction accounted for 45.05% of the foam glass market size in 2025, yet the cryogenic and LNG segment heads for a 5.86% CAGR over the outlook period.
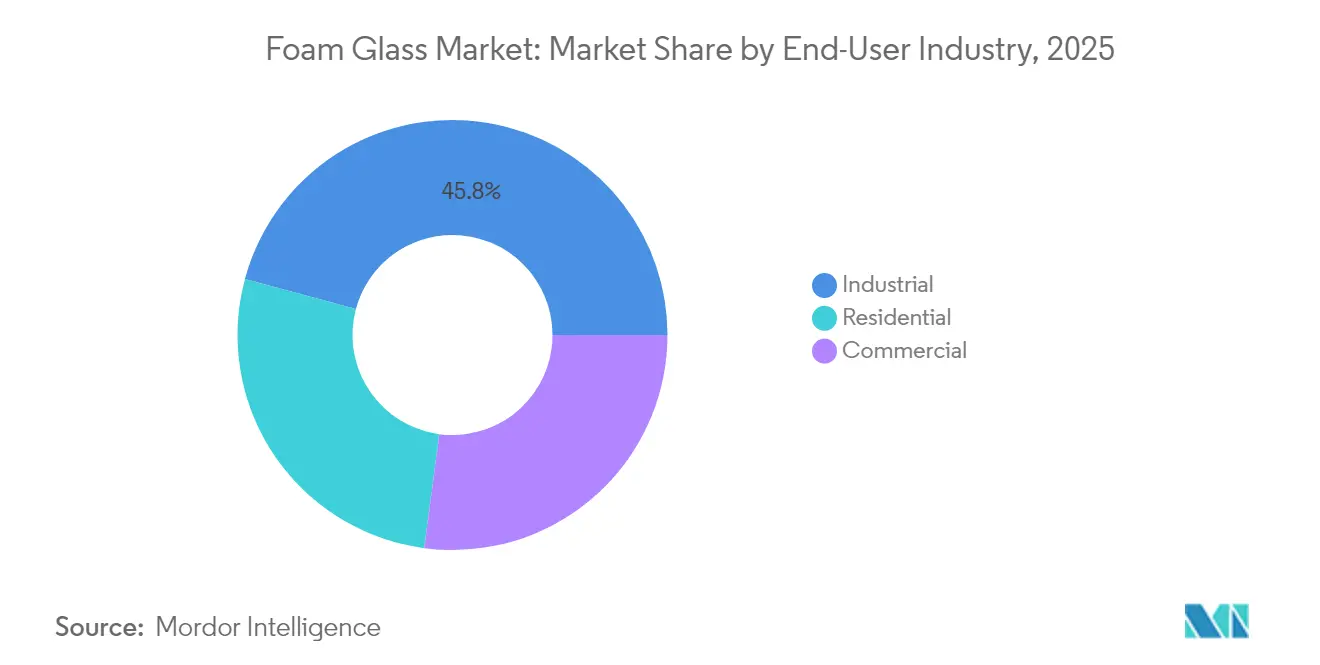
- By end-user industry, industrial segment commanded 45.80% of the foam glass market share in 2025 and is also expected to post the highest 5.92% CAGR by 2031.
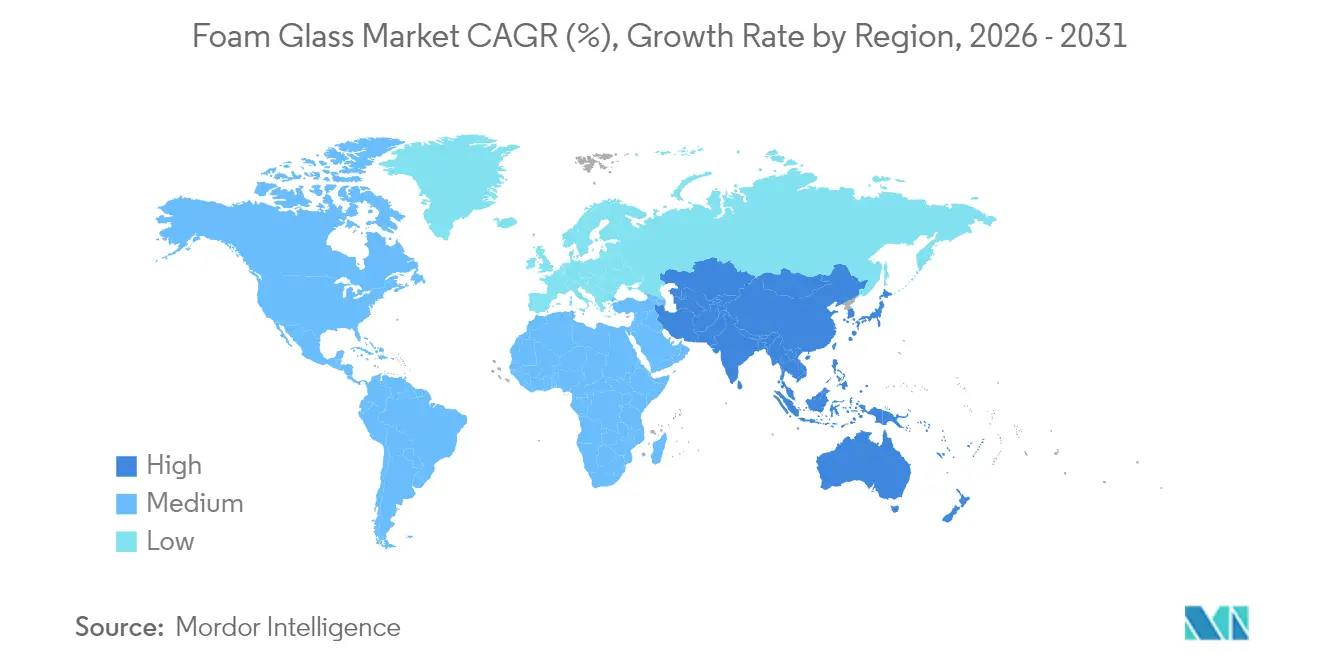
- By geography, Asia-Pacific led the global foam glass market with 38.95% revenue share in 2025 and is on track for the fastest 5.44% CAGR to 2031.
Note: Market size and forecast figures in this report are generated using Mordor Intelligence’s proprietary estimation framework, updated with the latest available data and insights as of 2026.
Market Trends and Insights
Drivers Impact Analysis of Foam Glass Market*
| Driver | (~) % Impact on CAGR Forecast | Geographic Relevance | Impact Timeline |
|---|---|---|---|
| Rapid adoption of foam glass as lightweight fill in transportation infrastructure | +1.10% | North America & Europe, expanding to APAC | Medium term (2-4 years) |
| Rising energy-efficiency regulations boosting demand for high-performance insulation | +0.80% | Global, with strongest enforcement in EU & North America | Long term (≥ 4 years) |
| Industrial uptake for chemically inert insulation in LNG and cryogenic storage | +0.70% | Global, concentrated in energy-producing regions | Medium term (2-4 years) |
| Recycling-mandate driven supply growth of cullet for foam-glass production | +0.60% | Europe leading, North America & APAC following | Long term (≥ 4 years) |
| 3-D printed foam-glass components for modular construction | +0.50% | North America & Europe early adoption, APAC scaling | Long term (≥ 4 years) |
| Source: Mordor Intelligence | |||
Rapid Adoption of Foam Glass as Lightweight Fill in Transportation Infrastructure
Highway agencies are validating foam glass aggregates as a structural solution in soft-soil projects. The Federal Highway Administration documented load reductions of up to 75% in bridge abutments compared with traditional stone fill. Lower loads cut foundation costs and improve seismic tolerance, while the material’s drainage and thermal properties curb frost heave. Field trials in Norway reported two winter seasons without frost penetration, removing the need for extra frost-protection layers. These results reposition foam glass from an insulation material to an engineered lightweight fill.
Rising Energy-Efficiency Regulations Boosting Demand for High-Performance Insulation
Revised codes in the European Union and North America prioritize whole-building energy outcomes, prompting architects to select materials with reliable thermal performance over decades. FIW studies show foam glass retains conductivity within design limits for 50 years. Its non-organic matrix resists moisture, microbial growth, and degradation that undermine polymeric foams. Cold-climate regions rely on a –269 °C to +482 °C operating window to specify a single insulation solution across temperature zones.
Industrial Uptake for Chemically Inert Insulation in LNG and Cryogenic Storage
Large LNG tanks demand materials that withstand thermal cycling and hydrocarbon exposure without conductivity drift. Closed-cell foam glass used beneath 30,000 m³ tanks helps operators keep boil-off below 0.08 wt% per day[1]. In petrochemical plants, its inorganic nature avoids stress-cracking and corrosion, reducing shutdown risks and total ownership costs. Specifiers emphasize material integrity over the service life of equipment operating in aggressive environments.
3-D Printed Foam-Glass Components for Modular Construction
Material extrusion research yields printable slurries that foam in situ, opening pathways for customized, lightweight panels. Early pilots demonstrate shaped blocks that integrate insulation, drainage, and fire protection in a single part. Adoption is moving from prototypes to small-batch production in North America, with Europe investing in automated assembly lines[2].
Restraints Impact Analysis of Foam Glass Market*
| Restraint | (~) % Impact on CAGR Forecast | Geographic Relevance | Impact Timeline |
|---|---|---|---|
| High capital-investment requirement for production lines | -0.90% | Global, particularly affecting emerging markets | Short term (≤ 2 years) |
| Price competition from cheaper polymeric foams and mineral wool | -0.70% | Global, most intense in price-sensitive segments | Medium term (2-4 years) |
| Limited design flexibility for aesthetic architectural use | -0.40% | North America & Europe, premium architectural segments | Medium term (2-4 years) |
| Source: Mordor Intelligence | |||
High Capital-Investment Requirement for Production Lines
Building a modern foam glass plant demands USD 50-100 million for high-temperature furnaces, foaming systems, and emission controls[3]. Emerging markets struggle to marshal patient capital and specialist engineering talent, delaying local supply. Minimum efficient capacity often exceeds domestic demand, reinforcing reliance on imports and sustaining moderate industry consolidation.
Price Competition from Cheaper Polymeric Foams and Mineral Wool
Expanded polystyrene and mineral wool undercut foam glass by 40-60% on purchase price, challenging uptake in residential and mid-tier commercial projects. Builders focused on initial cost seldom weigh decades-long performance. Mineral wool’s fire resistance narrows the perceived advantage of foam glass, particularly where cullet supply or energy costs push product prices higher.
*Our forecasts treat driver/restraint impacts as directional, not additive. The impact forecasts reflect baseline growth, mix effects, and variable interactions.
Foam Glass Market Segment Analysis
By Type:
Closed Cell Dominance Drives Market MaturityClosed-cell products held 61.35% of the foam glass market share in 2025, reflecting strong adoption in industrial process pipework and below-grade building envelopes where vapor resistance is critical. The segment benefits from compressive strengths above 4 MPa, supporting load-bearing applications across LNG tanks and cold-storage floors. Hybrid-cell materials, blending closed and open pores, are slated to grow at 5.69% CAGR as formulators optimize densities for both structural and acoustic performance.
Open-cell variants remain niche but gain traction in architectural elements that prioritize sound absorption and breathability. Indoor air quality certifications now reference vapor-permeable insulation, creating pull for open-cell slabs in schools and healthcare projects. Manufacturers integrating over 60% recycled glass content satisfy green building credits and meet circular-economy targets.

By Manufacturing Process:
Additive Manufacturing Reshapes Production ParadigmsContinuous foaming deployed in tunnel furnaces accounted for 62.60% of the foam glass market size in 2025, leveraging decades of incremental efficiency gains. The approach excels at long runs of standard boards and blocks. Additive manufacturing, however, is poised to expand at 5.78% CAGR as it unlocks complex geometries for modular facades and bespoke industrial parts.
Batch foaming remains relevant where density control overrides scale, such as in fireproof pipe supports. Recent cold-expansion methods cut energy use below 1 kWh/kg, narrowing the cost gap with polymers while shrinking the emissions footprint.
By Application:
Cryogenic Segment Drives Premium GrowthBuilding and construction absorbed 45.05% of 2025 demand, powered by codes mandating lower energy use intensities. Projects specify foam glass boards for roof terraces and inverted roofs where water exposure undermines polymeric foams. The cryogenic and LNG segment is projected to post a 5.86% CAGR, boosted by record investments in export terminals and carrier fleets.
Infrastructure engineers are specifying lightweight aggregates to stabilise embankments on compressible soils, an emerging application expected to accelerate as more transport agencies qualify the material. Water-treatment basins and biodigesters form a smaller but growing niche due to foam glass’s chemical inertness.
By End-User Industry:
Industrial Sector Leads Growth and AdoptionIndustrial facilities contributed 45.80% of revenue in 2025 and are set for a 5.92% CAGR through 2031 as refineries, chemical plants, and food processors retrofit legacy insulation. Specifiers value foam glass’s resistance to oil spills, solvents, and microbial attack. Commercial real-estate owners adopt the material in data centers and cold-chain warehouses, citing avoided maintenance and energy savings.
Residential uptake remains modest, yet premium single-family builders in North America and Northern Europe are incorporating foam glass slabs under grade beams to mitigate thermal bridging. Marketing alliances with green-building certification bodies aim to raise consumer awareness of lifecycle benefits.
Geography Analysis
APAC Foam Glass Market
Asia-Pacific generated 38.95% of global revenue in 2025 and is advancing at a 5.44% CAGR. Chinese industrial policy supporting energy-efficient manufacturing underpins widespread adoption in petrochemical clusters along the Yangtze. Japan’s materials sector is trialing additive manufacturing to supply high-precision foamed inserts for seismic isolation. South Korea’s shipyards specify closed-cell blocks in LNG carriers, reinforcing regional leadership.
North America Foam Glass Market
North America forms a mature demand base anchored by stringent envelope codes. Federal and state investments in bridge resilience have opened a new route for lightweight aggregates. Canada’s cold climate positions foam glass as a single-material solution from foundations to rooftop mechanical rooms.
Europe Foam Glass Market
Europe benefits from a dense recycling network that supplies high-quality cullet at competitive prices. Germany and Switzerland host major producers that export to neighboring construction and process-industry hubs. Nordic experiences in permafrost highways furnish performance data that global designers now cite.
Regulatory Landscape
Foam glass used as thermal insulation for building applications increasingly aligns to harmonized product specifications and supporting compliance documentation. In January 2026, ISO published ISO 20812:2026, an international specification framework for cellular glass thermal insulation products used in buildings, which helps reduce cross-market variability in technical requirements for both manufacturers and specifiers.
In Europe, cellular glass placed on the market for construction applications must meet the EU Construction Products Regulation (EU) No 305/2011 and commonly references EN 13167 for thermal insulation product requirements, while industrial insulation applications frequently align with EN 14305. Environmental disclosure has also moved into the procurement center, with EPD programs aligned to EN 15804 and ISO 14025 (for example, an EPD Hub declaration published in March 2026 for a cellular glass product), and property validation for certain roof assemblies often supported by third-party certifications such as FM Global approvals.
Value Chain Analysis
The foam glass value chain starts with recycled glass cullet sourcing and processing, supported by municipal and commercial recycling streams, then incorporates foaming agents (commonly carbon-based or carbide-based) and auxiliary minerals and salts to tune viscosity, gas release, and cell structure. Pre-processing typically includes sorting, drying, and milling cullet to controlled particle sizes before blending with additives, since consistent cullet quality and moisture control affect yield, density uniformity, and final thermal properties.
Manufacturing is energy-intensive and centered on high-temperature foaming or sintering in furnaces (often in the 800-900 C range for sintering routes, and higher for melt-based routes), followed by controlled annealing and downstream cutting or finishing into boards, blocks, or aggregates. Logistics and channel structure vary by product form: low-density boards and blocks tend to rely on regional production footprints to limit freight costs, while aggregate is routed to civil contractors and DOT-backed infrastructure projects via bulk handling. Key bottlenecks are furnace energy costs and decarbonization requirements, which has encouraged moves toward electric furnace configurations and plant-level energy management to improve efficiency and preserve competitiveness against lower-cost substitutes.
Competitive Landscape
The industry shows moderately consolidated concentration. Owens Corning’s 2017 takeover of Pittsburgh Corning grouped premium cellular glass assets within a broad insulation portfolio. Foamit Group will double capacity at its Norwegian plant by mid-2025, adding two electric lines that scale regional supply while trimming emissions.
Strategy focuses on regional production to minimize freight of low-density blocks. Leading firms partner with recyclers such as Strategic Materials to secure cullet streams and lock in carbon credentials. R&D pipelines emphasize binder chemistries friendly to 3-D printing, aiming to patent structure-property enhancements rather than commodity volumes.
Foam Glass Industry Leaders
-
AeroAggregates of North America, LLC
-
SCHLÜSSELBAUER Geomaterials GmbH
-
Glapor Werk Mitterteich GmbH
-
Misapor
-
Owens Corning
- *Disclaimer: Major Players sorted in no particular order
Foam Glass Market Companies Covered in this Report
- AeroAggregates of North America, LLC
- Anhui Huichang New Material Co. Ltd
- Foamit Group
- Glapor Werk Mitterteich GmbH
- Glavel Inc
- JSC Gomelsteklo
- Misapor
- Ningbo Yoyo Foam Glass Co., Ltd.
- Owens Corning
- PINOSKLO cellular glass
- REFAGLASS sro
- SCHLÜSSELBAUER Geomaterials GmbH
- Styro Insulations Mat. Ind. LLC.
- Tianjin Huali Thermal Insulation Building Material Co., Ltd.
- Uusioaines Oy - Foamit
- Veriso GmbH & Co. KG
- ZHEJIANG ZHENSHEN INSULATION TECHNOLOGY CORP.LTD.
Market Opportunities and Future Outlook
Capacity additions and plant upgrades in Europe point to a near-term whitespace around regional supply availability, lead times, and the documentation needed for product carbon reporting across both building insulation and industrial or cryogenic uses. Owens Corning announced a 50% capacity expansion at its FOAMGLAS plant in Klasterec, Czech Republic (June 2025), with start-up timing communicated for Q2 2026, adding incremental supply as EN-aligned specifications and EPD-based procurement become more common. Foamit Group also added output by opening two new electric production lines at Onsøy, Norway (September 2025), doubling capacity and reinforcing the industry's shift toward electrified production as a competitive lever.
Industrial and infrastructure applications also create room for foam glass beyond standalone thermal performance, especially where chemically inert insulation is valued for LNG and cryogenic systems, and where lightweight fill supports geotechnical stabilization. Evidence from transportation agencies and field performance data supporting lightweight aggregate use, including documented load reduction performance in bridge approaches, strengthens qualification pathways for owners and engineering firms. Technology development continues through additive manufacturing and research on alternative foaming agents using industrial side streams, which expands the product-development runway for customized components and improved sustainability profiles, while the higher capital required for new lines keeps entry barriers elevated and favors partnerships, including Foamit's announced letter of intent (February 2026) with Sterhoek NV to pursue a new foam glass production facility in Belgium.
Recent Industry Developments in Foam Glass Market
- February 2026: Foamit Oyj signed a letter of intent with Sterhoek NV to plan a joint venture foam glass production facility in the Antwerp region of Belgium, targeting meaningful new capacity. The step formalizes a route to localize supply closer to Benelux demand centers and reduces dependence on long-distance shipments of low-density products.
- September 2025: Foamit Group opened two new electric production lines at its Glasopor AS facility in Onsøy, Norway, doubling annual foam glass capacity to about 280,000 cubic meters. The electrification focus supports lower operational emissions and improves competitiveness in tenders that screen for energy and carbon performance.
- July 2024: Glapor Werk Mitterteich GmbH highlighted expanded market use cases for foam glass in building envelope and threshold solutions, positioning recycled-glass-based components as alternatives where moisture resistance and durability are prioritized. This reinforces product diversification beyond standard insulation boards into application-specific building elements.
Foam Glass Market Report Scope and Research Methodology
Market Definition and Coverage
For this methodology, the foam glass market is defined as the value of foam glass materials sold for insulation and related lightweight fill uses, where the product is made by foaming recycled or virgin glass into a porous structure.
Scope exclusions: We exclude downstream installation labor and non-foam cellular glass substitutes that are sold as different insulation materials.
Segments Covered in This Report
- By Type
- Open Cell
- Closed Cell
- Hybrid Cell
- By Manufacturing Process
- Continuous Foaming
- Batch Foaming
- Additive Manufacturing (3-D Printing)
- By Application
- Building and Construction
- Infrastructure and Civil Engineering
- Industrial and Chemical Processing
- Cryogenic and LNG
- Agriculture and Water Treatment
- Other Applications (Roofing Granules, Landscaping)
- By End-user Industry
- Residential
- Commercial
- Industrial
- By Geography
- Asia-Pacific
- China
- Japan
- India
- South Korea
- ASEAN Countries
- Rest of Asia-Pacific
- North America
- United States
- Canada
- Mexico
- Europe
- Germany
- United Kingdom
- France
- Italy
- Spain
- Russia
- NORDIC Countries
- Rest of Europe
- South America
- Brazil
- Argentina
- Rest of South America
- Middle East and Africa
- Saudi Arabia
- South Africa
- Rest of Middle East and Africa
- Asia-Pacific
Data Sources, Market Sizing, and Validation
Desk Research
Desk research helped set the demand context and sanity check supply signals before assumptions were placed into the model. We leaned on public construction and infrastructure indicators, trade flows, and environmental rules that shape insulation choices, using sources such as the US Census Bureau construction spending series, Eurostat construction output, UN Comtrade trade statistics, and IEA building energy efficiency publications.
To keep pricing and capacity assumptions realistic, we also reviewed company annual reports and investor presentations, product technical datasheets, and updates from industry bodies such as the International Energy Agency and national building code agencies. Patent filings and peer reviewed materials journals were used to understand manufacturing process shifts that can affect yields and cost curves. We also used approved paid subscriptions for company financials and intelligence, plus a patent database and shipment level import export data where it improved cross checks. These examples are not exhaustive, and many other public sources were referred to for data collection, validation, and research clarification.
Primary Interviews and Surveys
Primary work focused on validating where foam glass is actually specified, how bids are priced, and how demand changes with building insulation rules and infrastructure project pipelines. We spoke with manufacturers, distributors, insulation contractors, EPC and engineering specifiers, and large end users in commercial, industrial, and civil engineering, and we covered APAC, EMEA, and the Americas to reduce single region bias.
Distribution of primary research fieldwork respondents
| Company type | Respondent position | Region |
|---|---|---|
| Top tier: 29% | CXOs: 13% | APAC: 49% |
| Mid tier: 51% | Functional/Unit leaders: 32% | EMEA: 31% |
| Smaller Players: 20% | Managers: 55% | Americas: 20% |
Market-Sizing & Forecasting
Sizing was built using top-down and bottom-up logic. First, we reconstructed construction and infrastructure demand pools by region, then converted them into foam glass consumption through adoption and specification rates. In practice, we mapped addressable insulation and lightweight fill activity to foam glass, and then translated that activity into value using region level price bands that reflect product form and project type.
Key inputs used in the model included construction output and new floor area trends, infrastructure and civil engineering project intensity, energy efficiency code tightening, insulation thickness requirements in cold chain and industrial piping, and trade flow direction for foam glass products as a supply availability signal. Because price is not uniform, we applied a stepped ASP progression that tracks energy costs, recycled glass feedstock availability, and the mix shift between blocks and granular forms. Where data gaps existed, smaller country totals were bridged using proxy ratios (such as construction value share and import dependence) and then reviewed with interview feedback.
For forecasting, scenario analysis was used and anchored to expected construction cycles, public infrastructure budgets, and code related insulation demand. We stress tested the scenarios with expert views on the pace of foam glass substitution versus polymeric alternatives. Bottom-up approximations were used as a cross check, including selective supplier revenue roll ups, channel checks on distributor movement, and sampled volume times ASP calculations, which helped adjust totals when early outputs looked too high or too low.
Data Validation & Update Cycle
Outputs were validated through triangulation across independent signals, where modeled demand was compared with trade patterns, capacity announcements, and observed construction activity levels by region. When a region showed unusual jumps, we rechecked assumptions and followed up to confirm whether the change came from pricing, mix, or a real volume shift.
Before sign off, the model goes through multi step analyst review, including variance checks against prior editions and consistency checks across related insulation indicators. Reports are refreshed annually, and interim updates are made when material events occur (such as major regulatory changes, project postponements, or supply disruptions). Right before delivery, a final pass is completed so clients receive the latest updated view rather than an older snapshot.
Mordor Intelligence's Foam Glass Market Size Versus Other Published Estimates
Published foam glass market values can differ even when they sound similar, since teams pick different base years, conversion rates, and what they treat as in scope for value. You will usually see the spread widen when adjacent cellular insulation materials are combined with foam glass, or when price assumptions are carried forward without checking what contractors and distributors are actually paying.
The benchmark table shows a clear split by base year and included revenue lines, and in Mordor Intelligence's model the 2026 value is built around foam glass product sales across defined foam cell types and end uses, with installation services and broader insulation substitutes kept out of the counted market value.
Benchmark comparison
| Source | Market Size | Gaps in Research Methodology |
|---|---|---|
| Mordor Intelligence | USD 2.96 B (2026) | |
| Global Consultancy A | USD 2.40 B (2025) | Uses a different base year and frames the market as revenue from sales with fewer disclosed checks on product form mix and region price bands, which can shift the value when pellets versus blocks move in share. |
| Industry Publisher B | USD 2.66 B (2025) | Broader application framing and a 2025 base can pull in demand tied to adjacent insulation and decorative uses, and the price progression appears to rely more on reported CAGR carry forward than on stepwise ASP updates linked to energy and feedstock conditions. |
Taken together, the differences are mainly about base year choice, what is counted as foam glass revenue, and how prices are moved forward in the forecast years. Our approach stays traceable because each region total can be explained through a small set of drivers, and then cross checked with trade, project activity, and expert validation before the final number is locked.
Key Questions Answered in the Report
What is the current value of the foam glass market?
The foam glass market size totals USD 2.96 billion in 2026.
How fast is the foam glass market expected to grow?
The industry is projected to post a 4.97% CAGR between 2026 and 2031.
Which region leads global demand?
Asia-Pacific commands 38.95% of 2025 revenue and maintains the fastest 5.44% CAGR outlook.
Which application segment is expanding the quickest?
The cryogenic and LNG insulation segment is forecast to rise at 5.86% CAGR through 2031.
What factors restrain wider adoption of foam glass?
High capital costs for production lines and price competition from lower-cost polymeric foams temper growth, particularly in price-sensitive markets.