
Fluorosilicone Market Size and Share
Market Overview
| Study Period | 2020 - 2031 |
|---|---|
| Market Volume (2026) | 32.63 kilotons |
| Market Volume (2031) | 41.12 kilotons |
| Growth Rate (2026 - 2031) | 4.74 % |
| Fastest Growing Market | Asia Pacific |
| Largest Market | Asia Pacific |
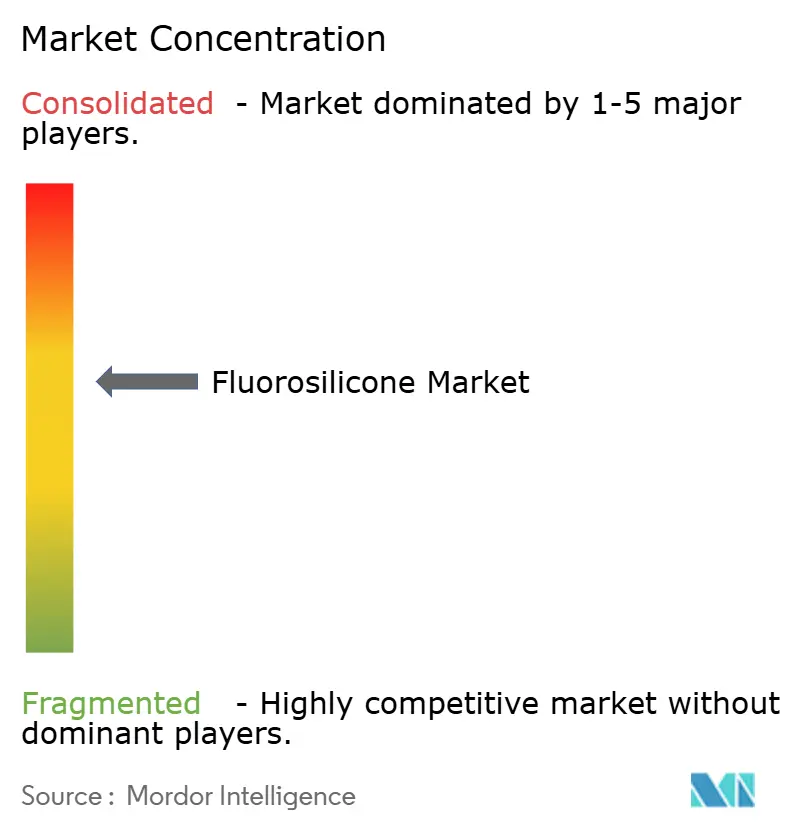
| Market Concentration | Medium |
Major Players *Disclaimer: Major Players sorted in no particular order Image © Mordor Intelligence. Reuse requires attribution under CC BY 4.0. | |
Fluorosilicone Market Analysis by Mordor Intelligence
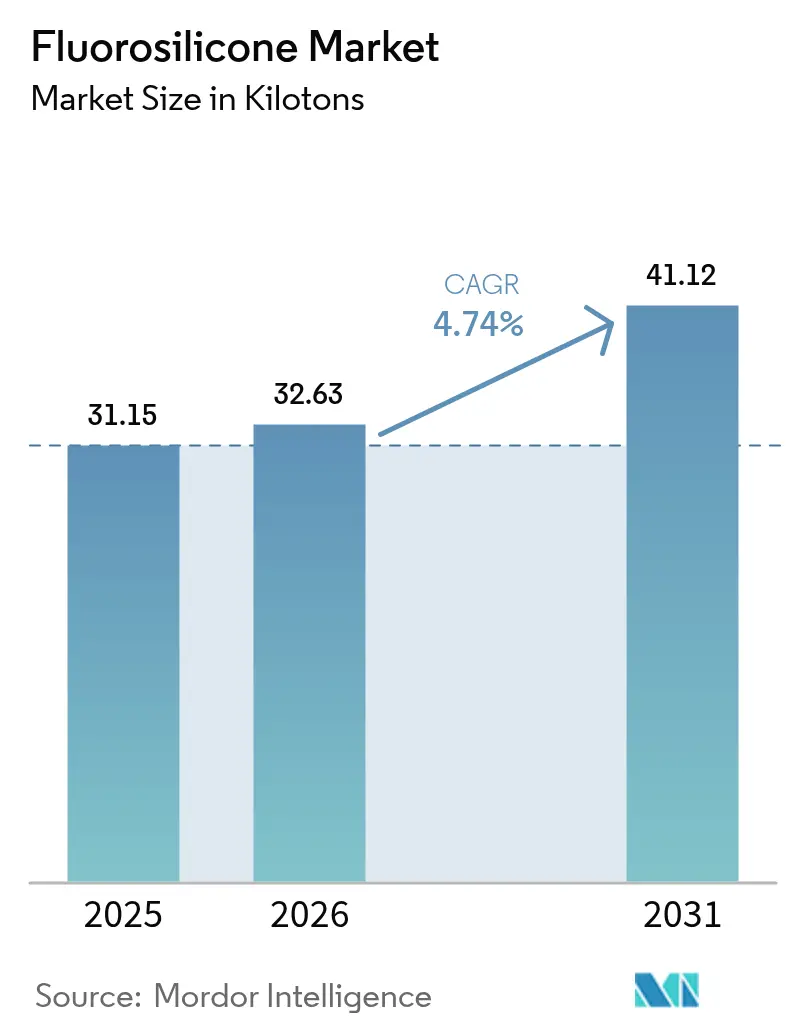
The fluorosilicone market size is expected to grow from 31.15 kilotons in 2025 to 32.63 kilotons in 2026 and is forecast to reach 41.12 kilotons by 2031 at 4.74% CAGR over 2026-2031. Demand stays linked to applications where conventional elastomers cannot tolerate wide temperature swings, aggressive fuels, or rapid decompression. Growth is reinforced by greater use in aerospace fuel and hydraulic circuits, thermal management loops in battery-electric vehicles, and ultra-high-pressure oilfield tools. Simultaneously, global PFAS regulations dismantle parts of the fluoropolymer supply chain yet open substitution windows for fluorosilicone-based designs. Regional momentum centres on Asia-Pacific, where automotive and electronics plants convert to higher-value sealing and coating materials, while producers in North America and Europe target differentiated grades for defence and deep-sea energy assets.
Key Report Takeaways
- By product type, elastomers led with 46.55% of fluorosilicone market share in 2025; lubricants and other specialties are set to advance at a 7.55% CAGR through 2031.
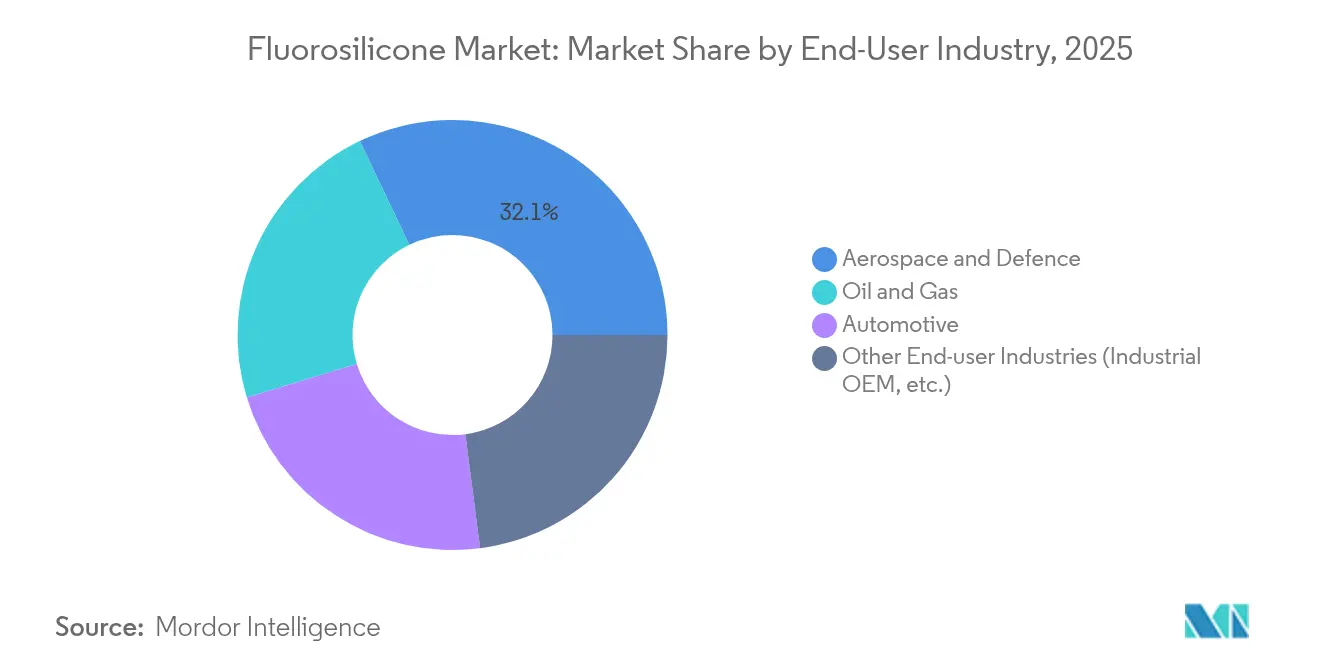
- By end-user industry, aerospace accounted for 32.10% of the fluorosilicone market size in 2025, whereas industrial OEM and other users are projected to record a 7.05% CAGR between 2026-2031.
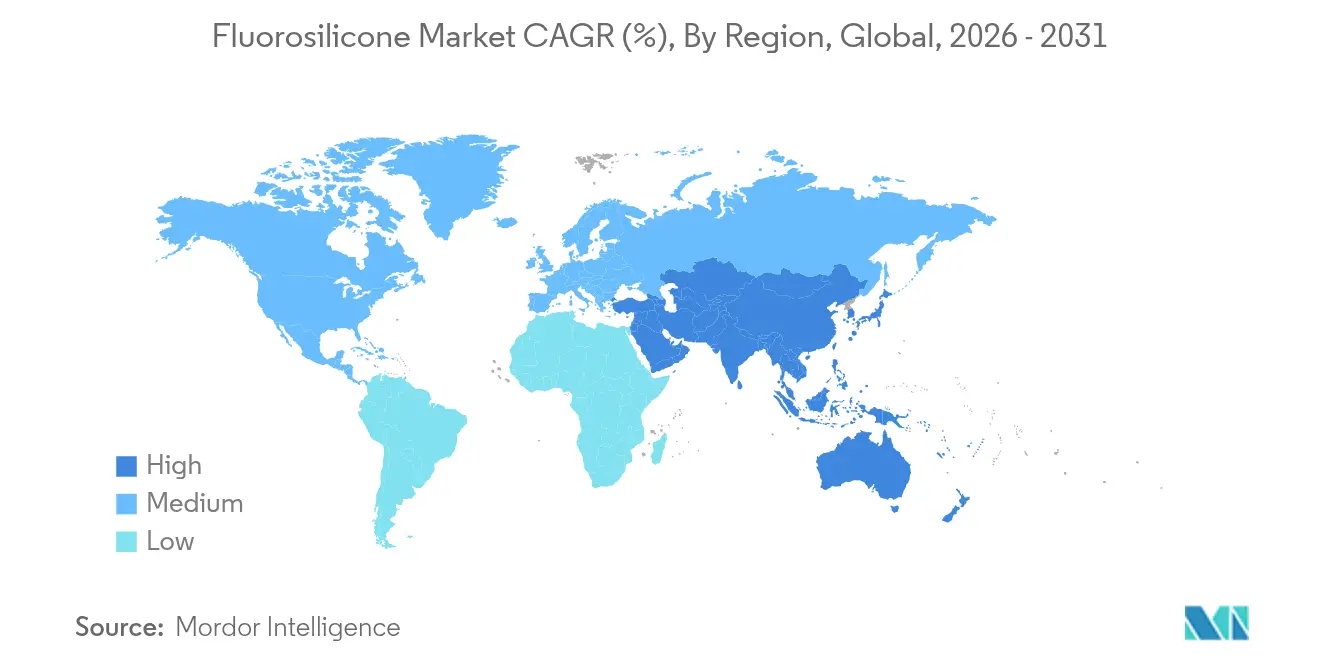
- By geography, Asia-Pacific held 38.55% of the fluorosilicone market share in 2025 and is forecast to register the fastest regional CAGR of 6.55% over the same period.
Note: Market size and forecast figures in this report are generated using Mordor Intelligence’s proprietary estimation framework, updated with the latest available data and insights as of 2026.
Market Trends and Insights
Drivers Impact Analysis of Fluorosilicone Market*
| Driver | (~) % Impact on CAGR Forecast | Geographic Relevance | Impact Timeline |
|---|---|---|---|
| Growing demand from aerospace & defence fuel/hydraulic systems | +1.2% | Global, concentrated in North America & Europe | Medium term (2-4 years) |
| Rising utilisation from the oil and gas industry | +0.9% | Global, with emphasis on offshore regions | Long term (≥ 4 years) |
| Adoption in high-temperature automotive turbo & bio-fuel lines | +0.8% | APAC core, spill-over to North America | Short term (≤ 2 years) |
| Emergence of flexible electronics and electric vehicle battery applications | +1.1% | APAC leading, expanding to North America & EU | Medium term (2-4 years) |
| Commercialisation of bio-sourced fluorinated siloxane monomer | +0.5% | EU & North America regulatory-driven adoption | Long term (≥ 4 years) |
| Source: Mordor Intelligence | |||
Growing Demand from Aerospace & Defence Fuel/Hydraulic Systems
Modern aircraft fuel circuits run hotter than 177 °C and cycle between synthetic bio-jet blends, hydraulic fluids, and anti-icing additives. Standard silicones fracture or swell, but trifluoropropyl-substituted chains in fluorosilicone stay elastic down to -73 °C, avoiding brittle failure at altitude. Leading seal suppliers now qualify fluorosilicone O-rings under MIL-DTL-25988 to satisfy rapid pressure cycling without fatigue. Weight-saving trends intensify the switch because thinner seals rely on superior chemical tenacity to preserve lifetime reliability[1].
Rising Utilisation from Offshore Oil and Gas Fields
Ultra-deep wells exceed 22,000 psi and approach 450 °F. Completion strings and FPSO fluid swivels face sour gas, high brine salinity, and rapid gas decompression. Fluorosilicone keeps modulus and volume change within API-spec limits where HNBR and perfluoroelastomer grades either crack or lose strength. Longer mean time between intervention lowers lifting costs, so operators specify fluorosilicone on packers, blow-out preventer seals, and downhole sensors for harsh-gas reservoirs.
Adoption in High-Temperature Automotive Turbo & Bio-Fuel Lines
Smaller high-output engines expose hoses and gaskets to cyclical loads between -40 °C and 250 °C. Liquid fluorosilicone rubber processes in injection molds that produce complex geometries with minimal flash, trimming assembly waste. Resistance to ethanol-rich gasoline prevents 10-15% swelling seen with nitrile seals. Form-in-place fluorosilicone gaskets also combine electromagnetic shielding with thermal durability for electric vehicle power electronics[2].
Emergence of Flexible Electronics and EV Battery Applications
Direct-immersion cooling for 800 V battery packs relies on dielectric fluids that neither conduct electricity nor degrade in hot spots. Fluorosilicone fluids offer low conductivity and remain stable above 200 °C, a range unreachable for hydrocarbon oils. In wearable devices, the polymer’s biocompatibility supports skin-contact sensors that survive perspiration and cleaning agents. Research prototypes use permeable fluorosilicone substrates to let vapor escape without compromising circuit function.
Restraints Impact Analysis of Fluorosilicone Market*
| Restraint | (~) % Impact on CAGR Forecast | Geographic Relevance | Impact Timeline |
|---|---|---|---|
| Availability of cost-competitive alternatives | -0.7% | Global, particularly price-sensitive markets | Short term (≤ 2 years) |
| Fluoromonomer price volatility & supply bottlenecks | -0.8% | Global supply chain impact | Medium term (2-4 years) |
| Environmental concerns related to fluorine compounds | -0.6% | EU & North America regulatory focus | Long term (≥ 4 years) |
| Source: Mordor Intelligence | |||
Availability of Cost-Competitive Alternatives
Advanced EPDM, HNBR, and VMQ compounds now reach fuel-resistance levels once exclusive to fluorosilicone, offering up to 70% material savings for moderate-temperature duties. The switch is fastest in mass-market automotive and appliance seals where total exposure temperatures seldom surpass 180 °C. However, in environments with simultaneous exposure to aggressive aromatics and large thermal swings, competing elastomers still fall short.
Fluoromonomer Price Volatility & Supply Bottlenecks
Only a handful of producers make trifluoropropyl vinyl silane, the critical monomer for fluorosilicone. Outages or regulatory delays tighten supply, sending spot prices higher and prompting some converters to ration capacity. Patent walls around advanced synthesis routes prolong the concentration. Car makers negotiating annual supply contracts often hedge with hybrid sealing stacks that blend fluorosilicone only in high-exposure sections[3].
*Our forecasts treat driver/restraint impacts as directional, not additive. The impact forecasts reflect baseline growth, mix effects, and variable interactions.
Fluorosilicone Market Segment Analysis
By Product Type:
Elastomers Outperform on VersatilityElastomers generated the largest slice of the fluorosilicone market in 2025, capturing 46.55% of volume. They dominate because high-consistency rubber and liquid silicone rubber formats suit press-molding, extrusion, and injection lines used by hose, gasket, and O-ring producers. Lubricants, greases, and dielectric fluids sit in a smaller but faster pool, expected to post a 7.55% CAGR through 2031 as battery-electric cooling circuits scale up. In mass production, liquid grades cut cycle times while holding tight tolerances, and two-part room-temperature-vulcanizing chemistries simplify on-line gasketing. Specialty coatings and antifoams stay niche yet profitable, sold to pharmaceutical and food processors that need chemically inert, non-tainting agents.
A wider formulation window allows suppliers to tailor hardness, resilience, and swelling limits to each customer specification. That flexibility preserves elastomer prominence even as volumes shift among industries. Meanwhile, the lubricant sub-segment rides the jump in direct-immersion battery cooling, where low electrical conductivity matters. Adoption also spreads in semiconductor vacuum pumps unable to tolerate hydrocarbon backstreaming. Across these uses the fluorosilicone market size for lubricants could move from lab scale to commercial tonnage by 2030.


By End-User Industry:
Aerospace Remains the Premium AnchorAerospace represented 32.10% of the fluorosilicone market in 2025 as OEMs and airlines accept the higher price point in exchange for decades-long reliability. Each wide-body aircraft contains hundreds of fluorosilicone O-rings, diaphragms, and grommets that secure fuel, hydraulic, and bleed-air functions. The next growth pocket lies in industrial OEM segments such as semiconductor, chemical processing, and precision instrumentation, which together are forecast to expand at 7.05% CAGR through 2031. Electric vehicle powertrain makers follow, using seals and hoses that withstand high glycol mixes and rapid thermal cycles.
Military aviation and space launch systems specify fluorosilicone for exposure down to cryogenic temperatures, pressing the material beyond the reach of alternative polymers. Oilfield service companies also rank among the top buyers, reserving the compound for sour gas tools. As environmental scrutiny intensifies, chemical producers market low-VOC, bio-sourced grades to mirror sustainable sourcing rules imposed by aircraft and defence contractors. This interplay between performance and compliance keeps the fluorosilicone industry pivotal in mission-critical applications.
Geography Analysis
APAC Fluorosilicone Market
Asia-Pacific controlled 38.55% of global shipments in 2025 and is poised to record a 6.55% CAGR to 2031. China remains the central node, thanks to high-volume automotive turbocharger production, rapid expansion in 300 mm semiconductor fabs, and state programs that target domestic supply chains for specialty chemicals. Indigenous chemists are trialling fluorosilicone foams for oil-water separation, a step that underlines the region’s innovation depth. Japan leverages precision process know-how to turn out ultra-clean grades for space and defence instruments, while South Korea’s chaebol structure benefited after KCC Corporation absorbed Momentive, cementing in-house supply security.
North America Fluorosilicone Market
North America maintains the second-largest consumption bloc, supported by its aviation, space, and defence sectors, plus shale and offshore operators that prefer premium materials. The fluorosilicone market size in the region is anchored by FAA and DoD certifications, which lock in long replacement cycles. Automotive demand is stable rather than stellar, hampered by cost-down targets, yet the shift to battery-electric trucks creates new thermal-interface and dielectric-fluid opportunities. Canadian oil sands push service temperatures high enough to justify fluorosilicone over FKM, extending regional demand into energy.
Europe Fluorosilicone Market
Europe faces the most intricate regulatory climate. Draft PFAS restrictions under REACH tighten reporting and substitution requirements, but carve-out exemptions exist for aerospace, medical, and critical energy infrastructure. German OEMs continue to fit fluorosilicone hoses on bio-fuel-capable engines, and French nuclear facilities keep using radiation-hard grades. Nordic countries explore recycled silicone loops that break down polymer chains into reusable monomers, a pathway for circularity that could stabilise long-term supply. Overall, European consumption grows slowly yet shifts toward sustainable, low-fluoro content designs, a niche that local producers are well placed to serve.
Value Chain Analysis
The fluorosilicone value chain begins with upstream fluorinated and silicone feedstocks, centered on the trifluoropropyl silane molecule set used to introduce the fluorinated side chain, along with conventional silicone intermediates (for example cyclic siloxanes such as D4). Treated silica fillers and catalysts are also part of polymerization and curing. A key structural constraint is the limited number of producers for critical fluoromonomers, which can lead to supply bottlenecks and price volatility for polymer makers and compounders.
Midstream players include polymer producers and specialty silicone formulators that convert base polymers into high-consistency rubber and liquid fluorosilicone rubber (F-LSR), along with fluids, greases, adhesives, sealants, and coatings. Downstream, compounders and molders produce O-rings, gaskets, hoses, diaphragms, and EMI-shielding parts qualified to application standards such as ASMR25988 (formerly MIL-DTL-25988), MIL-DTL-83528, and aerospace material specifications in the SAE AMS 3325 to AMS 3331 series. Distribution runs through direct supply to tier suppliers and OEMs in aerospace, automotive, and oil and gas, plus industrial distributors supporting MRO and small-batch engineered parts.
Competitive Landscape
The fluorosilicone market exhibits moderate concentration with established players leveraging technical expertise and manufacturing scale to maintain competitive positions, while regulatory pressures surrounding PFAS create opportunities for specialized formulations and sustainable alternatives. Wacker Chemie AG bolstered its "in-region-for-region" strategy by completing a specialty silicone facility in Zhangjiagang in 2025, enabling quicker turnarounds for Asian electronics and cosmetics clients. While Shin-Etsu Silicones carves out a robust presence in aerospace, DuPont zeroes in on ultra-high-purity perfluoroelastomer solutions, aiming to complement rather than duplicate fluorosilicone offerings.
Patent filings indicate a shift towards catalytic depolymerisation for recycling post-industrial scrap, hinting at preparations for take-back initiatives. Supply risks are concentrated on the trifluoropropyl monomer chain; in response, some converters are securing multi-year offtake agreements with Daikin and select smaller Chinese manufacturers.
Fluorosilicone Industry Leaders
-
Dow
-
Wacker Chemie AG
-
Momentive Performance Materials (KCC Corporation)
-
3M
-
Shin-Etsu Silicones of America, Inc.
- *Disclaimer: Major Players sorted in no particular order
Fluorosilicone Market Companies Covered in this Report
- 3M
- Dow
- Eagle Elastomer Inc.
- DLR Elastomer Engineering Ltd
- Marco Rubber & Plastics
- Momentive Performance Materials (KCC Corporation)
- Parker Hannifin Corp
- Shandong Huaxia Shenzhou New Material Co., Ltd.
- Shin-Etsu Silicones of America, Inc.
- Trelleborg Group
- Wacker Chemie AG
- Zhejiang Huanxin Fluoro Material Co. Ltd.
Market Opportunities and Future Outlook
Opportunities cluster where fuel, oil, and temperature exposure drive specification lock-in, and where designers rework material stacks under supply and compliance pressure across fluorinated chemistries. Defense and aerospace procurement linked to standards such as ASMR25988 and related AMS specifications keeps demand tied to qualified materials, which creates whitespace for suppliers that can support consistent quality, validated traceability, and rapid requalification for molded parts and compounds.
A second area of opportunity is the expansion of Asian production footprints and downstream deep-processing capacity, which improves availability of specialty grades and parts for regional automotive, electronics, and industrial OEM demand. For example, Putian Yitai Plastics signed an agreement in February 2026 for a 30,000-ton per year fluorosilicone industrial project in Sanming Economic Development Zone, China, and China also saw short-term supply tightness reflected in price increases during June 2026 maintenance periods. Product development efforts targeting thermal management and functional composites, including coatings and materials for EV and electronics under heat and chemical exposure, also support additional demand for fluorosilicone fluids, gels, and elastomeric sealing systems where conventional elastomers or hydrocarbons face performance or compatibility limits.
Recent Industry Developments in Fluorosilicone Market
- June 2026: Dow announced investment projects totaling about USD 100 million through the end of 2027 to expand specialty silicones manufacturing and innovation capabilities across the United States, China, and Japan. The program supports broader capacity and application development for high-value silicone materials, strengthening supply options for fluorosilicone-adjacent elastomers, fluids, and thermal and sealing solutions used by transportation, electronics, and industrial customers.
- May 2025: Wacker Chemie AG commissioned a specialty silicone manufacturing facility in Zhangjiagang, China, adding production capability for silicone fluids, emulsions, and elastomer gels, including fluorosilicones. The site increases in-region supply for Asia-Pacific customers and reduces lead times for electronics, automotive, and industrial accounts that require higher-value sealing and coating materials.
- July 2024: Momentive Performance Materials (KCC Corporation) announced plans to expand fluorosilicone production capacity in Europe to address rising demand, particularly from automotive applications. The move supports regional availability of fluorosilicone compounds and helps shorten supply chains for European molders and tier suppliers qualifying materials for higher-temperature and fuel-exposure components.
Fluorosilicone Market Report Scope and Research Methodology
Market Definition and Coverage
For this report, the fluorosilicone market is defined as fluorinated silicone materials and formulations sold for industrial use where resistance to fuels, oils, solvents, and temperature cycling is a buying requirement, and revenue is counted at the point of commercial sale.
Scope exclusions: We exclude laboratory-only materials, R&D grade samples, and non-industrial consumer uses where fluorosilicone is not intentionally specified as the functional material.
Segments Covered in This Report
- By Product Type
- Elastomer
- Adhesives and Sealants
- Antifoams
- Coating
- Other Product Types (Lubricants, etc.)
- By End-user Industry
- Oil and Gas
- Automotive
- Aerospace and Defence
- Other End-user Industries (Industrial OEM, etc.)
- By Geography
- Asia-Pacific
- China
- India
- Japan
- South Korea
- Rest of Asia-Pacific
- North America
- United States
- Canada
- Mexico
- Europe
- Germany
- United Kingdom
- France
- Italy
- Rest of Europe
- South America
- Brazil
- Argentina
- Rest of South America
- Middle East and Africa
- Saudi Arabia
- South Africa
- Rest of Middle East and Africa
- Asia-Pacific
Data Sources, Market Sizing, and Validation
Desk Research
Desk work was used to build the fact base for where fluorosilicone demand comes from and what drives price movement across end uses. We reviewed public sources such as USITC trade statistics, UN Comtrade, OECD industry indicators, the US Bureau of Labor Statistics producer price series (as directional checks for chemicals and rubber goods), and safety and technical documentation available through public regulatory portals and standards bodies.
On the supply side, we relied on company filings, investor presentations, and reputable press coverage to map capacity additions, product positioning, and application focus. Patent databases were also scanned to see where new formulations are being targeted, which helped validate where volumes could realistically shift. For price context, we used approved paid subscriptions for company financials and news intelligence, and, where needed, we used additional public references to check shipment and trade patterns. These sources are illustrative, and other public references were also used for data collection, validation, and clarification.
Primary Interviews and Surveys
Primary interviews focused on application-level demand signals and the practical price range used in real contracts, since those details are not consistently visible in public data. We spoke with material suppliers, compounders, and downstream users in transportation, aerospace, oil and gas, and electronics across major producing and consuming regions, then used inputs to adjust assumptions and close gaps in the desk model.
Distribution of primary research fieldwork respondents
| Company type | Respondent position | Region |
|---|---|---|
| Top tier: 35% | CXOs: 14% | APAC: 44% |
| Mid tier: 45% | Functional/Unit leaders: 35% | EMEA: 37% |
| Smaller Players: 20% | Managers: 51% | Americas: 19% |
Market-Sizing & Forecasting
Sizing starts with a top-down build where demand pools are reconstructed from end-use activity and material intensity, then converted into revenue using an application-specific price deck. In practice, we tied demand to indicators such as aerospace and industrial MRO activity, transportation sealing and gasket replacement cycles, oil and gas equipment maintenance intensity, and electronics production trends where chemical resistance is critical.
To keep the model realistic, we ran selective bottom-up checks by rolling up supplier disclosures and by using sampled price per kilogram ranges multiplied by implied consumption volumes for key applications like elastomer sealing, adhesives and sealants, coatings, and release fluids. When bottom-up coverage was incomplete, gaps were handled by using validated penetration assumptions and by keeping price spreads consistent with interview feedback for each end-use. Forecasting relied mainly on scenario analysis, where variables such as end-market output growth, substitution versus other elastomers in harsh-service uses, and expected raw material cost pressure were stress-tested and then aligned to consensus ranges heard in primary discussions.
Data Validation & Update Cycle
Model outputs are checked against independent signals, including trade flows, end-use production trends, and the implied price per kilogram range after currency conversion, so outliers can be flagged early. If a region or application shows a jump that cannot be explained by the drivers, assumptions are revisited and follow-up calls are triggered to confirm whether the shift is real or a data timing issue.
Before sign-off, the work goes through multi-step analyst reviews where unit consistency, year alignment, and variance versus prior periods are rechecked. Reports are refreshed annually, with interim updates when material events occur, such as major capacity changes or sudden pricing shocks. Right before delivery, a fresh pass is performed so clients receive the latest updated view.
Mordor Intelligence's Fluorosilicone Market Size Measured Against Other Published Estimates
Published market sizes for fluorosilicone often differ because the scope boundary is drawn differently and because pricing assumptions are not refreshed on the same schedule. Variations also come from how each source handles currency conversion timing and whether figures are built from volume signals or from revenue signals.
In this study, the biggest gap driver is the price deck, since contract prices can move with raw material swings and with the mix shift between elastomers, adhesives and sealants, and specialty coatings. The table spread is also influenced by whether release fluids and antifoams are counted as part of the market, and whether the model relies on a single base-year conversion rate versus an average rate aligned to the reference year. With quarterly checks on price points and a final currency normalization step at the reference-year average, the estimate stays tied to what is being paid in market, which is how Mordor Intelligence avoids overstating value when volume is stable but prices are volatile.
Benchmark comparison
| Source | Market Size | Gaps in Research Methodology |
|---|---|---|
| Mordor Intelligence | USD 1.10 B (2025) | |
| Global Research Publisher A | USD 285.48 M (2025) | Often reflects a narrower counted scope centered on core elastomer revenue, and it can apply a fixed base-year price set that does not fully follow application mix shifts. |
| Industry Research Portal B | USD 281.90 M (2024) | Uses an earlier reference year and may carry forward currency and pricing assumptions without rechecking contract-level ranges, which can compress the value estimate when prices rise. |
Overall, the comparison points to two practical causes of divergence, which are what gets included as fluorosilicone revenue and how fast prices and currency are refreshed in the model. By keeping application inclusions explicit and by revalidating price ranges against end-use reality, we deliver a number that can be traced back to clear demand and pricing inputs.
Key Questions Answered in the Report
What is the current size of the fluorosilicone market?
The fluorosilicone market size stood at 32.63 kilotons in 2026 and is projected to reach 41.12 kilotons by 2031 at a 4.74% CAGR.
Which segment holds the largest share of the fluorosilicone market?
Elastomers commanded 46.55% fluorosilicone market share in 2025 due to their adaptability across aerospace, automotive, and oil-and-gas sealing duties.
Why is Asia-Pacific the fastest-growing region?
Asia-Pacific benefits from concentrated automotive, electronics, and chemical production capacity, translating into a regional CAGR of 6.55% through 2031 backed by supportive industrial policies.
How do PFAS regulations influence demand?
Tighter PFAS rules restrict some fluoropolymer uses but simultaneously steer designers toward fluorosilicone as a compliant substitute in fuel systems, EV cooling loops, and flexible electronics.