
Flock Adhesives Market Size and Share
Market Overview
| Study Period | 2021 - 2031 |
|---|---|
| Market Size (2026) | USD 3.10 Billion |
| Market Size (2031) | USD 4.05 Billion |
| Growth Rate (2026 - 2031) | 5.48 % |
| Fastest Growing Market | Asia Pacific |
| Largest Market | Asia Pacific |
| Market Concentration | Medium |
Major Players *Disclaimer: Major Players sorted in no particular order Image © Mordor Intelligence. Reuse requires attribution under CC BY 4.0. | |
Flock Adhesives Market Analysis by Mordor Intelligence
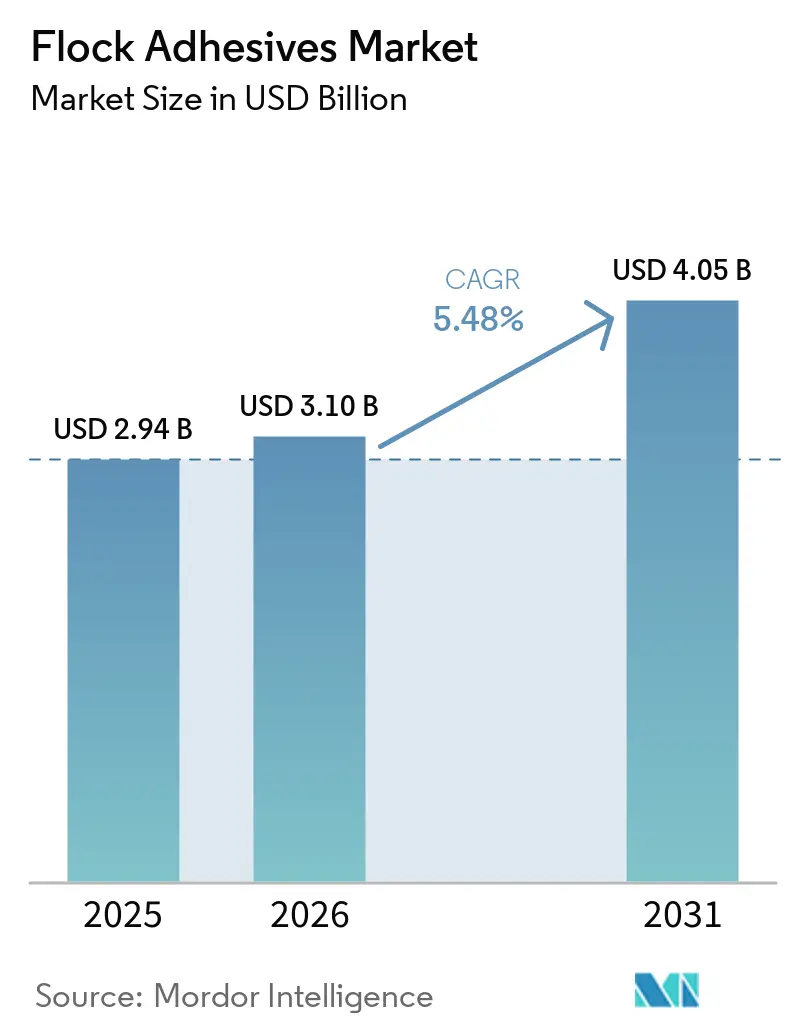
The Flock Adhesives Market size was valued at USD 2.94 billion in 2025 and is estimated to grow from USD 3.10 billion in 2026 to reach USD 4.05 billion by 2031, at a CAGR of 5.48% during the forecast period (2026-2031). Growth is anchored in automotive interior demand, accelerated by rising electric-vehicle (EV) production, and reinforced by premium packaging requirements that emphasize soft-touch aesthetics and thermal functionality. Regulatory shifts toward water-based and VOC-free chemistries are prompting rapid product reformulation, especially as the European Union restricts diisocyanates and China tightens interior-emission limits. Automotive applications command the largest slice of the flock adhesives market at 41.78% in 2025 and also expand the fastest at 6.18% CAGR through 2031, underscoring the segment’s dual role as volume base and innovation engine. Asia-Pacific retains geographic leadership with 51.20% share in 2025 and a 6.05% CAGR outlook through 2031, benefiting from concentrated automotive manufacturing footprints and expanding EV battery capacity. Meanwhile, polyurethane resin systems dominate with 38.19% share, yet “other” chemistries display the strongest 6.65% CAGR as formulators pivot toward acrylic, epoxy and non-isocyanate alternatives to stay ahead of incoming regulation.
Key Report Takeaways
- By resin type, polyurethane led with 37.55% of flock adhesives market share in 2025, whereas other resin types are projected to post the highest 6.53% CAGR through 2031.
- By application, the automotive segment captured 41.78% share of the flock adhesives market size in 2025 and is projected to advance at a 6.18% CAGR between 2026-2031.
- By geography, Asia-Pacific accounted for 51.20% of the flock adhesives market share in 2025 while the same region is set to expand at a 6.05% CAGR to 2031.
Note: Market size and forecast figures in this report are generated using Mordor Intelligence’s proprietary estimation framework, updated with the latest available data and insights as of 2026.
Global Flock Adhesives Market Trends and Insights
Drivers Impact Analysis*
| Driver | (~) % Impact on CAGR Forecast | Geographic Relevance | Impact Timeline |
|---|---|---|---|
| Surging demand for coated fabrics and luxury finish products | +1.2% | Global, with premium segments in North America & Europe | Medium term (2-4 years) |
| Lightweight, low-carbon vehicle interior parts push adoption | +1.8% | APAC core, spill-over to North America & Europe | Long term (≥ 4 years) |
| Regulatory shift toward water-based / VOC-free chemistries | +1.1% | Global, led by EU & China regulations | Short term (≤ 2 years) |
| Flocked thermal-management liners in electric vehicles battery packs | +0.9% | APAC & North America EV manufacturing hubs | Medium term (2-4 years) |
| Premium unboxing aesthetics in consumer-electronics packaging | +0.4% | Global, concentrated in consumer electronics markets | Short term (≤ 2 years) |
| Source: Mordor Intelligence | |||
Surging Demand for Coated Fabrics and Luxury Finish Products
Automotive and luxury-goods producers are stepping up use of flocked materials to signal elevated quality. Cabin parts such as dashboards, pillars and storage trays gain a plush feel that improves grip and cuts rattling noise. Premium packaging makers adopt the same technology so that jewelry boxes or smartphone cases feel exclusive from first touch. The tactile upgrade supports higher retail prices and strengthens brand differentiation. Together these factors translate into a wider, more stable demand base for flock adhesives[1].
Lightweight, Low-Carbon Vehicle Interior Parts Push Adoption
Car makers are substituting heavy fasteners with adhesive-bonded composite panels to shave grams from every model. Flock adhesives secure thin plastics and fabric laminates while meeting crash, vibration and durability tests. Mass reductions directly extend EV driving range, a metric closely watched by consumers and regulators. Assembly lines also benefit because fewer clips and screws cut cycle times and simplify recycling. As electrification spreads, the weight-saving argument keeps flock solutions on engineering shortlists.
Regulatory Shift Toward Water-Based / VOC-Free Chemistries
The European Union now restricts diisocyanate levels and mandates extra worker training above 0.1% content, while China enforces lower interior-emission caps. These policies push formulators toward acrylic dispersions, non-isocyanate polyurethanes and other low-solvent systems. Brands that redesign early gain a compliance edge in global sourcing bids. End-users benefit from safer workplaces and greener product labels. The rule changes therefore act as a growth catalyst for next-generation flock adhesives.
Flocked Thermal-Management Liners in Electric Vehicles Battery Packs
Battery modules run hot and require barriers that spread heat yet block electrical shorts. Short fibers anchored by specialty adhesives create an insulating but conductive layer on cell housings. The material must also survive fire-safety tests and long vibration cycles. Because performance stakes are high, automakers pay premium prices for proven formulations. Each new EV launch, therefore, lifts the value pool for flock suppliers focused on thermal applications.
Restraints Impact Analysis*
| Restraint | (~) % Impact on CAGR Forecast | Geographic Relevance | Impact Timeline |
|---|---|---|---|
| Volatile isocyanate and acrylate feedstock prices | -0.8% | Global, with acute impact in regions dependent on imports | Short term (≤ 2 years) |
| Tightening solvent-emission regulations | -0.6% | EU & North America regulatory jurisdictions | Medium term (2-4 years) |
| Competition from laser-texturing and alternative finishes | -0.4% | Premium automotive segments globally | Long term (≥ 4 years) |
| Source: Mordor Intelligence | |||
Volatile Isocyanate and Acrylate Feedstock Prices
Adhesive makers rely on petrochemical derivatives whose costs whipsaw with oil and supply-chain shocks. Recent methacrylic-acid oversupply drove a 12% price drop, only for resin producers to impose sharp increases weeks later. Long fixed-price contracts with automotive OEMs limit the ability to pass surcharges through. Smaller formulators are especially exposed because they lack hedging scale and diversified portfolios. Margin uncertainty discourages bold capacity investments during turbulent periods.
Tightening Solvent-Emission Regulations
The EU will cap formaldehyde at 0.062 mg/m³ inside vehicles from August 2026, forcing extensive lab tests and documentation. Reformulating away from high-VOC solvents can alter adhesion strength, aging resistance and cure speed. Additional R&D outlays hit profitability even before new grades reach the market. Delays in regulatory approval may create supply gaps that end-users must bridge with substitutes. Consequently, the rulebook imposes both direct expense and sales-cycle friction on the industry.
*Our forecasts treat driver/restraint impacts as directional, not additive. The impact forecasts reflect baseline growth, mix effects, and variable interactions.
Segment Analysis
By Resin Type: Polyurethane Dominance Faces Regulatory Pressure
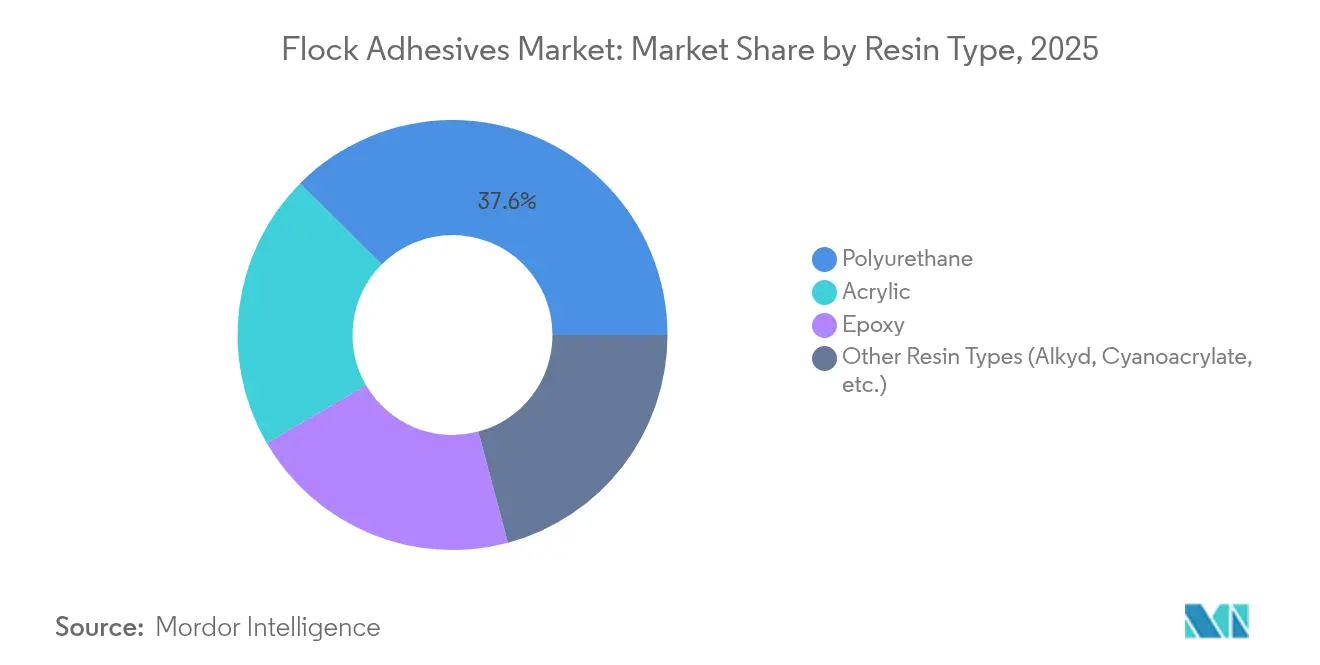
Polyurethane captured 37.55% of flock adhesives market share in 2025, buoyed by broad compatibility with automotive substrates and strong thermal resilience. Yet regulatory scrutiny of isocyanates is shifting demand, evidenced by the 6.53% CAGR projected for “other” resin types. The flock adhesives market size for non-isocyanate chemistries is expected to outpace incumbents as acrylic and epoxy alternatives gain traction, driven by inherently lower VOCs and simplified handling. Henkel’s bio-based polyurethane containing 71% renewable content demonstrates a 60% CO₂ reduction versus standard formulas, signaling how sustainability narratives translate into purchasing criteria.
Regulators require worker training and stricter labelling for diisocyanate products, prompting OEMs to request compliant substitutes. Formulators respond by scaling acrylic dispersions and non-isocyanate polyurethane (NIPU) chemistries that meet adhesion, flexibility and heat-cycling needs without surpassing 0.1% diisocyanate thresholds. Suppliers able to balance compliance, performance and cost will command premium margins as legacy options face phased restriction.

By Application: Automotive Sector Drives Both Scale and Innovation
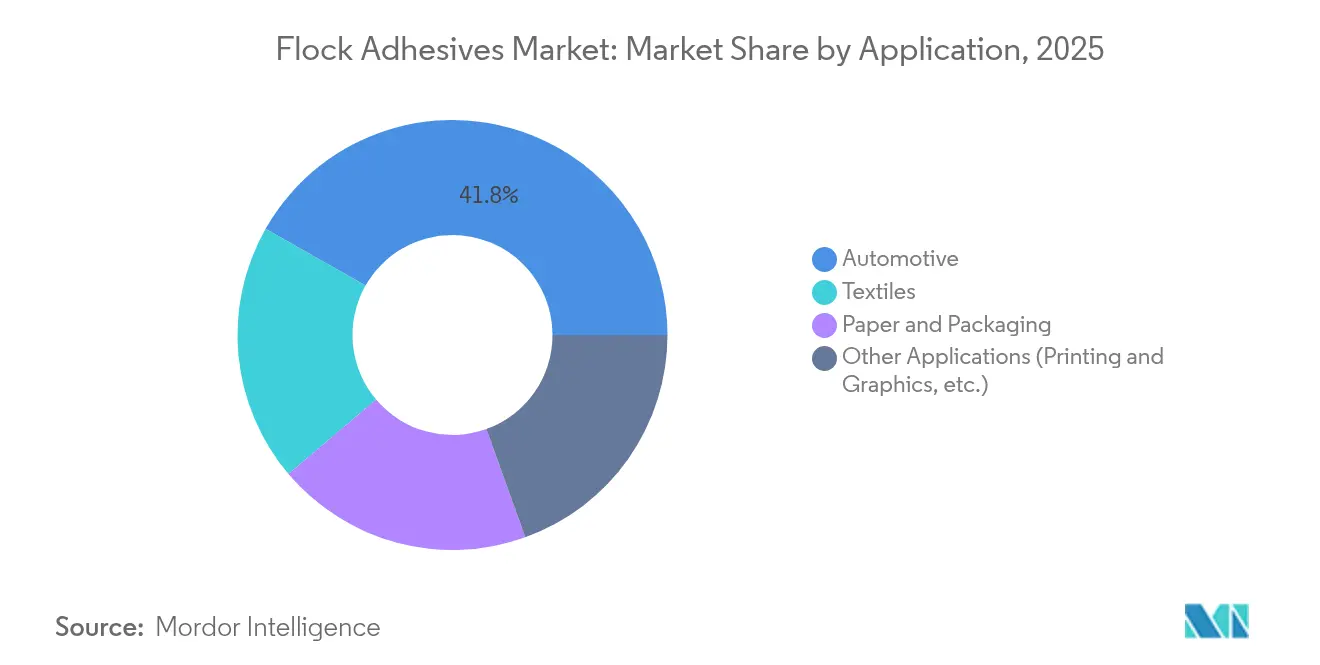
Automotive interiors dominated 2025 with 41.78% flock adhesives market share and will expand at 6.18% CAGR, propelled by demand for tactile dashboards, door trims and battery-pack liners. The flock adhesives market size allocated to automotive electronics alone rises as wire harnesses, seat sensors and infotainment modules require soft, abrasion-resistant housing. EV development accelerates this trend, because flocked interfaces dissipate heat and reduce noise within compact battery compartments.
Beyond vehicles, textiles and luxury packaging remain important but slower-growing outlets. Technical fabrics use flock to improve grip and insulation in sportswear and medical garments, while high-end consumer-electronics brands rely on flocked inserts for premium unboxing experiences. Printing and graphics gradually lose share to digital methods that need fewer specialty coatings, yet still absorb niche demand for tactile marketing materials. Automotive’s innovation pull therefore reverberates across all segments, as FMVSS 302 burn-rate limits enforce stringent flame-spread criteria on every flock adhesive entering the vehicle cabin.
Geography Analysis
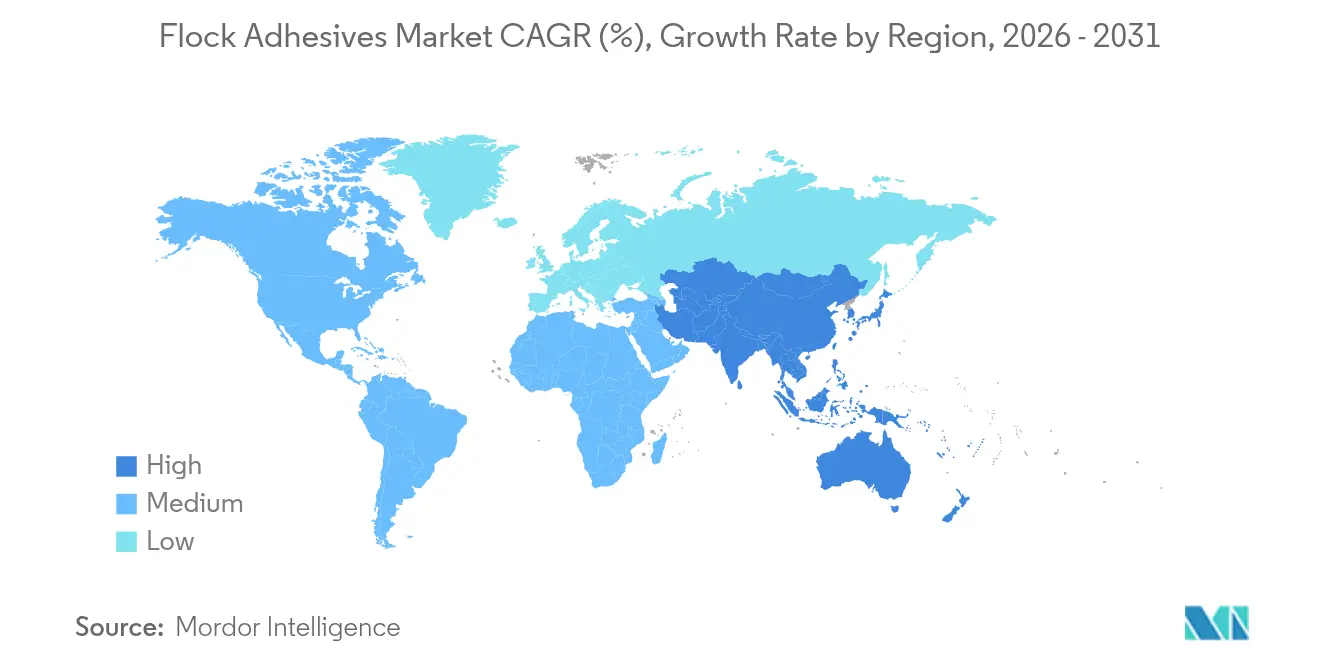
Asia-Pacific held 51.20% flock adhesives market share in 2025 and is set to grow at 6.05% CAGR through 2031. China anchors regional demand as domestic brands and export-oriented assemblers adopt flocked interiors to elevate perceived quality and meet low-VOC mandates. Sika’s new Liaoning and Singapore plants illustrate local capacity investments aimed at shortening lead times and tailoring chemistries for emerging battery-thermal needs. Japan and South Korea complement volume with materials science leadership, scaling epoxy-based and low-formal-emission systems for electronics as well as autos.
North America follows with mature but technologically demanding consumption. OEMs enforce strict sourcing criteria on sustainability and supply-chain transparency, incentivizing rapid adoption of water dispersions and bio-based content. Public infrastructure and military procurement channels support niche flocked applications in rail interiors and aerospace cabin fittings, keeping baseline demand intact despite plateaued vehicle output.
Europe blends tight regulation with innovation leadership. The continent’s Circular Economy Action Plan requires removable batteries in devices by 2027, spawning new debondable-adhesive niches where flock must cleanly separate at end-of-life. Companies like Power Adhesives recently introduced certified biodegradable hot-melt systems containing 44% bio-based content, a template likely to spread into flock formulations.
South America, the Middle East and Africa collectively represent modest volumes but rising importance as supply chains diversify. Brazil expands automotive assembly capacity that relies on locally sourced flocked trims, while petrochemical integration in the Gulf provides competitive resin feedstock. African markets remain early-stage yet draw investment from consumer-electronics packagers seeking proximity to high-growth urban centers.
Regulatory Landscape
Regulatory compliance for flock adhesives is increasingly shaped by chemical classification, labeling, and emissions limits that push formulators toward water-based and low-VOC chemistries. In the European Union, diisocyanate restrictions and related worker training requirements above 0.1% content are influencing procurement and reformulation priorities for polyurethane-based systems used in automotive interiors, while China is tightening interior-emission caps for cabin materials.
Beyond emissions and worker-safety rules, broader chemical governance and standards affect market access. The EU advanced work in 2025-2026 on simplifying chemical labeling and packaging requirements through updates tied to the CLP framework, and the United Kingdom enacted The Chemicals (Health and Safety) (Amendment, Consequential and Transitional Provision) Regulations 2026, updating elements of chemical classification and market access requirements. Across regions, substance reporting and documentation expectations under REACH (EU) and TSCA (United States) remain core gating items for global suppliers. Performance verification increasingly references standardized tests such as ISO 4624 pull-off adhesion strength for technical applications.
Value Chain Analysis
The flock adhesives value chain starts with upstream suppliers of key feedstocks such as polyurethane, acrylic, and epoxy resins, along with additives including tackifiers, catalysts, and rheology modifiers, and, in solvent-borne systems, carriers used to tune viscosity and application behavior. Specialty adhesive formulators then compound and tailor products for flocking requirements such as fiber anchoring, open time, cure profile, heat resistance, and low-emission performance, supported by quality control tied to adhesion strength and durability testing.
Downstream, adhesives move through direct OEM supply and specialty chemical distributors that provide technical service for application equipment setup, process window control, and compliance documentation for automotive, textiles, and packaging converters. Bottlenecks tend to cluster around raw-material price volatility (notably isocyanate and acrylate-linked inputs), compliance-driven reformulation cycles that can disrupt qualification timelines, and the need for consistent polymer and fiber compatibility across multi-plant supply footprints. Partnerships between large chemical companies and adhesive manufacturers, including efforts aimed at low-emission and non-isocyanate alternatives, increasingly shape differentiation as end users push for standardized, globally deployable specifications.
Competitive Landscape
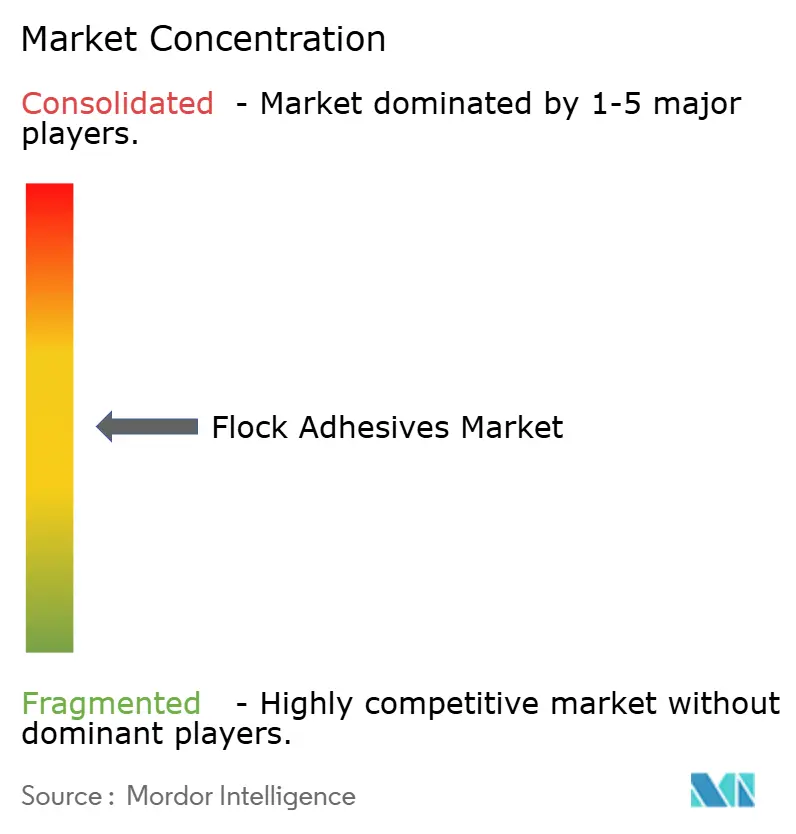
The flock adhesives industry is moderately fragmented. 3M, Henkel and Sika constitute the global tier, differentiated by broad portfolios, multi-region production and heavy R&D spend. DELO commits 15% of annual revenue to research, far exceeding industry norms, which supports novel chemistries for battery thermal applications. Strategy centers on value, not price cutting, because flocking often appears in safety-critical or premium tactile roles where performance premiums are acceptable.
Technology partnerships accelerate sustainability pivots. Henkel collaborates with Celanese on CO₂-captured feedstocks, while Sika engineers dispersions for ultra-low-VOC dashboards. Regional specialists such as SwissFlock AG and Nyatex command niche shares by offering custom rheology and fiber-anchor solutions to mid-tier OEMs that global giants overlook.
Threats arise from laser-texturing, plasma coating and micro-molding processes that minimize materials and streamline recycling. KEYENCE’s laser structuring can etch tactile micro-patterns directly onto substrates, eliminating adhesive layers and fibers while reducing energy usage. Incumbents counter with value propositions around superior soft-touch, grip and acoustic dampening that purely textured plastics still struggle to match. Feedstock volatility complicates margin management, pressing producers to hedge raw materials and explore bio-based or waste-stream feedstocks that decouple pricing from petrochemicals.
Flock Adhesives Industry Leaders
-
H.B. Fuller Company
-
Henkel AG & Co. KGaA
-
Sika AG
-
Arkema
-
Dow
- *Disclaimer: Major Players sorted in no particular order
Market Opportunities and Future Outlook
A clear opportunity is in accelerated substitution toward water-based, solvent-free, and non-isocyanate systems as OEMs align interior-material specifications with tightening VOC and diisocyanate constraints, particularly in Europe and China. Automotive remains the largest application base at 41.78% share in 2025, and flock adhesives are increasingly used for functional roles beyond aesthetics, including noise reduction and EV battery-pack liner performance. This creates room for validated low-emission formulations that still meet heat, abrasion, and durability targets.
Additional whitespace is emerging where compliance and standardization requirements create switching moments. Suppliers that pair product performance with documented test regimes, such as ISO 4624 pull-off adhesion verification, and that provide robust SDS and substance reporting can reduce qualification friction for multi-region sourcing. On the supply side, capacity and localization investments in Asia-Pacific support faster customization for EV-linked thermal-management use cases and premium interior trims. Sustainability-oriented formulations, including bio-based and CO2-reduced content approaches highlighted by large global players, also offer a route into premium packaging and durable-goods segments where brand labeling and low-odor claims influence material selection.
Recent Industry Developments
- June 2026: The Council of the European Union advanced a compromise text to amend the EU CLP framework, targeting simplified labeling and packaging requirements for chemical products. For flock adhesive suppliers selling across borders, streamlined labeling rules can reduce administrative overhead while maintaining pressure for accurate hazard communication for isocyanate- and solvent-linked systems.
- June 2025: Sika opened a new technology center and manufacturing plant in Pune, Maharashtra, India, designed to produce adhesives and sealants including flock adhesives. The combination of local production and R&D capability supports faster customer qualification cycles in automotive and industrial end uses, and shortens lead times in a region that anchors global demand.
- July 2024: Henkel Adhesives Technologies India Private Limited completed Phase III expansion of its Kurkumbh manufacturing facility near Pune, Maharashtra. The added capacity and manufacturing footprint strengthens supply continuity for high-performance adhesive grades used by Indian industries, reinforcing localized sourcing for applications that need consistent quality and compliance documentation.
Research Methodology Framework and Report Scope
Market Definition and Coverage
For this study, the flock adhesives market is defined as revenue from adhesive chemistries used to bond flock fibers onto substrates for a durable flocked surface across industrial and consumer uses. Our sizing is tracked in value terms and is organized consistently across major regions.
Scope exclusions: This sizing excludes the value of flock fibers, flocking equipment, and downstream finished goods where adhesive cost is embedded but not separately sold.
Segmentation Overview
- By Resin Type
- Acrylic
- Polyurethane
- Epoxy
- Other Resin Types (Alkyd, Cyanoacrylate, etc.)
- By Application
- Automotive
- Textiles
- Paper and Packaging
- Other Applications (Printing and Graphics, etc.)
- By Geography
- Asia-Pacific
- China
- Japan
- India
- South Korea
- ASEAN Countries
- Rest of Asia-Pacific
- North America
- United States
- Canada
- Mexico
- Europe
- Germany
- United Kingdom
- France
- Italy
- Spain
- Russia
- NORDIC Countries
- Rest of Europe
- South America
- Brazil
- Argentina
- Rest of South America
- Middle East and Africa
- Saudi Arabia
- South Africa
- Rest of Middle East and Africa
- Asia-Pacific
Data Sources, Market Sizing, and Validation
Desk Research
Desk research started with public signals that help explain where flock coatings and related adhesive use is rising or slowing, and then those signals were translated into demand drivers for the model. We referred to sources such as US Census Bureau manufacturing data, Eurostat production indicators, UN Comtrade trade statistics, and national customs portals to understand the direction of imports and exports for relevant chemical and coated material categories.
To keep assumptions realistic, we also used safety and regulatory references such as OSHA and ECHA publications, plus technical papers in peer reviewed polymer and coatings journals to confirm typical chemistries, cure systems, and usage patterns. Company filings, investor presentations, and press coverage were used to track capacity changes, product launches, and end market exposure. For cross checking financial and corporate linkages, a paid subscription for company financials and intelligence was used selectively. The desk sources listed here are illustrative and not exhaustive, since many other references were used for data collection, validation, and clarification.
Primary Interviews and Surveys
Primary inputs were collected through expert interviews and structured surveys across raw material and formulation roles, converters, and end users that specify flocked parts in automotive, textiles, and packaging. We used these conversations to confirm what gets bought as a flock adhesive versus adjacent bonding products, and to validate regional demand differences, price movement, and typical substitution behavior.
We also revisited respondents when early model outputs created unusual jumps by resin type or application, so the final assumptions stayed aligned with practical buying patterns.
Distribution of primary research fieldwork respondents
| Company type | Respondent position | Region |
|---|---|---|
| Top tier: 34% | CXOs: 16% | APAC: 46% |
| Mid tier: 44% | Functional/Unit leaders: 29% | EMEA: 33% |
| Smaller Players: 22% | Managers: 55% | Americas: 21% |
Market-Sizing & Forecasting
The core model uses top-down and bottom-up logic together, so totals stay realistic and still remain explainable. On the top-down side, production and trade indicators for relevant chemical intermediates and adhesive categories are used to reconstruct the addressable demand pool, which is then filtered by the share that typically goes into flock bonding use cases.
Those totals are corroborated through selective bottom-up approximations, such as sampled supplier revenue bands, channel feedback on application splits, and an ASP times volume check for high-usage areas like automotive interior parts and textile coatings. Key inputs that were tracked include end-use output trends for vehicles and interior components, textile and apparel production direction, packaging activity, resin and solvent price movement that shifts formulated adhesive pricing, and observed migration toward water-based or low-VOC systems where regulation tightens.
For forecasting, scenario analysis was used with a base case anchored to consensus views gathered in interviews, and then adjusted using macro signals such as industrial production and vehicle build outlook. When bottom-up checks could not cover smaller local formulators, gaps were handled using region-specific density factors derived from import dependence, converter activity, and the typical fragmentation level seen in field feedback.
Data Validation & Update Cycle
Before finalizing, we ran multiple variance checks across region totals, application shares, and implied pricing, so outputs do not drift away from real purchasing behavior. Model results were compared against independent signals such as trade direction, industrial output cycles, and known capacity changes, and then anomalies were reviewed and corrected through a second analyst pass.
If a major input changes materially, such as a sharp resin price reset, a regulatory shift impacting solvent systems, or an abrupt change in automotive production, respondents are re-contacted to confirm the implication for volumes and pricing. Reports are refreshed annually, and interim updates are made when material events are identified. Right before publication, a fresh review is completed so clients receive the most current view available.
Mordor Intelligence's Flock Adhesives Market Size Compared With Other Published Estimates
Published market sizes for flock adhesives often do not match because each publisher draws the market boundary in a different way, and they also choose different timing for prices and currency conversion. In our work, the same core demand pool is kept consistent across regions so that the yearly numbers do not shift due to definition changes.
Trade direction for relevant chemical categories, application level demand checks from automotive interiors and textile output, and repeated interview validation are the evidence points that keep Mordor Intelligence's estimate tied to the sellable flock-adhesive demand pool, rather than broader adhesive baskets. Differences also come from whether paper and packaging is treated as a full end-use block, how resin mix change is priced year to year, and whether a publisher uses a more aggressive scenario for adoption in Asia.
Benchmark comparison
| Source | Market Size | Gaps in Research Methodology |
|---|---|---|
| Mordor Intelligence | USD 3.10 B (2026) | |
| Industry Publisher A | USD 3.34 B (2026) | Uses a broader inclusion set that can pull in adjacent specialty adhesive demand beyond flock bonding in automotive and textiles, and applies a higher base-year pricing level that lifts the 2026 value. |
| Industry Publisher B | USD 3.07 B (2026) | Starts from a lower 2025 base and carries forward a more conservative pricing progression for formulated systems, which reduces the implied 2026 value even if volumes are similar. |
The spread in published values is mainly explained by boundary choices and how pricing is carried into the current year, not by completely different views on where flocked applications are used. By keeping the scope tied to dedicated flock bonding demand and by checking outputs against external activity signals and interview feedback, the final figure stays transparent, repeatable, and easier to reconcile across years.
Key Questions Answered in the Report
What is the current size of the flock adhesives market?
The Flock Adhesives Market size was valued at USD 2.94 billion in 2025 and is estimated to grow from USD 3.10 billion in 2026 to reach USD 4.05 billion by 2031, at a CAGR of 5.48% during the forecast period (2026-2031).
How fast is the flock adhesives market expected to grow?
The market is projected to expand at a 5.48% CAGR between 2026 and 2031.
Which application segment leads the flock adhesives market?
Automotive interiors held 41.78% share in 2025 and will remain the largest and fastest‐growing segment through 2031.
Why are water-based flock adhesives gaining traction?
EU and Chinese regulations restricting VOCs and diisocyanates are prompting manufacturers to adopt water-based and solvent-free chemistries.