
Market Overview
| Study Period | 2021 - 2031 |
|---|---|
| Market Volume (2026) | 0.54 gigawatt |
| Market Volume (2031) | 4.13 gigawatt |
| Growth Rate (2026 - 2031) | 50.08 % |
| Fastest Growing Market | Asia Pacific |
| Largest Market | Europe |
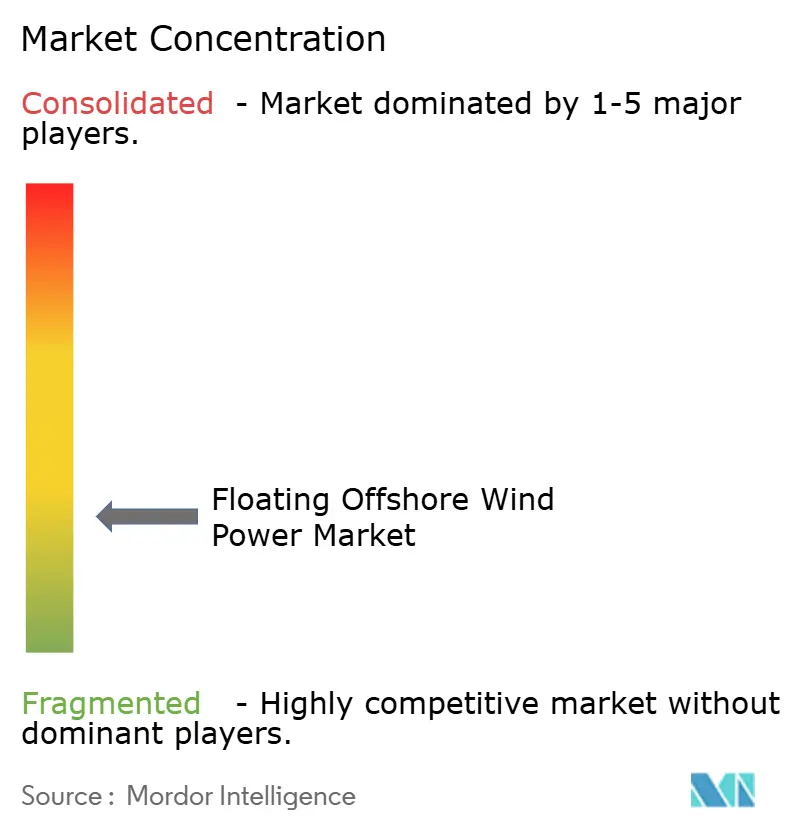
| Market Concentration | Low |
Major Players *Disclaimer: Major Players sorted in no particular order Image © Mordor Intelligence. Reuse requires attribution under CC BY 4.0. | |
Floating Offshore Wind Power Market Analysis by Mordor Intelligence
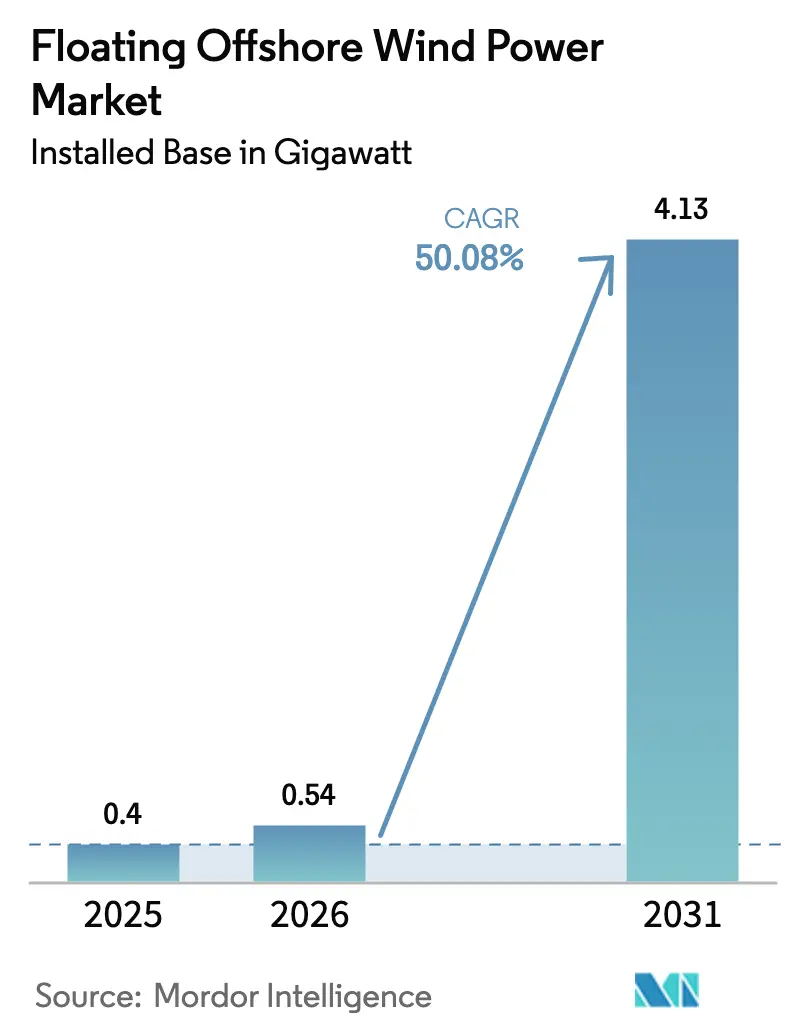
The Floating Offshore Wind Power Market size in terms of installed base is projected to expand from 0.4 gigawatt in 2025 and 0.54 gigawatt in 2026 to 4.13 gigawatt by 2031, registering a CAGR of 50.08% between 2026 to 2031.
This growth comes from the transition into deep-water zones that hold roughly 80% of global offshore wind potential and from continuous turbine upsizing that lowers the levelized cost of energy. Transitional depths of 30-60 m still dominate installations, yet ultra-deep sites beyond 60 m are accelerating as regulators unlock leases off California, Japan, and South Korea. Semi-submersible platforms maintain the lead because they suit modular fabrication, while Spar-buoy concepts advance quickly as Asian yards perfect steel-intensive hulls for typhoon conditions. Reforms to contracts for difference (CfDs) in the United Kingdom and France increase bankability, and national hydrogen roadmaps enhance revenue certainty by pairing electricity sales with green-hydrogen offtake. At the same time, shortages of installation vessels and dynamic-cable reliability issues pressure near-term schedules and margins.
Key Report Takeaways
- By water depth, Transitional depths captured 54.1% share in 2025; Deep-water zones above 60 m are forecasted to have a 58.2% CAGR through 2031.
- By platform type, semi-submersibles held 55.8% of the Floating Offshore Wind Power market share in 2025, while Spar-buoy designs are pacing at a 55.3% CAGR to 2031.
- By turbine class, 5-10 MW machines accounted for 52.9% of the Floating Offshore Wind Power market in 2025; units above 15 MW are advancing at a 56.1% CAGR through 2031.
- By the application stage, pre-commercial pilots dominated 65.3% of capacity in 2025, whereas commercial utility-scale arrays are poised for a 61.5% CAGR to 2031.
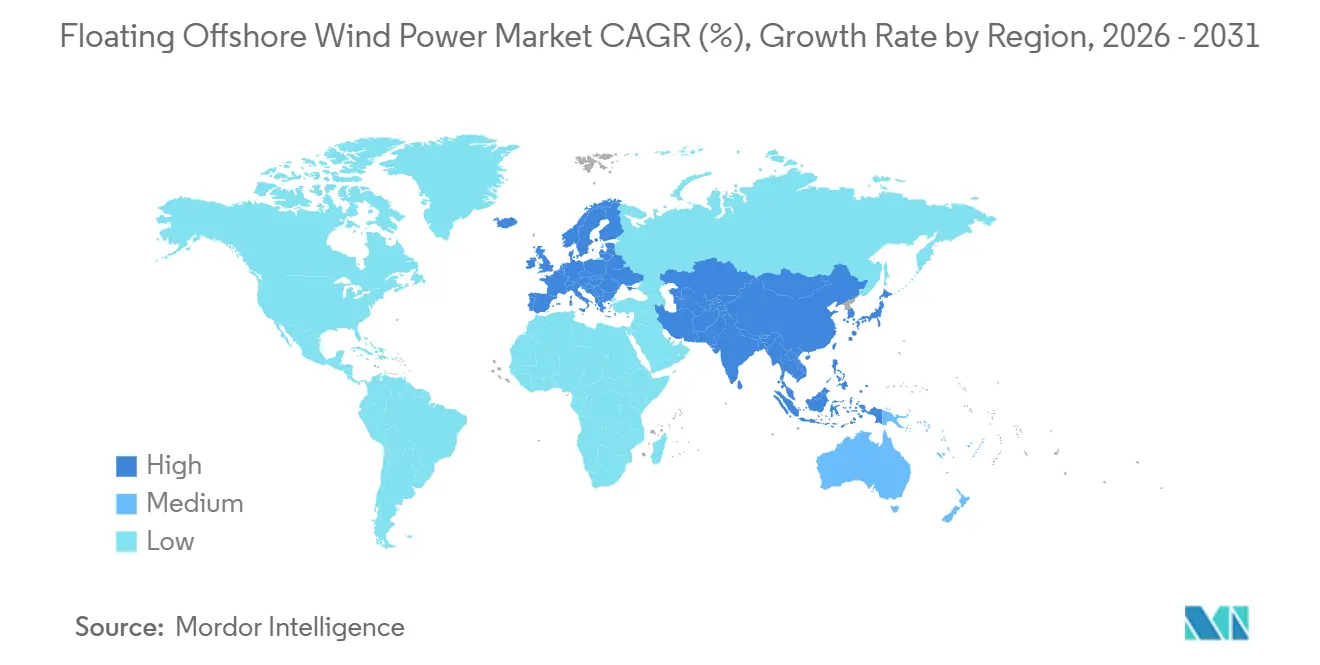
- By geography, Europe retained 53.6% capacity in 2025; Asia-Pacific is the fastest region, tracking a 53.3% CAGR toward 2031.
Note: Market size and forecast figures in this report are generated using Mordor Intelligence’s proprietary estimation framework, updated with the latest available data and insights as of January 2026.
Market Trends and Insights
Drivers Impact Analysis of Floating Offshore Wind Power Market*
| Driver | (~) % Impact on CAGR Forecast | Geographic Relevance | Impact Timeline |
|---|---|---|---|
| Growing Lease Awards in U.S. & APAC Deep-Water Zones | 8.5% | North America (California, Oregon, Gulf of Mexico), Asia-Pacific (Japan, South Korea, Taiwan, China) | Medium term (2-4 years) |
| Rapid Turbine Upsizing to 15-20 MW Class Reducing LCOE | 9.2% | Global, with early adoption in Europe (UK, Norway) and Asia-Pacific (China, Japan) | Short term (≤ 2 years) |
| Oil & Gas Platform Conversions Unlocking Gulf of Mexico Supply Chain | 6.8% | North America (Gulf of Mexico), with spillover to Brazil and West Africa | Medium term (2-4 years) |
| EU & UK CfD Reform Boosting Bankability | 7.5% | Europe (UK, France, Spain, Italy, Nordic countries) | Short term (≤ 2 years) |
| National Hydrogen Roadmaps Creating Co-location Demand | 5.3% | Europe (Germany, Netherlands, Norway), Asia-Pacific (Japan, South Korea, Australia) | Long term (≥ 4 years) |
| Asian Cable-Vessel Build-out Shortening Installation Schedules | 4.9% | Asia-Pacific core (China, Japan, South Korea), with spillover to Southeast Asia | Medium term (2-4 years) |
| Source: Mordor Intelligence | |||


Growing Lease Awards in U.S. & APAC Deep-Water Zones
The Bureau of Ocean Energy Management’s award of 4.6 GW of leases off California and Oregon in 2024 moved investment toward mooring systems able to withstand 1,200 m depths and seismic loads. Japan’s Ministry of Economy, Trade and Industry followed with 1.8 GW of Round 2 zones that impose typhoon-resilient design and 40% local-content rules.[1]Ministry of Economy Trade and Industry, “Round 2 Offshore Wind Bid Results,” meti.go.jp South Korea’s 8th power-supply plan sets a 6 GW floating target for 2030, steering capital to Ulsan and Jeju, where 150-m depths preclude monopiles. Taiwan’s 2026 allocation earmarks 3 GW for floating projects, incentivizing tension-leg pilots. Lease awards de-risk permitting, yet California’s interconnection queue stretches to 2029 because of congestion around Moss Landing and Diablo Canyon substations.
Rapid Turbine Upsizing to 15-20 MW Class Reducing LCOE
Serial production of Siemens Gamesa’s 15 MW SG 14-236 DD and Vestas’ V236-15 MW turbines began in 2025, each cutting foundation costs for 1 GW projects by nearly half and slicing balance-of-plant expenses by USD 180 million. GE Vernova’s 14 MW Haliade-X variant optimized for low-wind regimes enlarges viable lease zones in New York State. MingYang and Goldwind achieved 16 MW prototypes, validating two-piece blades, rail transport, and extended service intervals. Capex per installed megawatt is tracking from USD 4.2 million in 2024 toward USD 3.1 million by 2028.
Oil & Gas Platform Conversions Unlocking Gulf of Mexico Supply Chain
Shell’s Vito decommissioning plan repurposes a tension-leg structure for 200 MW of floating turbines 150 km south of Louisiana, leveraging existing export cables and crew quarters to trim greenfield costs by 35%. TotalEnergies and Aker Solutions are assessing 12 semi-submersible rigs for wind retrofits, activating dormant fabrication yards in Brownsville and Corpus Christi. The U.S. Department of Energy allocated USD 50 million to demonstrate mooring interoperability, aiming to charter idle pipelay barges and ease vessel constraints.
EU & UK CfD Reform Boosting Bankability
Allocation Round 6 in the United Kingdom introduced inflation-indexed strike prices of GBP 176/MWh, which lower debt-service coverage ratios and court pension funds. France’s CRE awarded 15-year CfDs at EUR 120/MWh for the Golfe du Lion array, offering local-content bonuses. Spain extended contract tenors to 25 years, balancing lower tariffs with longer cash flows. Italy adopted a two-way tariff that shields developers when merchant prices drop, while Equinor secured a 25-year corporate offtake for Hywind Tampen with Norsk Hydro.
Restraints Impact Analysis of Floating Offshore Wind Power Market*
| Restraint | (~) % Impact on CAGR Forecast | Geographic Relevance | Impact Timeline |
|---|---|---|---|
| WTIV & FIV Vessel Shortage Driving Day-rates > USD 450k | -3.8% | Global, acute in Asia-Pacific and North America | Short term (≤ 2 years) |
| High-Voltage Dynamic Cable Failures in 50-100 m Depth Pilots | -2.9% | Europe (North Sea, Celtic Sea), Asia-Pacific (Japan, Taiwan) | Medium term (2-4 years) |
| California ESA Right-Whale Constraints Slowing BOEM Permits | -1.6% | North America (California, Oregon) | Medium term (2-4 years) |
| Spot Steel Price Volatility (> USD 950/t) Disrupting Floater Yards | -3.2% | Global, with acute impact in Asia-Pacific and Europe | Short term (≤ 2 years) |
| Source: Mordor Intelligence | |||
WTIV & FIV Vessel Shortage Driving Day Rates Above USD 450k
Only 23 wind-turbine installation vessels (WTIVs) can handle 15 MW machines in 2025, yet 47 GW of projects need lifting through 2028. As utilization exceeds 95%, charter prices rose to USD 485,000 per day, postponing California’s Morro Bay array by two years and inflating a 500 MW project’s vessel bill to USD 87 million.[2]Bureau of Ocean Energy Management, “California Offshore Wind Leases: ESA Review,” boem.gov Shipyards are building 14 new WTIVs for 2026-27 delivery, but supply relief before 2027 remains limited.
High-Voltage Dynamic Cable Failures in 50-100 m Depth Pilots
Scotland’s Kincardine farm suffered a six-month outage in 2024 after bending-radius violations damaged 66 kV cables during 12-m wave events. Revised IEC 61400-3-2 standards now mandate tighter fatigue margins, and insurers require redundancy plus strain monitoring. Prysmian’s helically armored cable, released in 2025, meets those criteria but costs EUR 2.8 million per km, adding USD 90 million to a 1 GW project.
*Our forecasts treat driver/restraint impacts as directional, not additive. The impact forecasts reflect baseline growth, mix effects, and variable interactions.
Floating Offshore Wind Power Market Segment Analysis
By Water Depth:
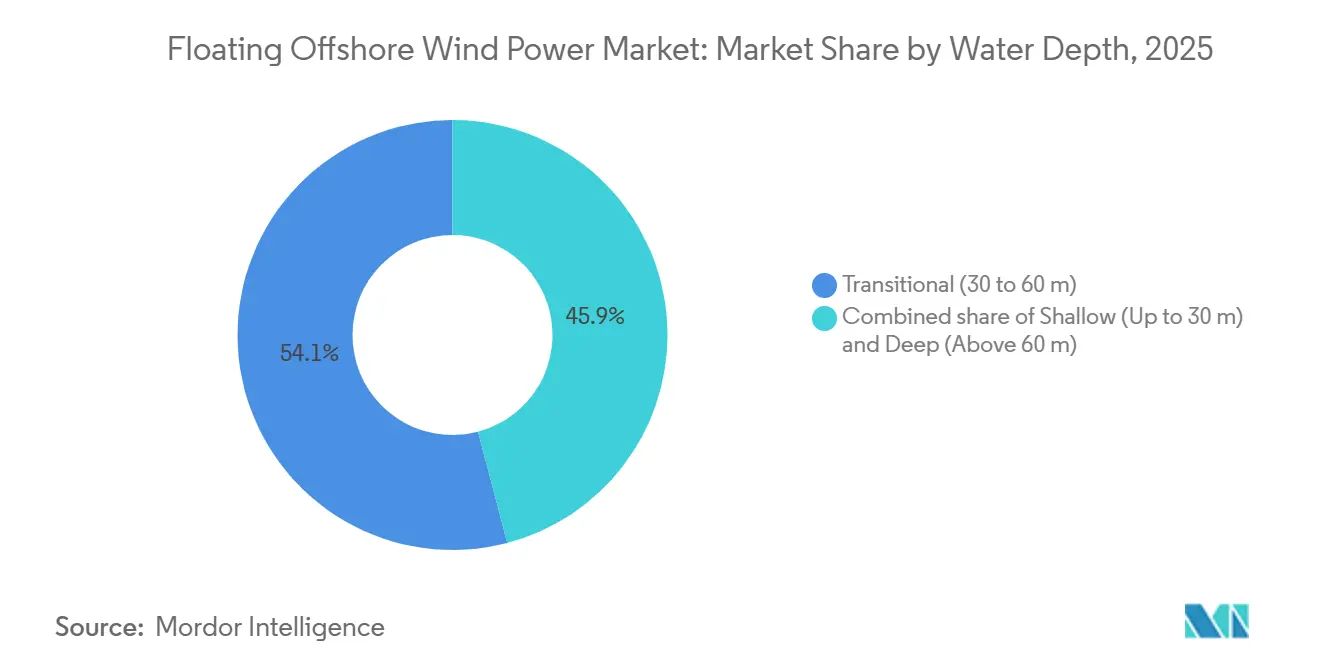
Deep Zones Redefine Lease EconomicsTransitional depths of 30-60 m represented 54.1% of global installations in 2025, largely around the North Sea, where hybrid gravity anchors lower mooring costs. Deep-water sites beyond 60 m are on pace for a 58.2% CAGR, unlocking the vast technical potential off California, Japan, and Norway. The Floating Offshore Wind Power market size for the Deep segment is projected to reach 2,900 MW by 2031. California’s Morro Bay area highlights the economics: suction anchors rated for 1,000-m depths lift capital expense to USD 4.1 million per MW, yet access to 25 GW of wind resource offsets that premium. Japan’s Goto leases and South Korea’s Ulsan sites confirm similar depth-driven economics.
Shallow settings under 30 m captured only demonstration activity. Several European pilots used benign waters to test platform behavior before scaling to harsher seas. Meanwhile, Deep-water adoption relies on mooring innovation such as Vryhof’s STEVMANTA suction anchor, which reduces anchor count from four to three and slashes installation time by 25%.


By Floating Platform Type:
Semi-Submersibles Dominate, Spar-Buoys RiseSemi-submersibles contributed 55.8% of 2025 capacity, thanks to modular fabrication and compatibility with 15-20 MW turbines. Principle Power’s WindFloat platform can be towed out from quays with only a 4 m draft and then ballasted in place.[3]Principle Power, “WindFloat Atlantic Performance Update 2025,” principlepower.com Spar-buoys show the fastest ascent with a 55.3% CAGR as Asian yards employ high-volume steel roll-forming and demonstrate remarkable pitch stability in typhoon seas. The Floating Offshore Wind Power market share of Spar-buoys is therefore set to expand sharply through 2031.
Tension-leg platforms hold a niche 12% share, appearing where firm seabed clay enables vertical tethers that minimize heave. Hybrid barge ideas like BW Ideol’s Damping Pool or Hexicon’s TwinWind duet aim to trim anchor costs by sharing moorings but remain at pilot scale.
By Turbine Capacity:
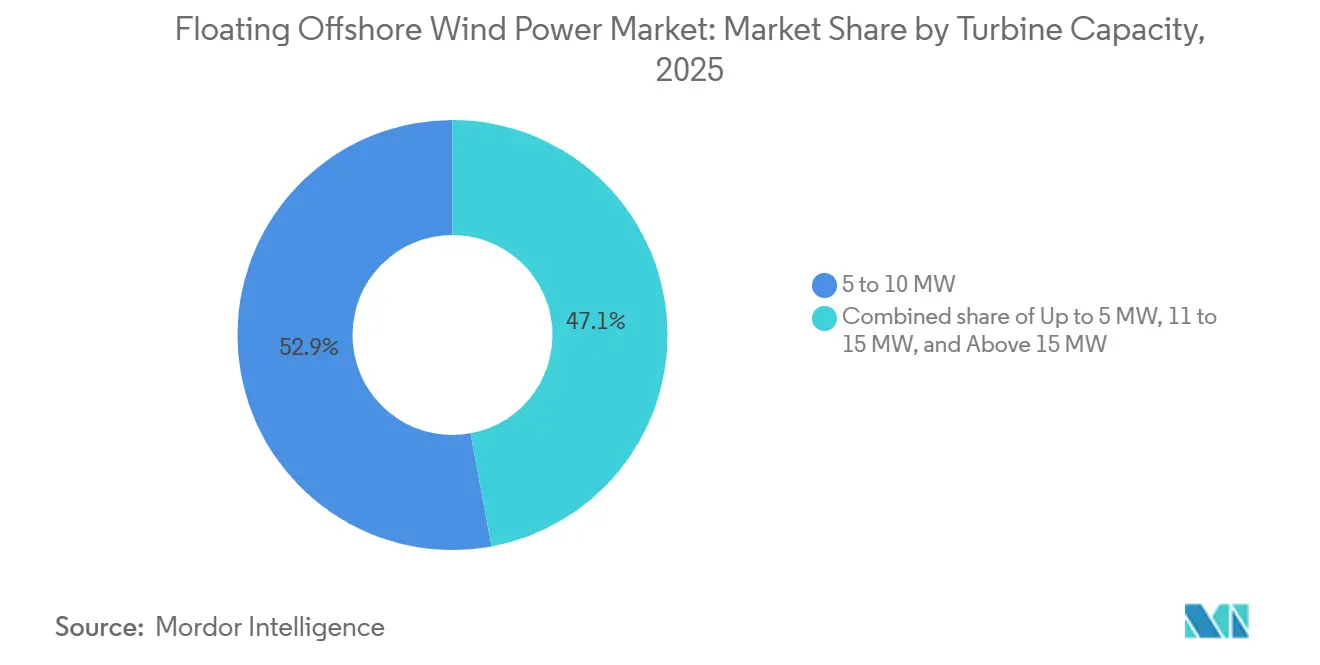
Gigawatt-Class Machines Reshape EconomicsTurbines rated 5-10 MW still formed 52.9% of 2025 deployments, yet serial production of 15-16 MW units is tilting the economics decisively. The Floating Offshore Wind Power market size for machines above 15 MW is expected to expand at a 56.1% CAGR, aided by Siemens Gamesa’s SG 14-236 DD and Vestas’ V236-15.0 MW products. A 1 GW farm now needs 63 turbines instead of 125, cutting cable runs by 40%. Goldwind’s direct-drive 16 MW rotor reduces gearbox maintenance and extends service intervals to 18 months.
Smaller turbines remain configured for older pilots and typhoon-constrained regions. Doosan’s 8 MW platform continues to serve South Korean demos, yet its announced 12 MW variant shows the convergence toward global sizing norms.
By Application Stage:
Pilots Yield to Utility-Scale ArraysPilots occupied 65.3% of installed capacity in 2025, virtually all funded by demonstration grants or transitional tariffs. Utility-scale arrays now line up financing as CfD reforms lower the weighted average cost of capital to 6.2% and insurers offer premiums of 1.8% of the installed cost. The Floating Offshore Wind Power market size for utility-scale projects is projected to overtake pilot capacity in 2028.
Hybrid wind-to-hydrogen projects already account for 8% of deployments. Germany’s AquaVentus and Japan’s Fukushima Forward pilots confirm that pairing wind with electrolyzers boosts equity returns by 150 bps, although electrolyzer capex of USD 800/kW still weighs on scalability.
Geography Analysis
Europe Floating Offshore Wind Power Market
Europe maintained 53.6% of installations in 2025, supported by the United Kingdom’s ScotWind leases, France’s Golfe du Lion tender, and Norway’s oil-platform decarbonization schemes. The Floating Offshore Wind Power market size in Europe is expected to pass 2,000 MW by 2031. United Kingdom policy mandates 25% local content, prompting port upgrades at Aberdeen and Inverness and sustaining semi-submersible fabrication.[4]Crown Estate Scotland, “ScotWind Leasing Round Outcomes,” crownestatescotland.com France’s 15-year CfDs at EUR 120/MWh and Mediterranean barge deployments provide predictable revenue and regional yard work. Spain, Italy, and Nordic nations follow with smaller yet fast-moving allocations that embed aquaculture or desalination co-use.
APAC Floating Offshore Wind Power Market
Asia-Pacific shows the strongest growth trajectory with a 53.3% CAGR. China’s Guangdong and Fujian provinces target 5 GW under the 14th Five-Year Plan, deploying MingYang and Goldwind 16 MW turbines. Japan’s 1.8 GW Round 2 leases include mandatory green-ammonia synthesis, while South Korea’s Ulsan Hydrogen City connects 500 MW of wind to 200 MW of PEM electrolyzers. Taiwan’s 2026 round reserves 3 GW for floating projects with 60% local content to develop domestic cable and mooring suppliers.
The Americas and MEA Floating Offshore Wind Power Market
North America secured 4.6 GW of leases off California and Oregon, but ESA consultations for the North Pacific right whale extend permitting by 18 months. Developers now fund passive-acoustic monitoring and seasonal work restrictions, pushing the first power to 2030. Meanwhile, Gulf of Mexico platform conversions tap idle rigs and established subsea infrastructure to curb capex by 35%. South America and the Middle East & Africa remain nascent. Petrobras studies a 150 MW conversion off Rio de Janeiro, and the United Arab Emirates assesses 200 MW near Abu Dhabi for green-hydrogen export.

Regulatory Landscape
Regulatory support for floating offshore wind is increasingly reflected through consenting reforms, auction-rule updates, and environmental safeguards that affect bankability and schedules. In the United States, the Department of the Interior updated federal renewable-energy regulations in May 2024 (via BOEM), including changes such as eliminating certain meteorological buoy requirements and establishing a public Renewable Energy Leasing Schedule. Project approvals continue to run through the National Environmental Policy Act (NEPA) pathway, including Environmental Impact Statements and Records of Decision.
In the United Kingdom, Contracts for Difference policy has incorporated non-price requirements through the Contracts for Difference (Sustainable Industry Rewards) Regulations 2024, which replaced Supply Chain Plans with Sustainable Industry Rewards for Allocation Rounds 7-9. In 2026, the UK tightened the environmental-consenting framework for offshore wind through the Conservation of Habitats and Species (Offshore Wind) (Amendment etc.) Regulations 2026, which came into force on May 21, 2026, providing a clearer basis for compensatory measures when adverse effects are identified. Separately, the Outer Dowsing Offshore Wind Farm Order 2026 took effect in March 2026, reflecting the continued use of development-consent instruments to progress major projects. Outside Europe and the United States, new frameworks are also forming in emerging Atlantic provinces, with Nova Scotia granting Royal Assent to the Powering the Offshore Act (Bill 149) in October 2025 to establish an offshore renewable energy legislative structure.
Value Chain Analysis
The floating offshore wind value chain runs from site identification and leasing to project development and consenting, followed by engineering and procurement of turbines, floaters, moorings, anchors, dynamic cables, and substations. It also covers fabrication and assembly, often distributed across multiple yards and ports, then tow-out and offshore hook-up, commissioning, and long-term O&M supported by specialized marine logistics. Industrial activity is increasingly centered on modular sub-block fabrication and quayside integration to handle large floaters and 15 MW-class turbines, with ports acting as a key throughput constraint because channel depth, laydown area, and quay bearing capacity shape feasible assembly strategies.
Bottlenecks concentrate in installation and marine logistics. The market faces a shortage of heavy-lift and offshore construction vessels capable of handling 14-15 MW+ equipment and specialized floating-wind tasks, while port development lead times of 4-10 years can create timing mismatch with commercial-scale buildouts. Recent industry moves also show value-chain formation extending into new geographies, with more operational experience: Kansai Electric Power Co., Inc. announced commercial operation of the Goto floating wind farm in January 2026 (Japan's first commercial floating offshore wind farm, 16.8 MW), and Simply Blue Group and Archirodon launched the ArcoBlue joint venture in April 2026 to develop floating offshore wind in Greece. These steps signal more frequent use of developer-EPC partnerships to access permitting, marine construction, and local supplier networks.
Competitive Landscape
The sector shows moderate concentration. The five largest turbine makers, Siemens Gamesa, Vestas, GE Vernova, MingYang, and Goldwind, deliver 68% of nacelle supply, while platform intellectual-property holders Principle Power, BW Ideol, Aker Solutions, and Hexicon license designs that regional yards fabricate. Developers with oil-and-gas pedigrees such as Equinor, TotalEnergies, Shell, and Ørsted exploit subsea-engineering know-how to defend margins. Emerging Chinese players compress costs through vertical integration, exerting pricing pressure on European OEMs.
Technology competition centers on moorings and dynamic cables. Vryhof’s STEVMANTA suction anchor reduces anchor count, trimming a 1 GW farm’s balance-of-plant cost by USD 40 million. Prysmian’s 66 kV helically armored cable mitigates fatigue but raises capex. Strategic deals in 2025 include Equinor and RWE’s USD 9.2 billion commitment for 3 GW at Morro Bay and Ocean Winds’ USD 4.5 billion partnership with Copenhagen Infrastructure Partners for 2.5 GW in Scotland, each leveraging indexed tariffs and EIB debt to close financing.
Patent filings under WIPO IPC F03D13/25 rose 42% in 2024, led by Equinor’s shared-mooring patterns and Hexicon’s dual-turbine barge, suggesting intensifying intellectual-property rivalry. Supply-chain scarcities persist, particularly WTIV availability and heavy-lift cranes, but 14 units now under construction in Korean and Chinese yards should come online between 2026-2027 to alleviate bottlenecks.
Floating Offshore Wind Power Industry Leaders
General Electric Company
Vestas Wind Systems A/S
Siemens Gamesa Renewable Energy, S.A
BW Ideol AS
Equinor ASA
- *Disclaimer: Major Players sorted in no particular order
Floating Offshore Wind Power Market Companies Covered in this Report
- Siemens Gamesa Renewable Energy SA
- Vestas Wind Systems A/S
- GE Vernova (GE Renewable Energy)
- BW Ideol AS
- Equinor ASA
- Ørsted A/S
- Principle Power Inc.
- Aker Solutions ASA
- Hexicon AB
- TotalEnergies SE
- Shell plc
- Ocean Winds (EDPR/ENGIE)
- Copenhagen Infrastructure Partners
- RWE AG
- Marubeni Corporation
- Doosan Enerbility Co., Ltd
- MingYang Smart Energy
- Goldwind Science & Technology
- Cobra IS (Grupo ACS)
- Gazelle Wind Power Ltd.

Market Opportunities and Future Outlook
In 2026, commercial proof points are broadening the addressable opportunity set beyond pilots, particularly where governments combine auctions or tenders with clearer consenting and grid-planning frameworks. Japan added an operational reference with the 16.8 MW Goto project entering commercial operation in January 2026. France also advanced its operational ramp-up, with Ocean Winds starting electricity production at the 30 MW EFGL floating project in May 2026 and reaching full power in July 2026. These milestones strengthen the case for repeatable EPC and O&M packages, including dynamic cables, moorings, tow-out logistics, and marine operations, and support more standardized contracting and insurance approaches for arrays moving into 50-100 m depths where fatigue and reliability remain central.
A second opportunity track is policy and infrastructure alignment built around shared sea-basin planning and explicit zoning for deeper waters. In January 2026, the North Sea Summit launched a Joint Offshore Wind Investment Pact focused on coordinated frameworks and grid infrastructure. The Netherlands also published a Development Framework in January 2026 that includes floating wind zones, while simultaneously launching a 1 GW offshore wind subsidy tender after budget reallocation. On the technology and cost-reduction pathway, the National Offshore Wind Research & Development Consortium (NOWRDC) released Roadmap 5.0 in February 2026, prioritizing installation innovation and LCOE reduction. This creates whitespace for suppliers that can de-risk installation sequences, improve dynamic-cable monitoring and fatigue performance, and expand port-side industrialization for large floating substructures.
Recent Industry Developments in Floating Offshore Wind Power Market
- July 2026: Ocean Winds reached full power at the 30 MW Éoliennes Flottantes du Golfe du Lion (EFGL) floating offshore wind project in France. Moving from initial generation to full output strengthens bankability for follow-on floating projects by demonstrating commissioning, operations, and grid-integration performance at commercial pilot scale.
- November 2025: The Crown Estate selected Ocean Winds for the direct award of a third floating offshore wind site in the Celtic Sea with a capacity of 1,500 MW. The award expands Ocean Winds pipeline and reinforces the Celtic Sea as a focal basin for supply-chain investments such as port upgrades, floater assembly capacity, and mooring and cable readiness.
- December 2024: Ocean Winds and Banque des Territoires were awarded the 250 MW Eoliennes Flottantes d'Occitanie project in the French Mediterranean Sea under the AO6 tender. The win added another utility-scale development track in a market using contract-backed procurement, supporting earlier supplier commitments in floaters, dynamic cables, and marine installation planning.


Floating Offshore Wind Power Market Report Scope and Research Methodology
Market Definition and Coverage
This market is defined as floating offshore wind power projects where wind turbines are mounted on floating platforms and connected to the grid, with market size tracked mainly using commissioned or installed capacity in MW or GW.
Scope exclusions: fixed bottom offshore wind, nearshore installations, and non grid connected demonstration units are excluded from the sizing.
Segments Covered in This Report
- By Water Depth
- Shallow (Up to 30 m)
- Transitional (30 to 60 m)
- Deep (Above 60 m)
- By Floating Platform Type
- Semi-Submersible
- Spar-Buoy
- Tension-Leg Platform (TLP)
- Barge & Hybrid Concepts
- By Turbine Capacity
- Up to 5 MW
- 5 to 10 MW
- 11 to 15 MW
- Above 15 MW
- By Application Stage
- Pre-Commercial Pilot
- Commercial Utility-Scale
- Hybrid Wind-to-X (Hydrogen, Desalination)
- By Geography
- North America
- United States
- Rest of North America
- Europe
- France
- United Kingdom
- Spain
- Nordic Countries
- Italy
- Rest of Europe
- Asia-Pacific
- China
- Japan
- South Korea
- Rest of Asia-Pacific
- South America
- Brazil
- Argentina
- Rest of South America
- Middle East and Africa
- United Arab Emirates
- Saudi Arabia
- South Africa
- Rest of Middle East and Africa
- North America
Data Sources, Market Sizing, and Validation
Desk Research
Desk work was used to set the fact base for the floating offshore wind pipeline, and to keep the model tied to real world energy and permitting signals. We typically refer to public sources such as the International Energy Agency (IEA), IRENA, the Global Wind Energy Council (GWEC), and national energy regulators and grid operators that publish capacity and connection updates. For Europe and the United States, planning and lease data from offshore energy agencies, as well as permitting trackers and port authority announcements, help confirm what can move from pre-FID to construction.
We also review company annual reports, investor presentations, press releases, and developer project pages to verify commissioning timelines, targeted turbine ratings, and platform selections when those details are disclosed. Patent databases are selectively checked to understand platform and mooring concepts that may influence costs and pace of adoption, and an import-export shipment level database can be used to sense large component flows where it is relevant. The sources listed here are illustrative only, and many other public documents were also used for data collection, validation, and clarification during analysis.
Primary Interviews and Surveys
Primary work was done through expert interviews and structured surveys with developers, EPC and marine contractors, turbine and platform ecosystem participants, and consultants who track offshore wind permitting and grid connections. Because this is a global market, we ensured the respondent views covered major demand centers and early adopter regions, and then used those inputs to close gaps on project timing, achievable capacity factors, and cost assumptions that are not consistently visible in public sources.
Distribution of primary research fieldwork respondents
| Company type | Respondent position | Region |
|---|---|---|
| Top tier: 31% | CXOs: 15% | APAC: 45% |
| Mid tier: 54% | Functional/Unit leaders: 25% | EMEA: 35% |
| Smaller Players: 15% | Managers: 60% | Americas: 20% |
Market-Sizing & Forecasting
Sizing starts from a top-down build where official capacity series, grid connection plans, and the project pipeline by stage are used to reconstruct how much floating capacity can realistically be commissioned in each year. Once those volumes are set, they are stress tested using selective bottom-up checks such as sampled project level capacity roll ups, typical turbine rating times expected unit counts, and channel checks on platform fabrication and installation readiness.
Key inputs used in the model include water depth thresholds that push projects toward floating solutions, lease and permitting milestones, planned commissioning dates, turbine ratings in MW, expected capacity factors, and the pace of port and vessel readiness that can limit yearly installations. Where public data is missing for individual projects, assumptions are filled using comparable project analogs in the same basin and then re-checked in follow-up calls, so gaps do not compound across years.
Forecasting is done using scenario analysis supported by expert views, where base, conservative, and accelerated cases are created around permitting speed, grid buildout, and cost reduction expectations. The final forecast is then brought back to the base case after the drivers are reconciled with what the supply chain can deliver and what developers indicate as executable timelines.
Data Validation & Update Cycle
Outputs are validated through multiple checks that look for mismatches between modeled commissioning and independent signals such as announced grid connection capacity, leasing rounds, and published national targets. Large variances are flagged, reviewed by a second analyst, and then followed by re-contact with relevant interviewees when a timing or scope assumption seems to be driving the gap.
The report is refreshed on an annual cycle, and interim updates are done when there are material events such as major auction outcomes, project cancellations, or step changes in installation capability. Before delivery, a final pass is completed so the published tables and assumptions reflect the latest public releases and any confirmed primary feedback.
Mordor Intelligence's Floating Offshore Wind Power Market Size Compared Against Other Published Estimates
Different publications can show very different market sizes because they do not always measure the same thing, even when the market name looks identical. Common reasons include whether the number is stated in capacity or in revenue, which project stages are counted, and how quickly costs or prices are assumed to change over the forecast.
Fixed bottom offshore wind sits outside Mordor Intelligence's scope for this study, and that exclusion often explains why some revenue based estimates look much larger even for the same year. Another driver is that some sources report an aggressive buildout case by counting announced projects without filtering for permitting maturity, grid connection realism, and port and vessel constraints, which can push near term values up.
Benchmark comparison
| Source | Market Size | Gaps in Research Methodology |
|---|---|---|
| Mordor Intelligence | USD 0.54 B (2026) | |
| Global Industry Publisher A | USD 0.37 B (2024) | Uses a revenue frame with a different base year and may weight early demonstration activity more heavily, which can understate capacity led comparisons when projects are not yet commissioned. |
| Industry Research Body B | USD 1.50 B (2024) | Counts a broader value chain and component scope with revenue attribution that can include more upstream and service pools, and the uplift depends strongly on ASP and cost curves assumed for early projects. |
The table shows that the spread mostly comes from unit choice and what parts of the value chain are counted, not from arithmetic errors. By keeping the model tied to commissioning reality and a clear project maturity filter, we end up with a size that is easier to reconcile with grid connection signals and near term build limits.


Key Questions Answered in the Report
What is the projected capacity for floating offshore wind by 2031?
Installed capacity is expected to reach 4,130.80 MW by 2031, driven by a 50.08% CAGR.
How do deep-water sites impact project economics?
Depths beyond 60 m unlock larger wind resources but add mooring costs, lifting capex toward USD 4.1 million/MW yet enabling higher capacity factors.
Which turbine rating now sets the benchmark for commercial arrays?
Serial-production 15-16 MW machines now dominate new contracts because they cut foundation counts and balance-of-plant costs.
Why are semi-submersible platforms still favored?
They allow modular yard fabrication, shallow-draft tow-out, and compatibility with turbines up to 20 MW, keeping installed costs competitive.
What policy reforms have improved bankability?
Inflation-indexed CfDs in the United Kingdom and 15-year fixed tariffs in France lower weighted average cost of capital to roughly 6.2%.
How does hydrogen co-location influence returns?
Pairing floating wind with offshore electrolyzers adds a second revenue stream that can lift equity returns by about 150 bps.
Page last updated on:


 Your data is secure and never sold or shared.


