
Flexible Foam Market Size and Share
Market Overview
| Study Period | 2020 - 2031 |
|---|---|
| Market Size (2026) | USD 55.65 Billion |
| Market Size (2031) | USD 76.71 Billion |
| Growth Rate (2026 - 2031) | 6.63 % |
| Fastest Growing Market | Asia-Pacific |
| Largest Market | Asia-Pacific |
| Market Concentration | Low |
Major Players *Disclaimer: Major Players sorted in no particular order Image © Mordor Intelligence. Reuse requires attribution under CC BY 4.0. | |
Flexible Foam Market Analysis by Mordor Intelligence
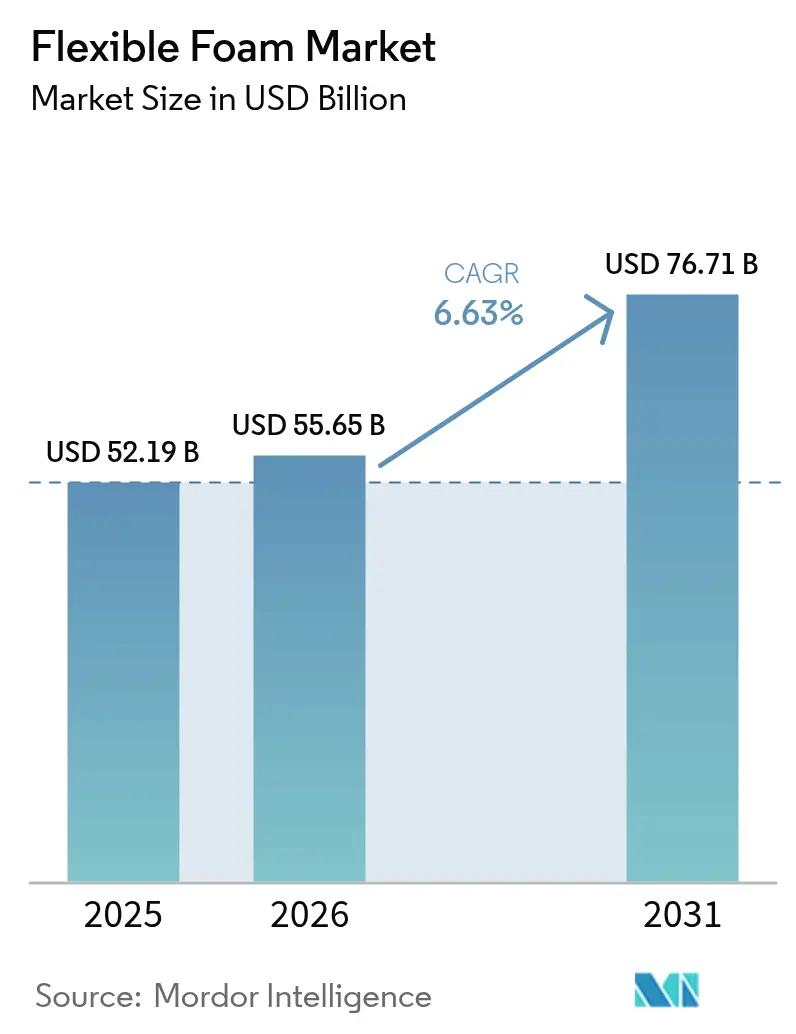
Flexible Foam market size in 2026 is estimated at USD 55.65 billion, growing from 2025 value of USD 52.19 billion with 2031 projections showing USD 76.71 billion, growing at 6.63% CAGR over 2026-2031.
Rising e-commerce packaging volumes, lightweighting imperatives in automotive seats, and a broad push toward sustainable chemistry underpin this expansion. Polyurethane maintains clear leadership thanks to its tunable density profiles, while carbon-capture polyol technologies and graphene-enhanced formulations illustrate ongoing performance gains. Asia-Pacific’s manufacturing depth and domestic consumption growth secure its position as the largest regional contributor. Meanwhile, strategic acquisitions signal a maturing competitive landscape that prizes vertical integration and omnichannel reach.
Key Report Takeaways
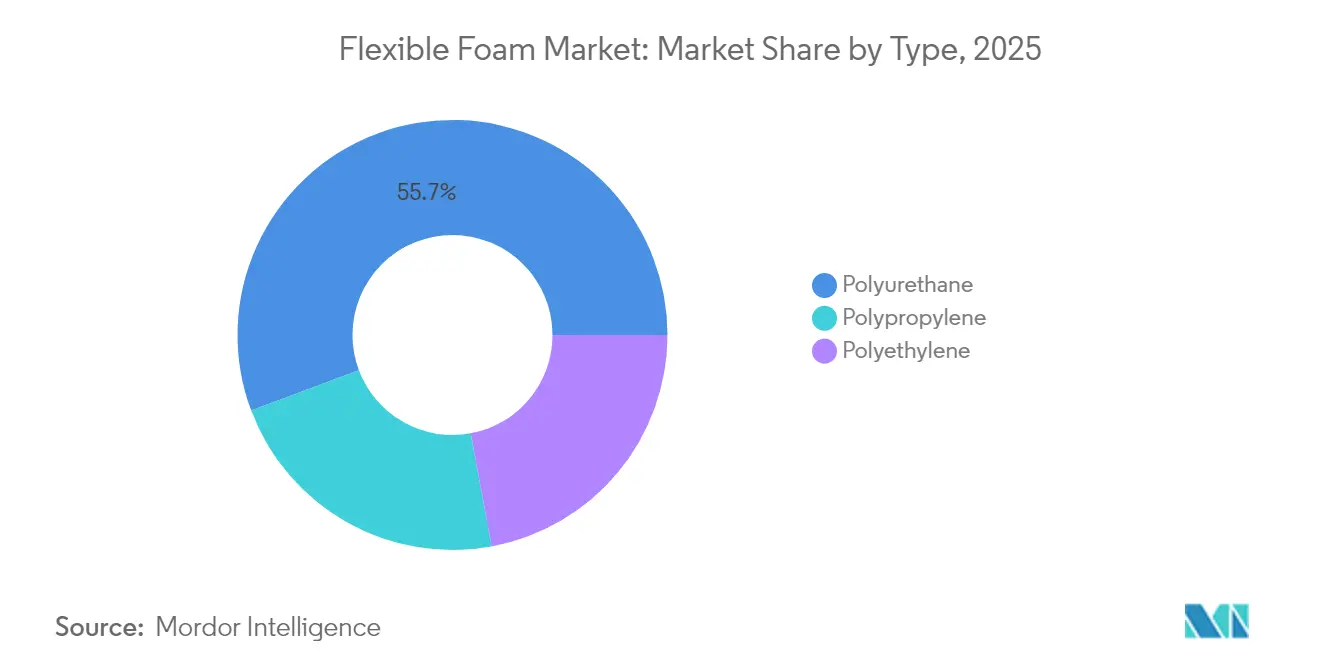
- By type, polyurethane foam led with 55.72% of flexible foam market share in 2025; the type is forecast to expand at a 7.34% CAGR through 2031.
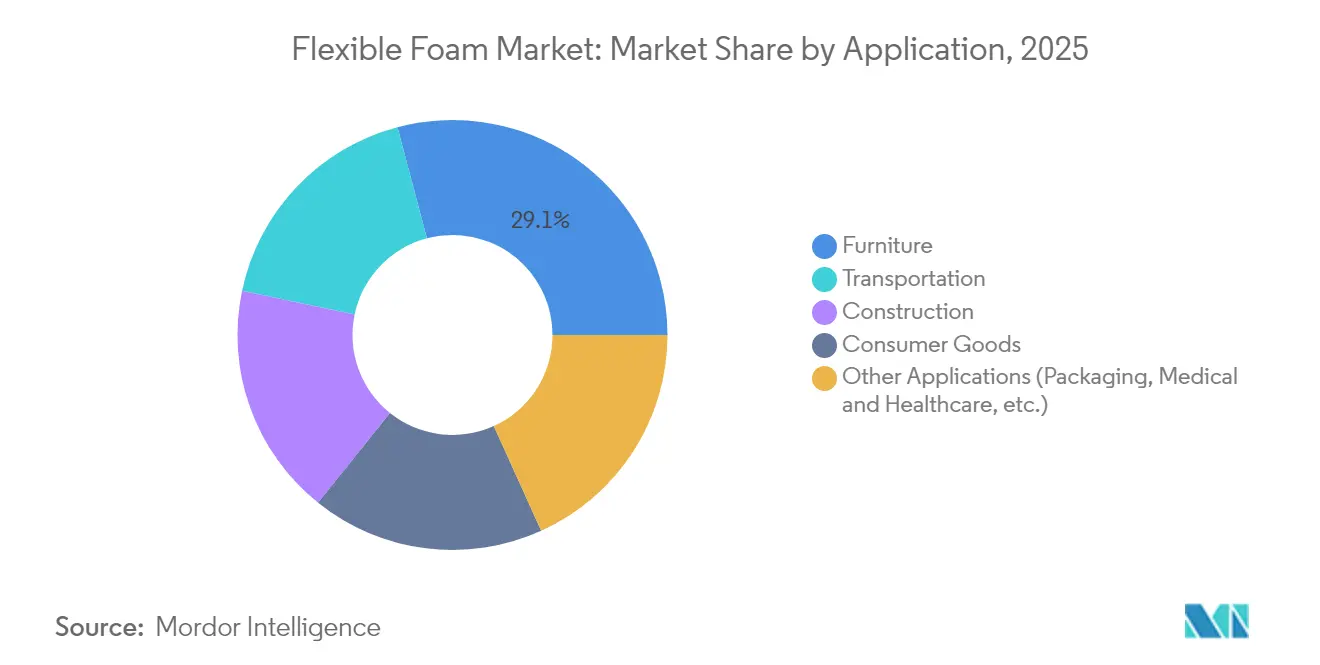
- By application, furniture accounted for a 29.12% share of the flexible foam market size in 2025, while other applications such as packaging, medical, and healthcare are advancing at an 7.62% CAGR through 2031.
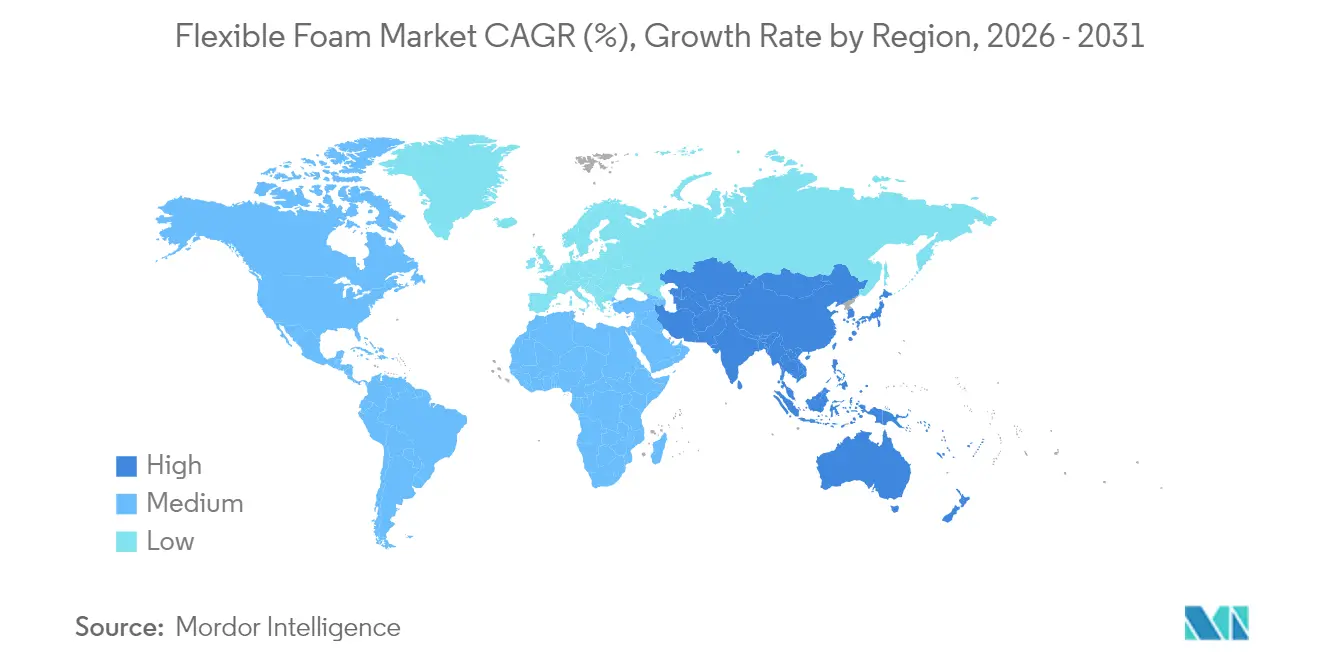
- By geography, Asia-Pacific captured 45.60% revenue share in 2025; the region is projected to register the fastest 7.35% CAGR to 2031.
Note: Market size and forecast figures in this report are generated using Mordor Intelligence’s proprietary estimation framework, updated with the latest available data and insights as of 2026.
Market Trends and Insights
Drivers Impact Analysis of Flexible Foam Market*
| Driver | (~) % Impact on CAGR Forecast | Geographic Relevance | Impact Timeline |
|---|---|---|---|
| Surging E-Commerce Packaging Demand | +1.8% | Global, with APAC and North America leading | Short term (≤ 2 years) |
| Furniture and Bedding Refresh Cycles in Mature Economies | +1.2% | North America and EU primarily | Medium term (2-4 years) |
| Lightweight Automotive Seating and NVH Requirements | +1.5% | Global, concentrated in automotive hubs | Medium term (2-4 years) |
| Adoption of CO₂-Based Polyols and Circular Foam Chemistries | +0.9% | EU and North America early adoption, global expansion | Long term (≥ 4 years) |
| Bed-In-A-Box Mattress Logistics Boom | +1.1% | North America and EU mature markets, APAC emerging | Short term (≤ 2 years) |
| Source: Mordor Intelligence | |||
Surging E-Commerce Packaging Demand
Protective packaging needs for fragile electronics and premium direct-to-consumer deliveries are driving polyurethane foam volumes. The global packaging foam segment is set to move from USD 12.22 billion in 2025 to USD 15.36 billion by 2034, a 4.68% CAGR, underscoring polyurethane’s shock-absorption advantage. Asia-Pacific leads this shift as device makers specify custom foam inserts for smartphones and tablets. Retailers differentiate through elevated unboxing experiences that rely on flexible foam solutions. Extended Producer Responsibility rules in Europe, however, push producers to design recyclable formats that may limit traditional formulations. Manufacturers with circular chemistries stand to win share as compliance deadlines near.
Furniture and Bedding Refresh Cycles in Mature Economies
Remote-work investments and wellness centricity are shortening furniture replacement timelines in developed markets. European furniture production rose 1.5% over the first four months of 2025 versus 2024, signaling continued recovery[1]. Consumers demand premium seating and bedding that blend ergonomics with low-VOC profiles. Foam manufacturers able to deliver breathability, antimicrobial additives, and precision zoning capture premium margins. Yet spending remains sensitive to mortgage rates and housing turnover, potentially tempering growth in periods of macro stress.
Lightweight Automotive Seating and NVH Requirements
Automakers target 50 miles-per-gallon fleet averages by 2025, spurring adoption of low-density polyurethane that trims seat weight by over 10% while meeting crash norms. Ford’s graphene-enhanced foam elevates compression strength 20% and boosts sound absorption 25% without mass penalties. Electric vehicle uptake amplifies the need for NVH damping formerly masked by engine noise. Covestro’s Bayfit SA platform extends to hoodliners and floor modules that pair acoustic gains with biocircular feedstocks. The segment nevertheless rides cyclical production swings and chip-related disruptions.
Adoption of CO₂-Based Polyols and Circular Foam Chemistries
Covestro’s cardyon® process upcycles captured CO₂ into polyol chains containing up to 20% carbon dioxide, cutting fossil inputs and energy intensity. Recticel’s KAPUA® replaces one-seventh of petroleum with CO₂-based intermediates while retaining OEKO-TEX® credentials. INOAC’s ECOLOCEL® reaches 50% plant content, proving bio-derived feedstocks can meet mattress resilience criteria. Early adopters gain regulatory headroom and brand advantage, though R&D costs and supply-chain recertification moderate near-term uptake.
Restraints Impact Analysis of Flexible Foam Market*
| Restraint | (~) % Impact on CAGR Forecast | Geographic Relevance | Impact Timeline |
|---|---|---|---|
| Volatile Isocyanate and Polyol Feedstock Prices | -1.4% | Global, with regional supply chain variations | Short term (≤ 2 years) |
| Stricter VOC / Flame-Retardant Regulations | -0.8% | EU and North America leading, global adoption | Medium term (2-4 years) |
| Transition to Halogen-Free FR Systems Raises Cost And Complexity | -0.6% | Global, with varying compliance timelines | Long term (≥ 4 years) |
| Source: Mordor Intelligence | |||
Volatile Isocyanate and Polyol Feedstock Prices
MDI and TDI swings compress margins when pass-through pricing lags. BASF lifted select diols by USD 0.08-0.10 lb in April 2025 amid crude volatility. Dow’s closure of an Argentina polyols site illustrates supply-demand imbalances that ripple through regional costs. U.S. consumption hit 434.9 million lb for pure MDI and 482.9 million lb for TDI in 2023, highlighting the market’s raw-material exposure. Contract structures that lock in index-based formulas help larger processors mitigate shocks but smaller converters remain vulnerable.
Stricter VOC / Flame-Retardant Regulations
New York bans intentional use of flame retardants in upholstered items from December 2024, prompting reformulation toward barrier fabrics and graphite-infused foams. EPA health assessments and California TB117-2013 push industry to low-smolder yet chemical-lean solutions. Europe’s REACH now requires special training for diisocyanate handling above 0.1% content, elevating compliance overhead. Producers investing early in halogen-free systems gain market access while others risk penalties and lost business.
*Our forecasts treat driver/restraint impacts as directional, not additive. The impact forecasts reflect baseline growth, mix effects, and variable interactions.
Flexible Foam Market Segment Analysis
By Type:
Polyurethane Dominance Drives InnovationPolyurethane held 55.72% of flexible foam market share in 2025 on the strength of its cost-to-performance balance. Polyester grades deliver durability for load-bearing mats while polyether variants retain hydrolytic stability in comfort seating. The segment is projected to post a 7.34% CAGR through 2031, cementing its role in the flexible foam market even as CO₂-based chemistries gain ground. Ford’s graphene-enhanced seat cushions demonstrate how nano-fillers can push compression strength up 20% while trimming weight 10%.
Polyethylene and polypropylene foams trail but carve niches in moisture-proof packaging and automotive headliners. Cross-linked polyethylene offers closed-cell moisture resistance, whereas non-cross-linked grades provide economical cushioning. Polypropylene’s recyclability and chemical inertia secure opportunities in under-hood thermal shields. Together, alternative resins broaden the flexible foam market by enabling applications unsuited to polyurethane’s thermoset nature.

By Application:
Furniture Leadership Faces Emerging CompetitionFurniture retained a 29.12% share of the flexible foam market size in 2025, benefiting from heightened home-office spending. Nonetheless, packaging, medical, and healthcare collectively display the fastest 7.62% CAGR to 2031 as brand owners seek tailored cushioning and infection-control solutions. Mattress manufacturers experiment with phase-change microcapsules and zoned firmness to capture premium tiers, while hospital beds require anti-microbial, low-VOC pads to comply with tightening indoor-air mandates.
Transportation and construction follow, fueled by electric-vehicle NVH mitigation and retro-fit insulation mandates. Consumer goods, from athletic footwear to personal-care applicators, rely on foam’s softness and rebound to differentiate. The shifting mix signals that future volume gains may outpace furniture, redefining where manufacturers allocate capacity and R&D funds within the flexible foam market.
Geography Analysis
APAC Flexible Foam Market
Asia-Pacific controlled 45.60% of 2025 revenue and is projected to expand at a 7.35% CAGR through 2031, underscoring its central role in the flexible foam market. China’s entrenched supply base partners with India’s USD 87 billion petrochemical build-out, while ASEAN nations benefit from “China + 1” diversification. Sekisui Chemical’s new INR 500 million Pune site signals ongoing localization for automotive seating foams.
North America Flexible Foam Market
North America maintains technological leadership despite cyclical dips in bedding and vehicle output. The U.S. leverages abundant natural gas feedstock, and Mexico now ranks as the fourth-largest polyurethane consumer thanks to near-shoring EV assembly. Regulations favor low-VOC and circular feedstocks, creating pull-through for CO₂-based polyols.
EMEA and South America Flexible Foam Market
Europe balances stringent environmental rules with innovation incentives. Dow’s strategic review of its European polyurethane chain shows profitability strains amid high energy costs. Yet the bloc leads in circular foam adoption, driven by the 2024 Packaging and Packaging Waste Regulation mandating recyclability. South America and Middle East and Africa add incremental demand as infrastructure programs specify energy-efficient insulation, though currency volatility tempers investment.
Regulatory Landscape
Flexible foam producers face tightening air-emissions and chemical-safety requirements across key regions, which raises the bar for EHS systems and documented compliance. In March 2026, the US Environmental Protection Agency finalized updates for the Polyether Polyols Production MACT, including tighter leak definitions for equipment in ethylene oxide service (100 ppmv) and revised storage-vessel criteria, which can affect upstream polyol supply economics and monitoring practices for integrated polyurethane value chains.
On product stewardship and workplace safety, EU REACH requirements for diisocyanate handling above 0.1% content continue to shape training and site procedures, while certification schemes influence downstream customer specifications. EUROPUR's CertiPUR technical requirements (2026 technical paper) reinforce limits on substances such as certain phthalates (DEHP, DBP, BBP, DIBP) and bans on azocolourants/azodyes in flexible polyurethane foam, pushing manufacturers to maintain compliant additive packages alongside low-VOC and halogen-free flame-retardant strategies.
Value Chain Analysis
The flexible foam value chain starts with petrochemical feedstocks (propylene, benzene) and moves into intermediates (propylene oxide, polyether polyols, MDI and TDI), then into foam formulation and conversion (slabstock, molding, lamination and fabrication), before reaching OEMs and converters serving furniture and bedding, transportation seating/NVH, construction and packaging. Upstream is structurally concentrated in isocyanates and major polyols, which increases the impact of outages, force majeure events and logistics disruptions on converters. Industry commentary in 2026 also pointed to propylene oxide tightness and broader logistics constraints as recurring operating risks.
Downstream, distribution is increasingly regionalized because bulky finished foam and cut parts tend to be sourced closer to mattress, furniture and automotive clusters. Large chemical players such as BASF can offset some volatility through integrated production footprints that connect polyols and isocyanates to stabilize supply and improve asset efficiency. Associations such as EUROPUR and the Polyurethane Foam Association have highlighted supply chain volatility and regulatory topics, including isocyanate rules, reflecting the need for longer-term supply agreements, inventory buffering and qualification of alternative formulations and additives to maintain continuity and market access.
Competitive Landscape
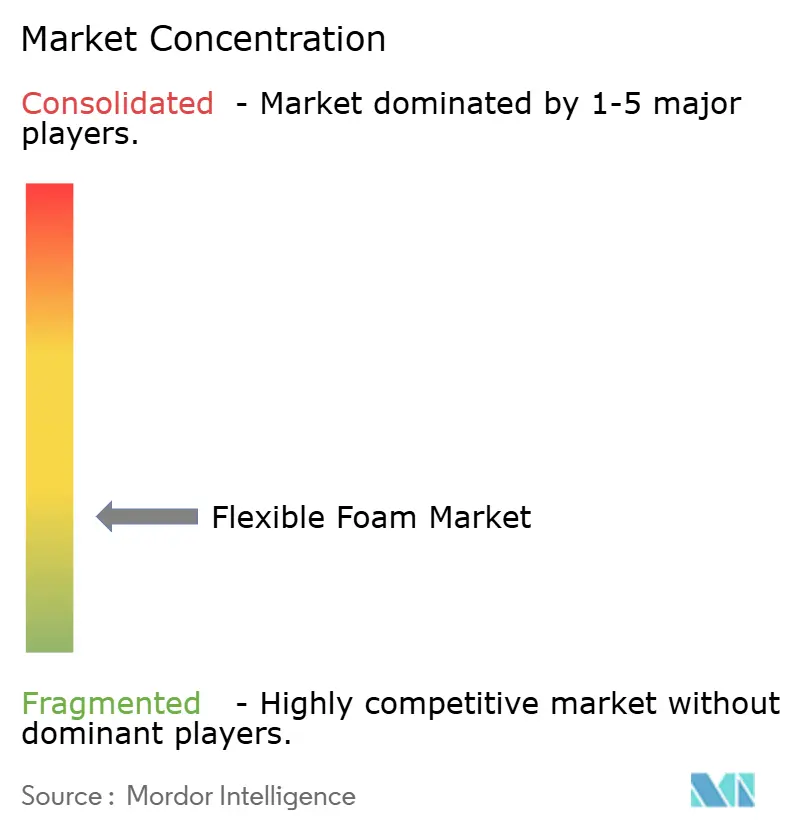
The flexible foam market remains highly fragmented but is moving toward strategic clustering. Tempur Sealy’s USD 5 billion Mattress Firm acquisition and Leggett & Platt’s USD 1.25 billion Elite Comfort Solutions deal highlight vertical integration aimed at controlling both branded bedding and specialty foam inputs[2]. Carpenter Co.’s EUR 656 million take-over of Recticel’s Engineered Foams business extends capacity in technical laminates, though UK regulators are scrutinizing competition impacts.
Global chemical majors—BASF, Covestro, Dow—command advantage through end-to-end supply chains and deep R&D pipelines. They focus on CO₂-based polyols, bio-attributed MDI, and digitalized production lines that cut scrap and CO₂. Regional converters differentiate on speed, service, and specialized formulations such as halogen-free acoustic foams. Product innovation around nanomaterial reinforcement and closed-loop recycling aims to defend margins in commodity segments. Compliance infrastructure has become a gating factor: smaller firms face hurdles meeting REACH diisocyanate rules, potentially accelerating consolidation in the flexible foam market.
Flexible Foam Industry Leaders
-
Carpenter Co
-
Covestro AG
-
Woodbridge
-
Greiner AG
-
SEKISUI CHEMICAL CO., LTD
- *Disclaimer: Major Players sorted in no particular order
Flexible Foam Market Companies Covered in this Report
- American Excelsior Company
- BASF
- Carpenter Co.
- Covestro AG
- Dow
- FXI
- Greiner AG
- Huntsman International LLC
- INOAC CORPORATION
- KANEKA CORPORATION
- ORSA foam SpA.
- Rogers Corporation
- SABIC
- SEKISUI CHEMICAL CO., LTD.
- Sheela Foam Ltd
- Vita Group
- Wm. T. Burnett Holding, LLC
- Woodbridge
Market Opportunities and Future Outlook
Opportunities are concentrating around circular polyurethane pathways and compliance-ready formulations that reduce regulatory and customer-specification friction in bedding, furniture and automotive applications. In 2026, the market is moving from pilots toward industrialization, including Evonik operating a pilot plant for polyurethane foam chemical recycling at Hanau, Germany (supported by the State of Hesse), and KPX Chemical with Chinyang Polyurethane finalizing plans for a flexible polyurethane recycling plant in Eumseong County, South Korea, using H&S Anlagentechnik technology. Together, these efforts connect end-of-life mattress foam and production scrap to higher-value recovery routes.
Capacity and localization initiatives also create whitespace for regional suppliers that can secure feedstocks and meet low-VOC and certification requirements. India-specific investments in 2026 included Flexipol starting a new polyurethane foam facility in Rajasthan and Expanded Polymer Systems expanding propylene oxide storage (along with outlining further scale-up). Covestro also announced a strategic program to build a 660,000 tons/year MDI train in Shanghai, China, alongside a feasibility study for a similar facility in the UAE. These moves support opportunities for converters and formulators to align with automotive seating/NVH demand, e-commerce packaging customization and customer reporting needs, using tools that quantify sustainable material share and CO2 footprint in foam formulations.
Recent Industry Developments in Flexible Foam Market
- July 2026: Carpenter Co. completed a 1 MW solar array installation (1,666 panels) at a production facility, with the installation finalized in April 2026. The project lowers site-level energy emissions intensity and supports sustainability positioning for foam products supplied into bedding, furniture and other downstream applications.
- June 2025: Woodbridge opened two joint venture manufacturing facilities in China, with operations starting in mid-May 2025 in Guangzhou and Changzhou. The added footprint strengthens local supply for automotive seating and foam components, shortening delivery cycles for OEM programs in major vehicle manufacturing clusters.
- December 2024: Dow commenced production of VORANOL WK5750 at its Freeport polyol plant. The polyether polyol is positioned for flexible foam applications with enhanced reactivity and controlled viscosity, supporting productivity and quality consistency for foam producers reliant on stable polyol inputs.
Flexible Foam Market Report Scope and Research Methodology
Market Definition and Coverage
This market covers revenue generated from the sale of flexible foam materials used to provide cushioning, insulation, and impact protection across common end uses such as furniture, bedding, consumer goods, construction-related uses, and transportation.
Scope exclusions: We exclude rigid foams, spray foams, and non-foam substitute materials even if they serve similar comfort or insulation needs.
Segments Covered in This Report
- By Type
- Polyurethane
- Polyester
- Polyether
- Polyethylene
- Cross-linked
- Non-cross-linked
- Polypropylene
- Polyurethane
- By Application
- Furniture
- Transportation
- Construction
- Consumer Goods
- Other Applications (Packaging, Medical and Healthcare, etc.)
- By Geography
- Asia-Pacific
- China
- Japan
- India
- South Korea
- ASEAN Countries
- Rest of Asia-Pacific
- North America
- United States
- Canada
- Mexico
- Europe
- Germany
- United Kingdom
- France
- Italy
- Spain
- Russia
- NORDIC Countries
- Rest of Europe
- South America
- Brazil
- Argentina
- Rest of South America
- Middle East and Africa
- Saudi Arabia
- South Africa
- Rest of Middle East and Africa
- Asia-Pacific
Data Sources, Market Sizing, and Validation
Desk Research
Desk research starts by mapping where flexible foam demand originates and how supply is shifting across regions. We relied on public sources such as UN Comtrade for trade flows, the USGS for chemicals and materials context, and the US Energy Information Administration for cost signals tied to feedstocks.
To connect foam demand to end markets, we also used sources such as the US Census Bureau and Eurostat for manufacturing and housing related indicators, plus trade association releases that discuss polyurethane and plastics trends. Company annual reports, investor presentations, and credible press coverage were used to confirm capacity additions, plant startups, and product mix changes. We then used a paid subscription for company financials and an import-export shipment-level database selectively to cross-check scale and direction. These are illustrative sources only, and many other public references were used to collect data, validate assumptions, and clarify open questions.
Primary Interviews and Surveys
Primary work was used to test the desk assumptions that affect the flexible foam forecast the most, including typical price movement, utilization patterns, and where substitution is actually occurring in bedding and furniture. We spoke with manufacturers, converters, distributors, and downstream buyers across major regions, and the feedback helped refine the demand pools and the practical conversion factors used in the model.
Distribution of primary research fieldwork respondents
| Company type | Respondent position | Region |
|---|---|---|
| Top tier: 28% | CXOs: 15% | APAC: 43% |
| Mid tier: 56% | Functional/Unit leaders: 27% | EMEA: 30% |
| Smaller Players: 16% | Managers: 58% | Americas: 27% |
Market-Sizing & Forecasting
Sizing is built using a top-down approach where production, trade, and end-use activity signals are used to reconstruct the regional demand pool for flexible foam. We then corroborate the totals using selective bottom-up checks, including sampled supplier revenues, channel conversations on mix, and a simple ASP times volume sanity check for large applications.
In practice, the model leans on several fingerprints that are easier to verify: mattress and upholstered furniture output trends, automotive build volumes tied to seating and interior uses, housing starts that influence comfort and insulation demand, and resin and polyol price movement that impacts foam ASPs. Utilization and yield assumptions are tightened using interview inputs, and when a country has thin public data, we use proxies such as import dependence, downstream manufacturing indices, and regional trade links to avoid overstating local production.
For forecasting, scenario analysis is used so growth can flex with end-market cycles and feedstock-driven pricing swings. The expected case is anchored to consensus views gathered in interviews, and it is then stress-tested using alternate paths for furniture demand recovery, vehicle production, and construction activity.
Data Validation & Update Cycle
Validation is handled through several passes that check internal consistency and real-world fit. The outputs are checked against independent signals like trade balances, downstream production indices, and observed pricing ranges, and then any large variances are traced back to a specific assumption and corrected if needed.
Before sign-off, the model and the written conclusions go through analyst reviews focused on year-to-year continuity, unit conversions, and currency handling. Reports are refreshed annually, and if a material event happens, such as a major capacity change or a sharp feedstock shift, the team re-checks the assumptions and can re-contact sources to confirm the impact. Right before delivery, a final update pass is completed so clients receive the most current view available.
Mordor Intelligence's Flexible Foam Market Size Compared Against Other Published Estimates
Published market sizes for flexible foam often do not match because the scope is not drawn the same way, and the price logic can differ across studies. Differences also show up when the base year is not aligned, or when a study mixes value and volume signals without clearly reconciling them.
Some estimates fold in adjacent engineered foam families or apply broad comfort-material assumptions that lean heavily toward bedding and furniture, which can compress or inflate totals depending on the year. In Mordor Intelligence calculations, the value is kept tied to flexible foam revenue across polyurethane, polyethylene, and polypropylene types, and it is only counted when the product is sold into defined applications like construction, consumer goods, furniture, and transportation, with annual refresh checks on ASP movement and regional mix.
Benchmark comparison
| Source | Market Size | Gaps in Research Methodology |
|---|---|---|
| Mordor Intelligence | USD 55.65 B (2026) | |
| Industry Data Publisher A | USD 39.02 B (2024) | Uses an earlier base year and a different product lens that emphasizes grades and a narrower set of applications, which can undercount value where flexible polyurethane dominates furniture and bedding spend. |
| Global Consultancy B | USD 41.66 B (2025) | Places heavier weight on comfort-material demand and may exclude parts of construction and consumer goods usage, and the ASP progression approach is not always transparent across regions and foam chemistries. |
Seen together, the spread mainly comes from what gets counted as flexible foam and how application coverage is handled across regions and years. By keeping the scope aligned to foam type and end-use, and then pressure-testing pricing and mix with interviews and external indicators, the final number stays easier to trace back to repeatable inputs.
Key Questions Answered in the Report
What is the current flexible foam market size?
The flexible foam market size stands at USD 55.65 billion in 2026 and is forecast to reach USD 76.71 billion by 2031.
Which region leads the flexible foam market?
Asia-Pacific leads with 45.60% 2025 revenue share and is projected to post a 7.35% CAGR through 2031.
Why is polyurethane foam dominant in the flexible foam market?
Polyurethane offers versatile density control, strong strength-to-weight ratios, and ongoing innovation such as graphene reinforcement and CO₂-based polyols.
How are sustainability trends affecting flexible foam production?
Manufacturers are investing in CO₂-capture polyols, bio-based feedstocks, and recycling to meet tightening VOC and flame-retardant regulations.
What impact do raw-material price swings have on flexible foam producers?
Volatility in MDI and TDI prices can compress margins when converters cannot promptly pass costs to customers, especially in commodity furniture foam.