
Flex-fuel Vehicle Market Size and Share
Market Overview
| Study Period | 2020 - 2031 |
|---|---|
| Market Size (2026) | USD 1.1 Trillion |
| Market Size (2031) | USD 0.98 Trillion |
| Growth Rate (2026 - 2031) | -2.40 % |
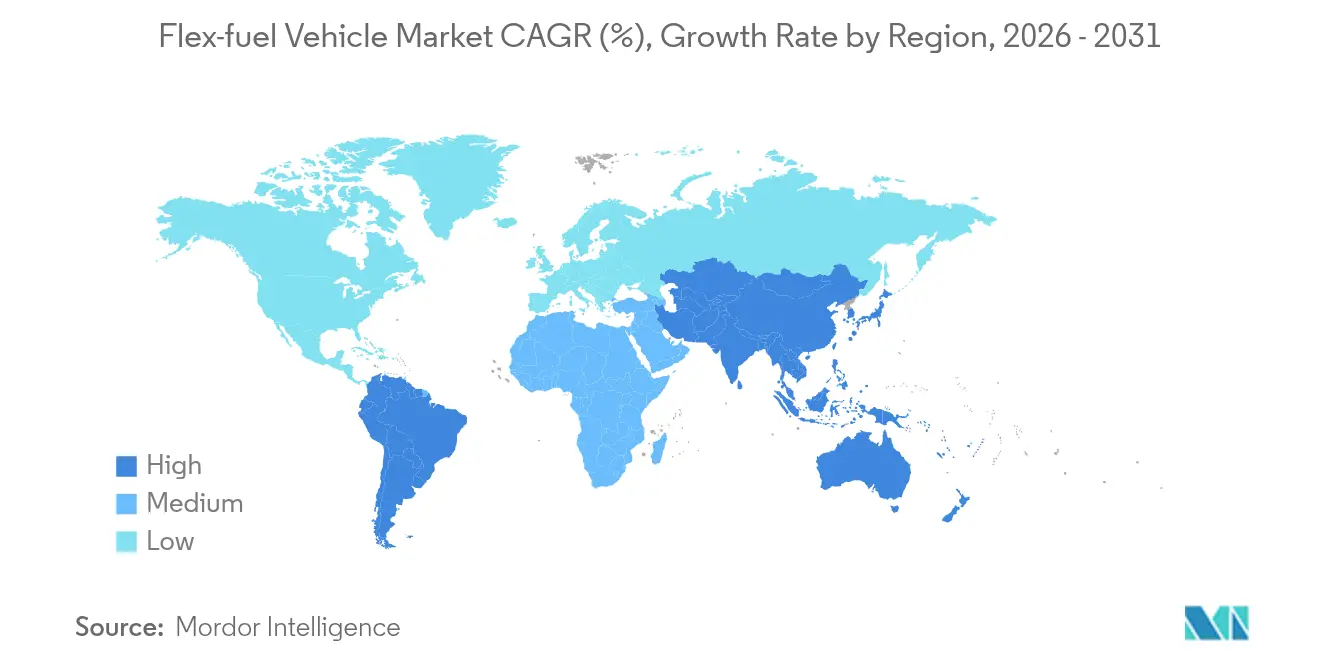
| Fastest Growing Market | Asia-Pacific |
| Largest Market | South America |
| Market Concentration | Medium |
Major Players *Disclaimer: Major Players sorted in no particular order Image © Mordor Intelligence. Reuse requires attribution under CC BY 4.0. | |
Flex-fuel Vehicle Market Analysis by Mordor Intelligence
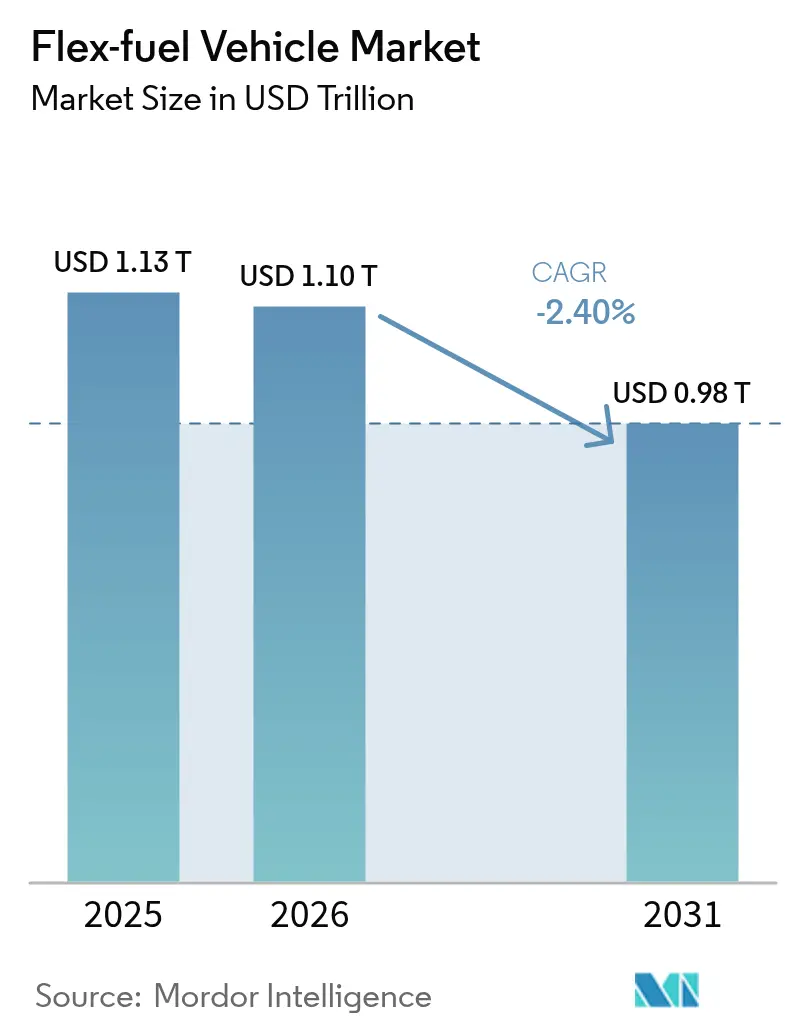
Flex-fuel Vehicle market size in 2026 is estimated at USD 1102.88 billion, growing from 2025 value of USD 1130 billion with 2031 projections showing USD 976.12 billion, growing at -2.4% CAGR over 2026-2031.
The downturn mirrors the auto sector’s accelerated pivot toward battery-electric drivetrains and tightening regulations that favor zero-tailpipe-emission solutions over biofuel blending. OEMs are reassessing capital allocation as electric platforms capture the bulk of new-model investment, while policy instruments such as the European Union’s 2035 combustion-engine phase-out and China’s NEV quotas deepen the structural headwinds. South America remains the stronghold for the flex-fuel vehicle market, anchored by Brazil’s RenovaBio carbon-credit incentives, yet even this region faces slower fleet renewals as hybrid-electric penetration rises. Passenger cars retain scale advantages that shield the segment from steeper volume loss, but commercial fleets are decelerating faster because total cost-of-ownership models increasingly favor electrification. Overall, the market’s strategic relevance is shifting from growth opportunity to transition hedge amid a decarbonization agenda that prioritizes direct electrification.
Key Report Takeaways
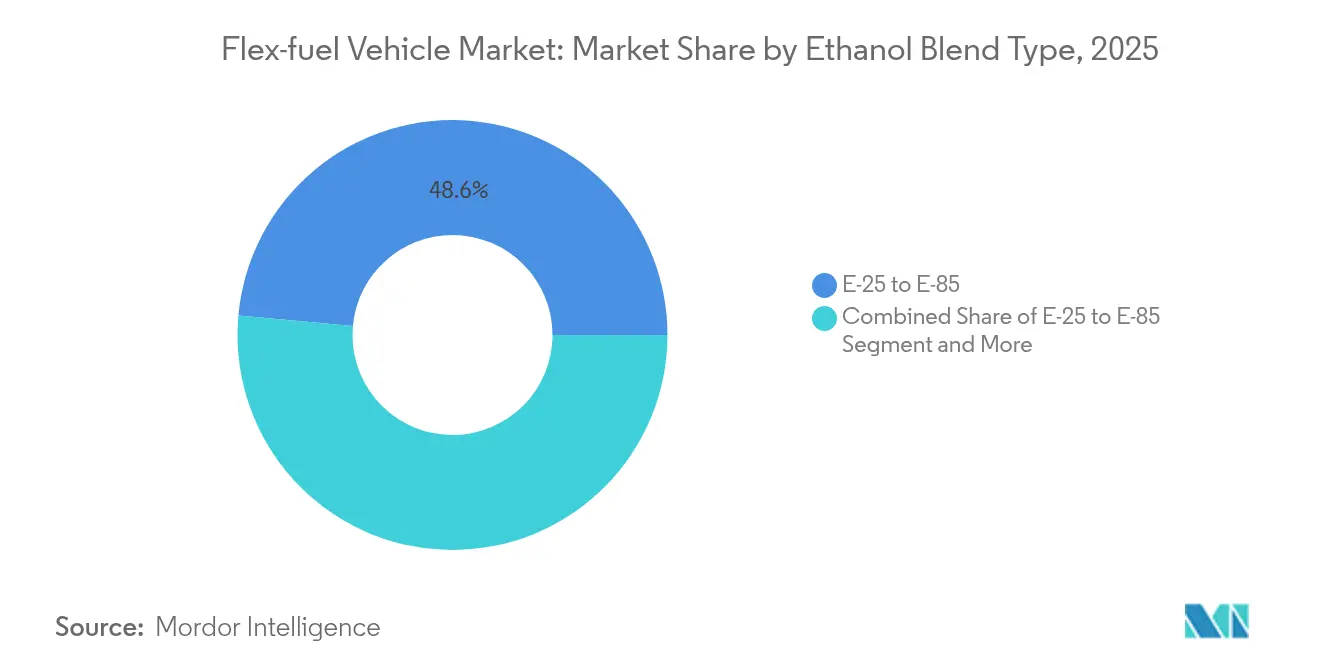
- By ethanol blend type, the E-25 to E-85 segment held 48.55% of flex-fuel vehicle market share in 2025 and is retreating at a -2.30% CAGR to 2031.
- By vehicle type, passenger cars led with 64.52% revenue share in 2025, while heavy-duty and buses recorded the steepest decline at -2.37% CAGR through 2031.
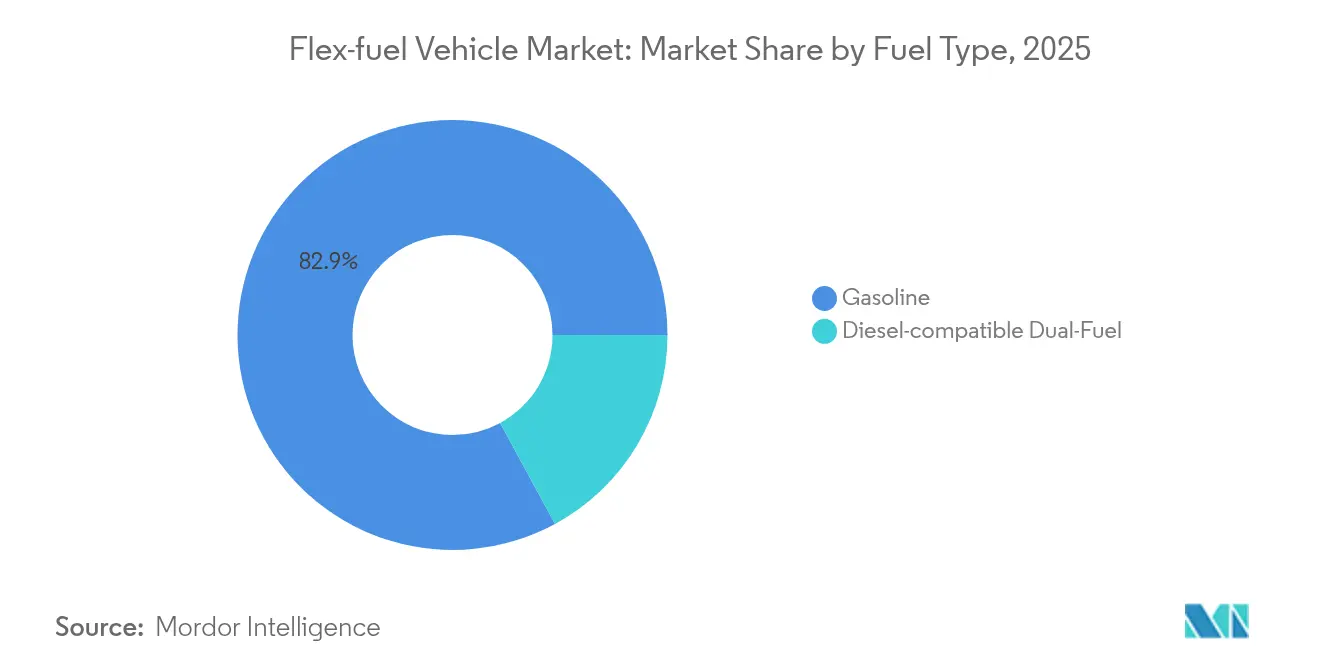
- By fuel type, gasoline-compatible systems accounted for 82.91% of the flex-fuel vehicle market size in 2025 and are forecast to fall at a -2.34% CAGR to 2031.
- By sales channel, OEM-fitted solutions commanded 72.68% of 2025 revenue; aftermarket kits, though smaller, are easing at a slightly slower -2.27% CAGR.
- By geography, South America captured 42.10% regional share in 2025; Asia-Pacific is the fastest-declining geography at -2.23% CAGR for the forecast period.
Note: Market size and forecast figures in this report are generated using Mordor Intelligence’s proprietary estimation framework, updated with the latest available data and insights as of 2026.
Market Trends and Insights
Drivers Impact Analysis of Flex-fuel Vehicle Market*
| Driver | (~) % Impact on CAGR Forecast | Geographic Relevance | Impact Timeline |
|---|---|---|---|
| E-10/E-15 Global Roll-Outs | +0.8% | Global, with early gains in India, Indonesia, Philippines | Medium term (2-4 years) |
| Brazilian Renovabio Carbon-Credit Premiums | +0.6% | South America core, spill-over to Argentina | Long term (≥ 4 years) |
| Cellulosic-Ethanol Price Inflection | +0.5% | North America, potential export to EU | Long term (≥ 4 years) |
| OEM Flex-Strategy To Hedge EV Policy Uncertainty | +0.4% | Global, concentrated in North America and EU | Short term (≤ 2 years) |
| Next-Gen Port-Fuel-Injection Kits | +0.3% | North America and EU aftermarket focus | Medium term (2-4 years) |
| Ethanol-Compatible After-Treatment Cost Deflation | +0.2% | Global manufacturing hubs | Short term (≤ 2 years) |
| Source: Mordor Intelligence | |||


E-10/E-15 global roll-outs in developing nations
Expanding blend mandates across India, Indonesia, and the Philippines are elevating ethanol demand as policymakers seek energy security and farm-income diversification. India’s push toward one-fifth blending by 2026 is turning the country from a corn exporter into a net importer, thereby tightening global feedstock supply[1]Indian Oil Corporation, “Ethanol Blending Roadmap,” iocl.com . Japan’s roadmap for E-10 by 2030 and E-20 by 2040 underscores a coordinated Asian strategy that preserves internal-combustion options while EV infrastructure scales. Feedstock competition with poultry and livestock sectors is lifting input prices, exposing the delicate balance between fuel policy and food security. National oil companies remain critical facilitators of logistics and pricing, helping mitigate regional distribution constraints. Collectively, these programs deliver incremental tail-pipe CO₂ cuts but struggle to reverse the flex-fuel vehicle market contraction amid simultaneous EV incentives.
Brazilian RenovaBio carbon-credit premiums
RenovaBio sets life-cycle-based carbon-credit benchmarks that monetize every incremental efficiency gain along the ethanol supply chain. Premiums for low-carbon CBIO certificates reached USD 115 per tonne-CO₂e in early 2025, adding profitable revenue streams to sugarcane and corn ethanol plants[2]Agência Nacional do Petróleo (ANP), “RenovaBio CBIO Market Data,” anp.gov.br . Expansion in Brazil’s Center-West has already spawned 25 operating corn-ethanol mills with another 15 under construction, lifting total output to 8.2 billion liters for the 2024/25 harvest. The policy’s technology-neutral framework favors best-in-class producers, incentivizing precision-agriculture inputs and waste-heat recovery systems. Petrobras’ endorsement of higher ethanol blends under the “Fuel of the Future” law signals sustained state-backed support for the pathway. While RenovaBio softens revenue volatility tied to sugar prices, it cannot fully offset the macro shift toward electric alternatives.
Cellulosic-ethanol price inflection after U.S. 45Z credit
The U.S. Inflation Reduction Act’s 45Z Clean Fuel Production Credit grants up to USD 1.00 per gallon for fuels scoring below 50 kg CO₂e/mmBTU, sharply improving the economics of agricultural-residue-based ethanol. POET and other producers have announced plans to scale cellulosic output by 2027, elevating rural employment and carbon reductions simultaneously[3]POET, “Cellulosic Expansion Press Statement,” poet.com.The incentive rewards feedstock innovation, including winter-cover-crop biomass and energy sorghum, potentially narrowing the cost gap with corn ethanol. However, the credit sunsets after 2027, pushing developers to accelerate commercial deployment timelines. Export potential to carbon-pricing regions such as the EU adds further upside if logistics hurdles are resolved.
OEM flex-strategy to hedge EV policy uncertainty
Vehicle manufacturers are keeping flex-fuel capability alive to maintain optionality as global regulatory signals evolve. Stellantis committed to develop Bio-Hybrid platforms that pair ethanol engines with 48-V electric assistance, safeguarding compliance in regions where grid readiness lags. General Motors’ alliance with Coskata targets sub-USD 1 per gallon ethanol, securing low-cost fuel for future flex-capable models. Toyota, in collaboration with ENEOS and Idemitsu, is advancing synthetic and bio-fuel blends to complement its battery-electric lineup. These diversified strategies provide insurance against policy reversals, particularly after political transitions, and align with markets where low-carbon liquid fuels remain cost-competitive. Yet capital remains finite, and escalating battery investments inevitably squeeze funding available for combustion-engine R&D.
Restraints Impact Analysis of Flex-fuel Vehicle Market*
| Restraint | (~) % Impact on CAGR Forecast | Geographic Relevance | Impact Timeline |
|---|---|---|---|
| Accelerated Ev Adoption Targets | -1.2% | Europe and China core, spill-over to global markets | Short term (≤ 2 years) |
| OEM Cap-Ex Re-Allocation | -0.8% | Global, concentrated in developed markets | Medium term (2-4 years) |
| Limited Ethanol Feed-Stock | -0.4% | Regional, affecting corn and sugarcane belts | Short term (≤ 2 years) |
| Cold-Start Emission Spikes | -0.3% | Northern regions, Scandinavia, Canada, Russia | Long term (≥ 4 years) |
| Source: Mordor Intelligence | |||
Accelerated EV adoption targets in Europe & China
The European Union’s 2035 combustion ban and China’s escalating NEV quotas are redirecting automaker investment toward full electrification. Chinese brands already occupied 7.9% of EU battery-electric sales in 2023 and may capture 20% by 2027, amplifying competitive pressure. The European EV market is forecast to grow exponentially by 2030, a financial magnet that drains capital from biofuel platforms. China’s cost advantage makes flex-fuel strategies appear economically inferior, reinforcing a feedback loop of policy, infrastructure, and consumer preference. As public charging networks expand, range anxiety wanes, further eroding flex-fuel defensibility. The restraint subtracts the largest single share from the flex-fuel vehicle market CAGR.
OEM cap-ex re-allocation toward BEV platforms
Honda earmarked JPY 10 trillion through 2036 to secure an entirely electric and fuel-cell sales mix by 2040. Volkswagen will channel a massive amount between 2025 and 2029 into electrification and battery verticals. Hyundai’s “Hyundai Way” strategy seeks 2 million EV sales in 2030, leaving no explicit budget line for flex-fuel R&D. As battery costs decline, the hurdle rate for alternative combustion options rises, compelling boards to prioritize scalable electric architectures. Investors track ESG metrics that favor zero-tailpipe emissions, creating reputational risks for firms allocating incremental cap-ex to liquid-fuel engines. This capital reallocation structurally compresses product pipelines for flex-fuel models.
*Our forecasts treat driver/restraint impacts as directional, not additive. The impact forecasts reflect baseline growth, mix effects, and variable interactions.
Flex-fuel Vehicle Market Segment Analysis
By Ethanol Blend Type:
Mid-Range Blends Remain Anchor PointThe E-25 to E-85 category held 48.55% of flex-fuel vehicle market size in 2025 and is forecast to slip at a -2.30% CAGR to 2031. Moderate blends thrive on existing filling-station pumps and engine calibrations that avoid costly hardware changes. Brazil’s evaluation of E30 gasoline aligns with this sweet spot, leveraging a 20-million-vehicle fleet that seamlessly adapts to varying ethanol content. California’s rapid E85 retail sales underscore how regional taxation and price incentives can nudge drivers toward higher biofuel mixes when economics allow. Yet research indicates E30 sits at the inflection point for low-speed pre-ignition control, where further ethanol raises engine-mapping complexity and cold-start risk. This practical ceiling guides OEM design choices and keeps mid-range blends the industry’s default during the transition period.
High blends above E85, while showcasing maximum renewable content, demand dedicated fuel networks and carry energy-density penalties that erode driving range. Entry-level blends such as E10 or E15 aid markets that are still developing supply chains, but they deliver limited carbon reduction, reducing their strategic appeal under stringent emissions goals. The current hierarchy signals a pragmatic compromise between sustainability and infrastructural reality, even as electrification gains traction. Overall, ethanol blends between 25% and 85% will continue to dominate flex-fuel adoption through 2031, provided price differentials against gasoline remain attractive in high-production regions.


By Vehicle Type:
Passenger Cars Resist Faster DownturnPassenger cars generated 64.52% of 2025 revenue and will taper at a slower -2.18% CAGR than commercial segments. Consumer preference for fuel choice, especially where ethanol trades at a discount, sustains baseline demand. Brazil’s compact-car segment still counts flex-fuels as the default configuration, while India’s Tata Punch Flex Fuel showcases innovation potential even in cost-sensitive markets. Light-commercial vans occupy an intermediate position, balancing payload needs with urban-zone regulations that are starting to penalize combustion engines. In contrast, heavy-duty trucks and buses are declining fastest as fleet operators shift capital toward battery-electric and hydrogen models that promise long-term operating savings.
The resilience of the passenger car cohort stems from decentralized refueling and individual price arbitrage behavior, both absent in centralized fleet procurement. Motorcycles offer an emerging niche, with Honda introducing flex-compatible engines that can utilize domestic ethanol streams in Southeast Asia. Still, rising urban clean-air rules and congestion charges are likely to accelerate the migration toward electric scooters and compact EVs. Consequently, passenger cars will preserve volume leadership in the flex-fuel vehicle market, yet the segment’s strategic importance is expected to diminish over the next decade.
By Fuel Type:
Gasoline Foundation Persists Despite InnovationGasoline-based systems held 82.91% of 2025 revenue, pointing to incumbent infrastructure advantages. Service-station ubiquity assures baseline fuel security, allowing ethanol blending without complex logistics. Stellantis is examining Hydrotreated Vegetable Oil compatibility for diesel variants, but this remains a complementary pathway rather than a mainstream replacement. Dual-fuel ethanol–diesel technology, declines at a rate of -2.33% through 2031—though promising emissions gains—faces the twin challenges of engine durability and the rapid ascendance of battery-electric trucks for short-haul routes.
Ethanol’s miscibility with gasoline and existing distribution networks simplifies mid-blend roll-outs, preserving the gasoline segment’s dominance. Nevertheless, the increasing availability of renewable diesel and e-methanol in marine sectors illustrates fuel-agnostic competition that will pressure ethanol’s share. Over time, gasoline’s importance will gradually wane in tandem with the broader decline of internal-combustion platforms, but its commanding position is unlikely to break before 2031.
By Sales Channel:
OEM Integration Outweighs Retrofit FlexibilityOEM-installed systems accounted for 72.68% of global revenue in 2025 and are projected to ease at a -2.32% CAGR. Factory integration guarantees warranty coverage and optimized engine-control calibration, creating value that outweighs the marginally higher sticker price. Automakers embed fuel sensors and adaptive maps during design, minimizing performance compromises across blend ranges. Aftermarket kits, representing the remainder, appeal to cost-conscious owners and agricultural fleets aiming to monetize locally produced ethanol.
While California’s CARB certification program legitimizes retrofit pathways, kit installation costs plus compliance paperwork hamper mass uptake. Furthermore, as vehicles age, owners often face broader maintenance spending that dilutes the payback of conversion. On balance, OEM solutions will remain the principal route for new flex-fuel capability even as total volumes decline, whereas aftermarket offerings will persist as niche tools for specific geographies and use-cases.
Geography Analysis
South America Flex-fuel Vehicle Market
South America led with 42.10% share in 2025, powered by Brazil’s integrated ethanol ecosystem, which includes more than 40,000 retail pumps and a robust CBIO carbon-credit market. The country’s “Fuel of the Future” law raising mandatory blends to 35% keeps domestic demand buoyant, while corn-ethanol expansion diversifies feedstock risk. Stellantis’ EUR 5.6 billion Bio-Hybrid investment underscores the region’s role as a living laboratory for ethanol-electric synergy. Argentina and Paraguay supplement demand by importing sugarcane ethanol, anchoring a regional trade hub that stabilizes supply-chain economics.
APAC Flex-fuel Vehicle Market
Asia-Pacific, despite active blending policies, is the fastest-declining bloc at -2.23% CAGR through 2031. China’s national focus on NEV roll-outs, coupled with provincial subsidies for battery-electric trucks, constrains flex-fuel investments. India’s ethanol program faces feedstock headwinds as corn imports grow, dampening cost competitiveness. Japan’s E-10 pledge provides policy certainty, but domestic automakers are channeling R&D into solid-state batteries, limiting flex-fuel output beyond niche sports models. Southeast Asian nations are exploring B40 biodiesel and ethanol pilots, yet EV incentives are starting to capture the urban consumer segment.
North America and Europe Flex-fuel Vehicle Market
North America retains large ethanol production capacity supported by the 45Z credit, yet market penetration is flat because OEMs aim new product pipelines at electric platforms. California’s zero-emission vehicle mandate accelerates this swing. Europe shows similar patterns: notwithstanding Germany’s push for e-fuels carve-outs post-2035, the regulatory package overwhelmingly steers buyers toward BEVs.
MEA Flex-fuel Vehicle Market
In the Middle East and Africa, fuel diversification strategies tied to food-security and economic diversification provide modest openings, but infrastructure gaps and limited purchasing power restrain widespread uptake.

Regulatory Landscape
Regulation for flex-fuel vehicles is being shaped by fuel-blend mandates and vehicle-efficiency rules that increasingly favor zero-tailpipe-emission options. In Brazil, the Mover program created by Law 14.902/2024 and regulated via Decree 12.435 (April 2025) links industrial policy and tax incentives to energy efficiency and carbon requirements for new vehicles, using a tax-differential mechanism that favors flex-fuel hybrid configurations through December 31, 2026. In the United States, proposed federal legislation such as the Flex Fuel Fairness Act of 2025 (S.2291) and the Nationwide Consumer and Fuel Retailer Choice Act of 2025 (H.R.1346) keeps focus on how flex-fuel benefits are calculated and how higher-ethanol blends are treated across the retail channel.
Vehicle compliance regimes continue to tighten. NHTSA issued a proposal on December 5, 2025 to recalibrate CAFE standards for light-duty vehicles (MY 2022-2026 and MY 2027-2031), reinforcing efficiency pressure on combustion platforms even where ethanol blending is supported. India reached its E20 blending target in the 2025-26 ethanol supply year, but as of July 20, 2026 the government indicated no formal decision to move beyond 20% blending, keeping E85/E100 dependent on additional validation and consultation. Draft Central Motor Vehicles Rules amendments discussed by MoRTH point to work on technical and emissions provisions for higher-ethanol compatibility, but the timing and final form remain policy-dependent.
Value Chain Analysis
The flex-fuel vehicle value chain starts with ethanol production and certification, including corn, sugarcane, and emerging cellulosic pathways. It then covers blending, storage, and distribution through national oil companies and fuel retailers, followed by vehicle engineering, manufacturing, and aftermarket conversion. Upstream programs such as Brazil's RenovaBio (CBIO crediting administered under ANP oversight) and US clean-fuel incentives shape ethanol economics, while midstream constraints stay practical: retail sites need tanks, seals, and dispensing hardware suited for higher ethanol content, which adds coordination risk between fuel availability and vehicle-parc readiness.
On the automotive side, OEMs and Tier-1 suppliers provide ethanol-compatible fuel-system components (corrosion-resistant materials, injectors, pumps), along with sensing and ECU calibration for variable blends, and emissions after-treatment tuned for ethanol's cold-start behavior. Suppliers such as Bosch support flex-fuel architectures (sensors and engine-management solutions), while powertrain partnerships increasingly connect flex fuels with electrification, as reflected in HORSE Powertrain Ltd. and WEG signing an MoU (May 2026) to develop range-extender powertrains that can run on bioethanol and flex fuels. Separately, WEG's MoU with Lecar (June 2026) targets supply of generator and inverter components for a flex-hybrid program. Downstream, OEM-fitted systems dominate new-vehicle integration, while retrofit kits depend on emissions certification pathways and local installer networks. Regulatory clarity and fuel-retail capex remain the main throughput gatekeepers across the chain.
Competitive Landscape
The flex-fuel vehicle market is moderately concentrated, with strategic divergence among global OEMs. Stellantis tops commitment levels via its South American Bio-Hybrid roll-out that blends ethanol engines with small battery packs, extending product relevance in markets where grid reliability is inconsistent. General Motors preserves flex-fuel capability mainly for North and South America, while channeling the majority of new cap-ex into Ultium battery platforms that target a 1 million-unit EV sales run rate by 2030. Toyota maintains a portfolio approach, co-developing synthetic fuels with ENEOS and Idemitsu and field-testing E20 blends in endurance racing, thereby hedging against battery mineral supply shocks.
Tier-one suppliers focus on adaptive fuel sensors and catalyst technologies that accommodate variable ethanol levels without hardware swaps, creating intellectual-property moats around emissions compliance. Retrofit specialists leverage distribution partnerships with farm cooperatives to install port-fuel-injection systems on pickup trucks and tractors.
Barriers to entry remain substantial due to emissions certification costs, yet regulatory clarity under EPA and CARB keeps compliance pathways open for technically capable newcomers. Patent filings for cold-start aids and ethanol-specific lubricants indicate an innovation pipeline that, although thinner than a decade ago, still targets pain points unique to high-ethanol operation.
Flex-fuel Vehicle Industry Leaders
General Motors
Toyota Motor Corporation
Honda Motor Company
Stellantis NV
Ford Motor Company
- *Disclaimer: Major Players sorted in no particular order

Flex-fuel Vehicle Market Companies Covered in this Report
- Stellantis NV
- Volkswagen AG
- General Motors Co.
- Ford Motor Co.
- Toyota Motor Corp.
- Honda Motor Co.
- Hyundai Motor Co.
- Kia Corp.
- Nissan Motor Co.
- Renault SA
- Subaru Corp.
- BMW AG
- Volvo Car Corp.
- Tata Motors Ltd.
- Mahindra & Mahindra Ltd.
- SAIC Motor Corp.
- Great Wall Motor Co.
- Geely Automobile Holdings
- JAC Motors
- Changan Automobile

Market Opportunities and Future Outlook
Near-term white space concentrates where governments are building higher-ethanol fuel frameworks and where OEMs can localize calibration and materials for E85-E100 operation. India provides a clear example of policy and market formation moving in parallel. In 2026, public reporting highlighted MoRTH action to permit E100 use and the Ministry of Petroleum and Natural Gas roadmap for dedicated E85/E100 dispensing stations, while Maruti Suzuki introduced the WagonR Flex Fuel as a mass-market proof point for ethanol-capable passenger cars. Together, these steps create opportunity for OEM-fitted flex systems, ethanol-compatible components, and validation services (materials, durability, emissions, and cold-start calibration) that reduce incremental cost and time-to-certification for higher-blend-capable platforms.
A second opportunity is in South America, where flex-fuel remains embedded and is increasingly linked to hybridization rather than standalone ethanol ICEs. Brazil's policy stack, including RenovaBio economics and the Mover program's incentive structure through 2026, supports continued product programs and localization. Changan and CAOA announced a 2026-2028 investment cycle (R$ 5 billion, cited as about USD 950 million) tied to advanced flex-fuel manufacturing and a new production line in Anapolis, which reinforces demand for local supply bases for sensors, fuel-system hardware, catalysts, and powertrain integration. Across both regions, the main unmet need remains synchronized rollout of multi-blend retail infrastructure and compatible storage and logistics, keeping infrastructure players and equipment suppliers central to commercialization alongside vehicle launches.
Recent Industry Developments in Flex-fuel Vehicle Market
- June 2026: Maruti Suzuki unveiled the WagonR Flex Fuel in India, positioned as a mass-market flex-fuel passenger car capable of operating across E20 to E100 ethanol-petrol blends. The announcement strengthens the OEM-fitted pathway for flex capability and supports demand for localized calibration, ethanol-compatible materials, and compliance testing aligned with higher-blend use cases.
- March 2026: Changan and CAOA announced a new investment cycle for 2026-2028 to expand their Brazil operations and advance flex-fuel manufacturing, including a stated capacity target of 90,000 units annually. The investment reinforces Brazil as a core flex-fuel production hub and pulls forward supplier opportunities in fuel-system hardware, powertrain electronics, and local validation services.
- September 2024: Stellantis launched Fiat bio-hybrid technology in Brazil, pairing ethanol-capable combustion engines with electrified assistance to align flex-fuel with efficiency and emissions requirements. This product strategy anchors flex-fuel demand in South America while redirecting development toward hybridized architectures that can comply with tightening vehicle-efficiency regimes.


Flex-fuel Vehicle Market Report Scope and Research Methodology
Market Definition and Coverage
This market covers the value of flex-fuel vehicles that can operate on gasoline plus ethanol or methanol blends, tracked across major automotive regions and common vehicle classes. We size it in USD terms based on vehicle sales and pricing, aligned to flex-fuel capability and fuel-blend compatibility.
Scope exclusions: Pure battery electric vehicles and conventional gasoline-only vehicles are excluded unless they are explicitly flex-fuel capable.
Segments Covered in This Report
- By Ethanol Blend Type
- E-10 to E-25
- E-25 to E-85
- E-85 and Above
- By Vehicle Type
- Passenger Cars
- Light Commercial Vehicles
- Heavy Commercial Vehicles
- By Fuel Type
- Gasoline
- Diesel-compatible Dual-Fuel
- By Sales Channel
- OEM-fitted
- Aftermarket Conversion Kits
- By Geography
- North America
- United States
- Canada
- Rest of North America
- South America
- Brazil
- Argentina
- Rest of South America
- Europe
- Germany
- France
- United Kingdom
- Spain
- Rest of Europe
- Asia-Pacific
- China
- India
- Japan
- South Korea
- Rest of Asia-Pacific
- Middle East and Africa
- United Arab Emirates
- Saudi Arabia
- Turkey
- Egypt
- South Africa
- Rest of Middle East and Africa
- North America
Data Sources, Market Sizing, and Validation
Desk Research
Desk work sets the boundaries and gives the base data series that our model depends on. We reviewed public vehicle production and registration indicators, ethanol blending policies, and fuel standards, using sources such as the International Energy Agency (biofuels and fuel demand), US EIA (ethanol and gasoline trends), the US EPA (renewable fuel and compliance context), and government transport statistics portals in key markets. Where trade and supply signals mattered, we also checked customs and trade datasets published by national authorities and multilateral bodies.
To convert those signals into a market value that is usable, we supplemented with company filings, investor presentations, and credible press coverage about flex-fuel program rollouts, model availability, and regional adoption patterns. In a few cases, paid databases were referenced for company financials and vehicle sales intelligence, and patent databases were used to sense direction in flex-fuel engine and fuel-system activity. The desk research sources listed here are illustrative and not exhaustive, since many additional references were used for data collection, cross-checks, and clarification.
Primary Interviews and Surveys
Primary work was used to pressure-test adoption assumptions and to make sure pricing and mix effects were realistic by region and vehicle type. We spoke with stakeholders across OEM and component ecosystems, fuel and biofuel value chains, and channel-side experts who track vehicle availability and buyer behavior, and then used follow-ups to resolve gaps where desk indicators conflicted.
For a global market like flex-fuel vehicles, the feedback was balanced across APAC, EMEA, and the Americas so regional policy signals and fleet patterns were not over-weighted in the final totals.
Distribution of primary research fieldwork respondents
| Company type | Respondent position | Region |
|---|---|---|
| Top tier: 28% | CXOs: 14% | APAC: 50% |
| Mid tier: 58% | Functional/Unit leaders: 40% | EMEA: 31% |
| Smaller Players: 14% | Managers: 46% | Americas: 19% |
Market-Sizing & Forecasting
The core sizing starts with a top-down build that reconstructs flex-fuel capable vehicle demand from country level vehicle sales and parc signals, and then applies a flex-fuel penetration view that is anchored to local blending mandates and model availability. Once the demand pool is formed, value is calculated using average selling price ranges that are normalized by vehicle class, region, and inflation, and then converted into USD on a consistent timing basis.
To keep the totals realistic, we corroborated the outputs with selective bottom-up checks, such as rolling up sampled model lineups, typical flex-fuel fitment share by market, and channel checks on how often flex-fuel variants are actually stocked and sold. Inputs that mattered most included ethanol blend adoption (E10 to E25, E25 to E85, and E85 and above), passenger versus commercial mix, gasoline versus diesel flex-fuel compatibility where applicable, regional policy continuity, and the relative availability of flex-fuel models versus alternatives. Where bottom-up visibility was thin for smaller countries, we used proxy penetration curves from similar regulatory and fuel infrastructure settings, and then adjusted them after expert review.
For forecasting, scenario analysis was used because policy-driven fuel blending and OEM lineup decisions can shift faster than long historical trends suggest. The forward view was guided by expert consensus on blending targets, expected model refresh cycles, and pricing movement by vehicle class, and then tempered by macro indicators tied to light vehicle demand and fuel price spreads.
Data Validation & Update Cycle
Validation is done through multiple checks so the value trend and the unit logic stay consistent. We compare the model outputs against independent signals such as regional vehicle sales totals, reported ethanol consumption and blending rates, and known flex-fuel strongholds where adoption is structurally higher. When an outlier shows up, the assumptions are re-opened, followed by a second pass on the conversion rates, pricing, and regional weights before internal sign-off.
The report is refreshed annually, and interim updates are triggered when material events occur, such as major blending policy changes or a sharp shift in vehicle demand. Before delivery, a final analyst pass is completed so the numbers reflect the latest public data and any confirmed expert updates.
Mordor Intelligence's Flex Fuel Vehicle Market Size Compared Against Other Published Estimates
Published flex-fuel vehicle market estimates can look far apart because the counted value is not always the same thing, even when the title sounds similar. Differences usually come from what is treated as a flex-fuel vehicle, whether only incremental flex-fuel content is counted versus the full vehicle value, and how regions with high ethanol blending are weighted.
A second driver is modeling hygiene, especially when pricing is converted to USD using mixed exchange-rate timing, or when ASP progression is pushed forward without checking it against actual vehicle class mix. By refreshing the currency timing and re-checking ASP bands against recent vehicle sales patterns during updates, Mordor Intelligence reduces drift that can otherwise accumulate across forecast revisions.
Benchmark comparison
| Source | Market Size | Gaps in Research Methodology |
|---|---|---|
| Mordor Intelligence | USD 1.13 T (2025) | |
| Trade Journal A | USD 68.20 B (2025) | This figure appears closer to an incremental or narrower revenue construct, where only selected flex-fuel related value is counted rather than the full vehicle value across regions and vehicle classes. |
| Industry Publisher B | USD 3.40 B (2025) | The estimate is consistent with a tightly scoped market definition, which can exclude large FFV-heavy geographies and may count limited segments or revenue pools, leading to a much smaller total. |
The table shows that scope and value basis are doing most of the work behind the spread. When the counted item is the full vehicle value for flex-fuel capable units, and the pricing and currency timing are kept consistent year to year, the total naturally lands much higher than estimates built on narrower revenue slices.


Key Questions Answered in the Report
What is the current global flex-fuel vehicle market size?
The flex-fuel vehicle market size was USD 1.10 trillion in 2026.
How fast is the market shrinking?
It is projected to decline at a -2.40% CAGR between 2026 and 2031.
Which region leads consumption of flex-fuel vehicles?
South America holds 42.10% of 2025 revenue, driven by Brazil’s ethanol infrastructure.
Why are passenger cars more resilient than buses in this market?
Individual consumers value fuel choice, whereas fleet operators favor the lower operating costs of electrified drivetrains.
How do RenovaBio carbon credits support ethanol producers?
The credits provide additional revenue tied to life-cycle emission savings, cushioning producers against commodity price swings.
What impact does the U.S. 45Z credit have on cellulosic ethanol?
It can add up to USD 1.00 per gallon, potentially making cellulosic ethanol cost-competitive with corn-based alternatives.
Page last updated on:


 Your data is secure and never sold or shared.


