
Market Overview
| Study Period | 2021 - 2031 |
|---|---|
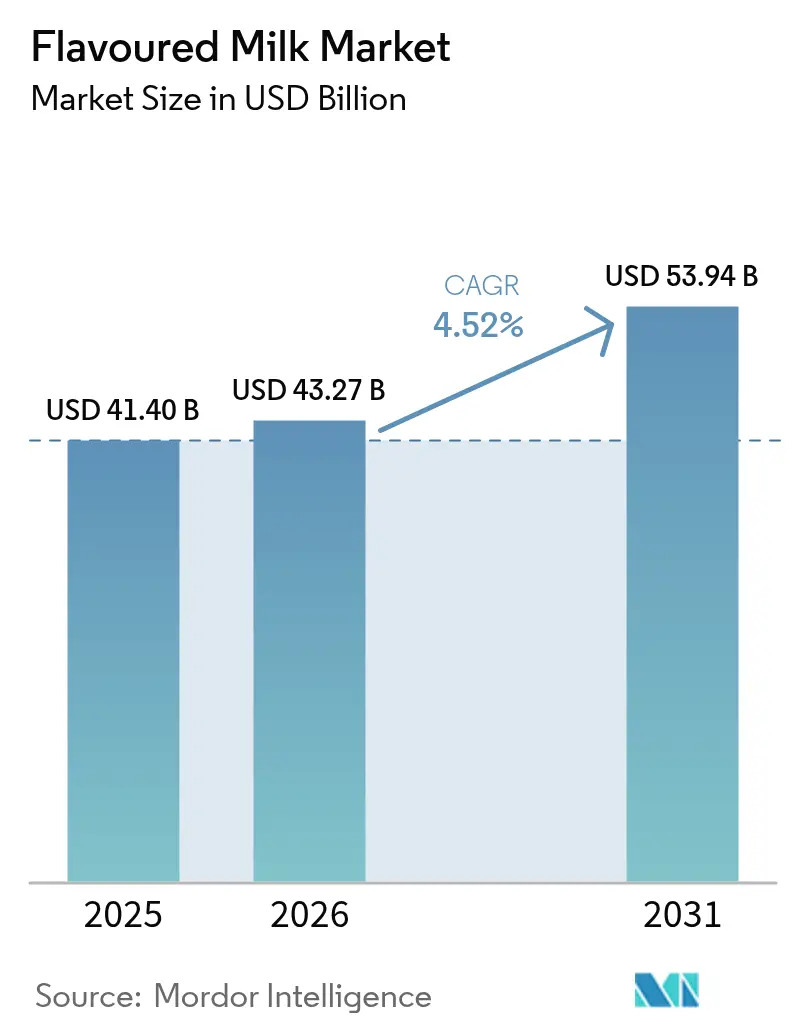
| Market Size (2026) | USD 43.27 Billion |
| Market Size (2031) | USD 53.94 Billion |
| Growth Rate (2026 - 2031) | 4.52 % |
| Fastest Growing Market | North America |
| Largest Market | Asia Pacific |
| Market Concentration | Medium |
Major Players
*Disclaimer: Major Players sorted in no particular order Image © Mordor Intelligence. Reuse requires attribution under CC BY 4.0. |
|
Flavoured Milk Market Analysis by Mordor Intelligence
The flavoured milk market size is expected to grow from USD 41.40 billion in 2025 to USD 43.27 billion in 2026 and is forecast to reach USD 53.94 billion by 2031 at 4.52% CAGR over 2026-2031. This growth is driven by several factors, including increasing disposable incomes in developing countries, greater consumer acceptance of protein-enriched products, and advancements in technologies like ultrafiltration and precision fermentation. These developments are enabling manufacturers to expand their product offerings and cater to the rising demand for premium, nutrient-rich options. Companies are also focusing on developing high-quality textures that work well in espresso-based beverages, appealing to coffee enthusiasts. Currently, the Asia-Pacific region dominates the flavoured milk market, accounting for the largest share. This is largely due to the increasing popularity of lactose-free and high-protein flavoured milk products, which appeal to both sports nutrition and mainstream health-conscious consumers. The global market remains moderately concentrated, with key players driving innovation and competition.
Key Report Takeaways
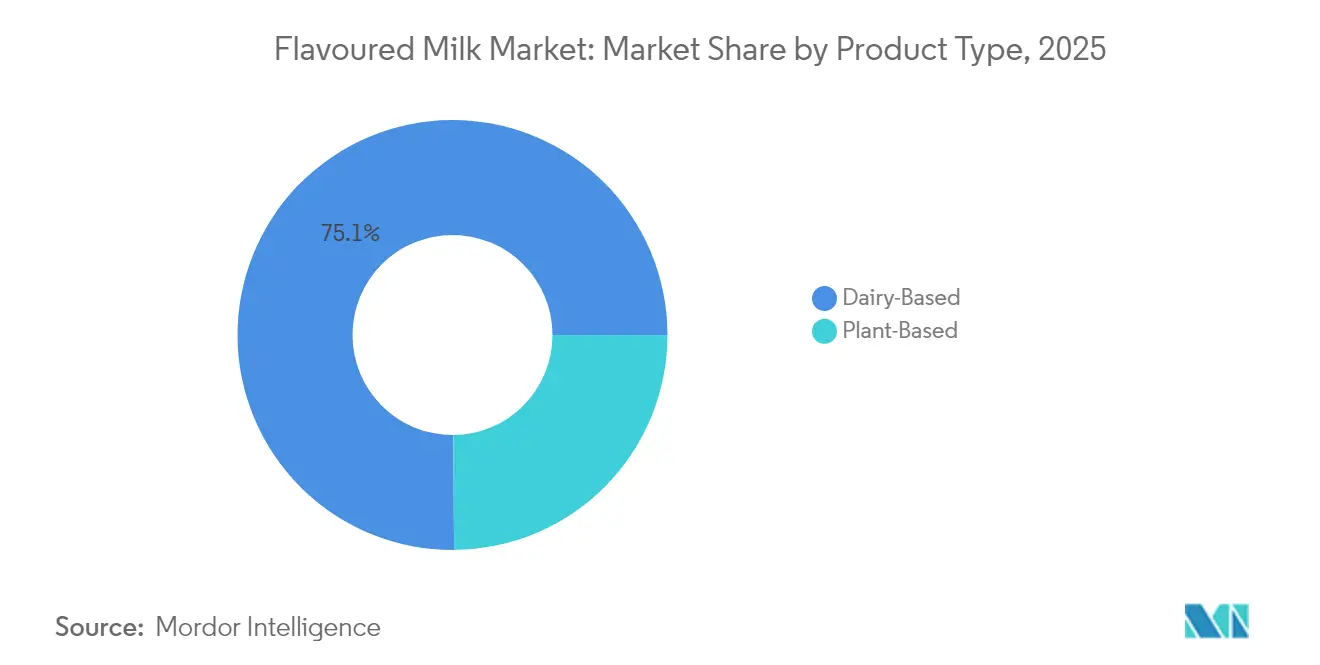
- By product type, dairy-based variants held 75.12% flavoured milk market share in 2025, while plant-based alternatives are expanding at an 8.12% CAGR to 2031.
- By flavour profile, chocolate commanded 40.68% of the flavoured milk market size in 2025, whereas strawberry is poised for 7.2% CAGR growth through 2031.
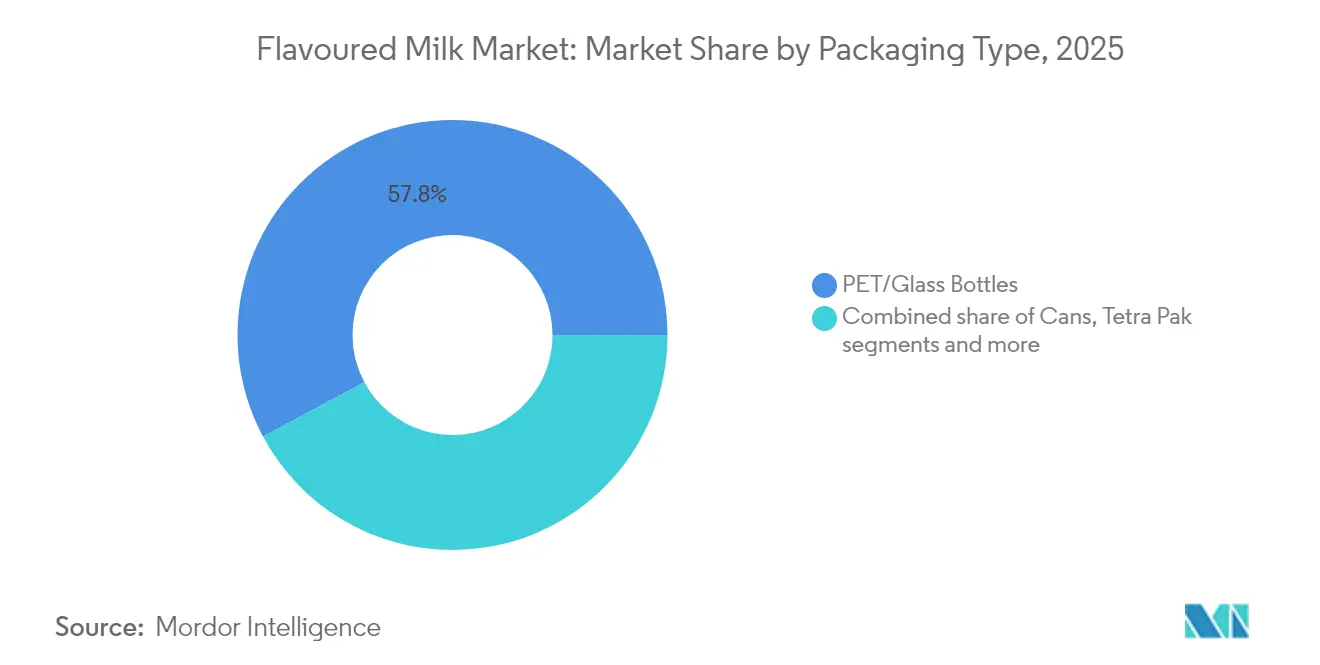
- By packaging, PET/glass bottles captured 57.83% of 2025 revenue, while aluminum cans represent the fastest-rising format at a 6.11% CAGR to 2031.
- By distribution channel, supermarkets/hypermarkets held 35.15% share of the flavoured milk market size in 2025, yet online retail is forecast to grow at 7.84% CAGR.
- By geography, Asia-Pacific led with a 43.02% flavoured milk market share in 2025, whereas North America is projected to log the highest regional CAGR at 7.18% through 2031.
Note: Market size and forecast figures in this report are generated using Mordor Intelligence’s proprietary estimation framework, updated with the latest available data and insights as of 2026.
Global Flavoured Milk Market Trends and Insights
Drivers Impact Analysis*
| Driver | (~) % Impact on CAGR Forecast | Geographic Relevance | Impact Timeline |
|---|---|---|---|
| Growing preference for convenient and ready-to-drink beverages | +0.8% | Global, with acute demand in North America and urban Asia-Pacific | Short term (≤ 2 years) |
| Rising inclination toward protein-rich and nutrient-dense beverages | +0.9% | North America, Europe, Australia; emerging in India and China | Medium term (2-4 years) |
| Expansion of plant-based flavoured milk options | +1.2% | North America and Europe core, accelerating in Asia-Pacific urban centers | Medium term (2-4 years) |
| Growing café culture and the popularity of coffee-flavoured milk variants | +0.6% | Asia-Pacific (China, Japan, South Korea), North America specialty coffee chains | Short term (≤ 2 years) |
| Interest in clean-label flavoured milk with fewer additives and natural flavours | +0.7% | Europe, North America; regulatory spillover to Latin America and Asia-Pacific | Long term (≥ 4 years) |
| Limited-edition flavoured milk created in partnership with celebrities | +0.3% | North America, select European markets; social-media-driven campaigns | Short term (≤ 2 years) |
| Source: Mordor Intelligence | |||
Rising inclination toward protein-rich and nutrient-dense beverages
The demand for flavoured milk is increasing globally as more consumers look for beverages that are rich in protein and packed with nutrients. According to the International Food Information Council Food and Health Survey 2024, 71% of Americans were actively trying to include more protein in their diets[1]Source: International Food Information Council, "2024 IFIC Food and Health Survey", ific.org. This trend is driving the popularity of flavoured milk as a convenient and nutritious option. Advances in ultrafiltration technology now allow milk to contain two to three times more natural protein without affecting its texture, making it a suitable choice for meal replacements. Brands like Fairlife and Chobani are capitalizing on this by offering products with 20–30 grams of protein per serving, appealing to both fitness enthusiasts and everyday consumers. In Europe, Arla’s Protein Food to Go range provides 25 grams of protein along with added vitamin D, making it accessible through vending machines in workplaces and universities.
Growing preference for convenient and ready-to-drink beverages
The demand for flavoured milk is growing globally as consumers increasingly prefer convenient, ready-to-drink options. Rising milk consumption levels support this trend. According to the Press Information Bureau, per capita milk consumption in 2022–23 reached 164 grams per day in rural areas and 190 grams per day in urban areas, indicating a strong foundation for introducing value-added dairy products, such as flavoured milk[2]Source: Press Information Bureau, "Milk Production and Adulteration", pib.gov.in. Many consumers now view flavoured milk as a quick and portable snack, ideal for busy lifestyles such as commuting, studying, or working. This has led to a rise in demand for single-serve packaging. Ambient-stable formulations are helping brands expand their reach into vending machines, travel retail, and rural markets where refrigeration may be limited. The growing preference for portion-controlled options is also driving sales of smaller bottles and cans, typically ranging from 250 to 330 milliliters.
Expansion of plant-based flavoured milk options
The growth of plant-based flavoured milk options is driving the global market, supported by a rapidly increasing consumer base, which now includes approximately 88 million vegans worldwide, as reported by the World Animal Foundation as of June 2025[3]Source: World Animal Foundation, "How Many Vegans Are in the World in 2025? Latest Vegan Stats", worldanimalfoundation.org. Oat milk has become more popular than almond milk in many café chains because it provides better foam stability for beverages like lattes and has a lower environmental impact due to reduced water usage. This has made oat milk the leading plant-based option in 2024. Advancements in precision-fermented proteins by companies like TurtleTree are enabling plant-based drinks to achieve protein levels comparable to those of dairy products while significantly reducing their carbon footprint. In some regions, such as Israel and Japan, hybrid products combining about 20% dairy cream with plant-based ingredients have gained popularity.
Growing café culture and the popularity of coffee-flavoured milk variants
The growing popularity of café culture and coffee-flavoured milk products is significantly boosting the global flavoured milk market. Urban consumers, in particular, are drawn to these products as they offer a combination of indulgence and convenience. Ready-to-drink (RTD) formats inspired by café-style beverages replicate the experience of lattes and other coffee drinks without the need for barista preparation. Starbucks played a key role in shaping this segment with the success of its bottled Frappuccino. Newer cold-brew milk hybrids are gaining traction, offering 120–150 milligrams of caffeine and smoother flavour profiles. These options appeal to younger consumers who may find traditional black coffee too bitter. Brands like Nestlé have introduced innovative products, such as the Nescafé RTD line, which combines cold-brew coffee with monk fruit for reduced sugar content and ultrafiltered milk, meeting the growing demand for high-protein beverages.
Restraints Impact Analysis*
| Restraint | (~) % Impact on CAGR Forecast | Geographic Relevance | Impact Timeline |
|---|---|---|---|
| Concerns about high sugar content in flavoured milk | -0.5% | Global, with acute regulatory pressure in Europe, North America, and India | Short term (≤ 2 years) |
| Growing preference for transparent ingredient lists | -0.4% | Europe, North America; consumer-driven scrutiny spreading to Asia-Pacific | Medium term (2-4 years) |
| Volatility in milk prices is increasing production costs | -0.6% | Global, with severe impact in Europe, North America, and Oceania dairy-exporting regions | Short term (≤ 2 years) |
| Negative perceptions around artificial flavours, colors, and stabilizers | -0.4% | Europe, North America; regulatory spillover to Latin America and Asia-Pacific | Long term (≥ 4 years) |
| Source: Mordor Intelligence | |||
Concerns about high sugar content in flavoured milk
Concerns about high sugar content are becoming a significant challenge for the global flavoured milk market, as consumers are becoming increasingly cautious about their sugar intake. According to the International Food Information Council Food and Health Survey 2024, 66% of American consumers were actively trying to reduce their sugar intake, which has led to greater scrutiny of flavoured milk[4]Source: International Food Information Council, "2024 IFIC Food and Health Survey", ific.org. Public health organizations are also identifying sugary beverages as key contributors to obesity, leading to stricter regulations worldwide. For instance, India introduced a front-of-pack labeling rule in 2024 that mandates a red warning symbol on beverages containing more than 5 grams of added sugar per 100 milliliters. This has pushed major dairy companies in the region to reformulate their products to comply with the new standards.
Volatility in milk prices is increasing production costs
Fluctuating milk prices are posing a major challenge for the global flavoured milk market. These unpredictable price changes are making it difficult for manufacturers to manage costs and plan effectively, as their profit margins are being squeezed. Factors such as extreme weather conditions, shortages in animal feed, and shifts in China's demand for dairy imports have led to significant price fluctuations in key dairy markets. This has left processors with very low profit margins, often in the single digits, and increased financial risks for businesses. In Europe, similar challenges are prompting large companies to sign long-term contracts with farmers. However, these contracts often require farmers to adopt sustainable practices, such as using feed additives that reduce methane emissions. While these measures help improve environmental sustainability, they also increase production costs.
*Our forecasts treat driver/restraint impacts as directional, not additive. The impact forecasts reflect baseline growth, mix effects, and variable interactions.
Segment Analysis
By Product Type: Precision Fermentation Narrows the Dairy-Plant Gap
Dairy-based flavoured milk remained the leading segment in 2025, accounting for 75.12% of the global market share. This dominance is driven by consumer trust in traditional flavours like chocolate and vanilla, which have been popular for decades. The availability of a strong cold-chain infrastructure ensures these products are consistently accessible to consumers. Well-established brands benefit from wide retail distribution and competitive pricing, making them a preferred choice. Recent innovations, such as high-protein and low-sugar options, are helping dairy-based products cater to evolving consumer preferences and expand their usage across different occasions.
The plant-based flavoured milk segment is growing rapidly, with an expected CAGR of 8.12% from 2026 to 2031. This growth is fueled by advancements in technology, such as precision-fermented whey proteins, which allow plant-based options like oat and almond milk to offer nutritional benefits similar to dairy. Increasing awareness about health, the rise in vegan and flexitarian lifestyles, and concerns about sustainability are driving demand for these products. Furthermore, the adoption of plant-based milk in cafés and foodservice outlets is making these alternatives more mainstream, appealing to a broader audience beyond niche markets.


By Flavour Profile: Nostalgic and Functional Variants Challenge Chocolate Dominance
In 2025, chocolate remained the most popular flavoured milk, accounting for 40.68% of global consumption. Its universal appeal across all age groups has made it a staple choice for consumers. Vanilla followed with an 17.74% share, favored for its mild and versatile taste that suits both breakfast and snack occasions. Other flavours, including strawberry, coffee, caramel, and limited-edition varieties, contributed to the remaining demand. The market's growth is supported by effective product placement in convenience stores and continuous innovation in creating indulgent and appealing flavour combinations.
Strawberry-flavoured milk is expected to grow the fastest through 2031, with a projected CAGR of 7.2%. This growth is driven by rising consumer interest in functional beverages, as brands increasingly fortify strawberry variants with nutrients like collagen, probiotics, and vitamin C. These fortified options are particularly appealing to younger consumers and health-conscious parents seeking nutritious yet tasty choices. As more brands focus on adding health benefits to their products, strawberry-flavoured milk is set to capture a larger market share, positioning itself as a refreshing and health-focused alternative.
By Packaging Type: Aluminum Cans Unlock Ambient Distribution
PET/glass bottles were the most popular packaging formats in 2025, accounting for 57.83% of the flavoured milk market. These materials are transparent, allowing consumers to see the product's color and freshness, which builds trust and enhances shelf appeal. They are versatile, catering to both single-serve and larger pack sizes, making them suitable for various retail channels. Their widespread availability in convenience stores, supermarkets, and cafés further strengthens their dominance in the market. Overall, PET and glass bottles remain the preferred choice for both manufacturers and consumers due to their practicality and visual appeal.
Aluminum packaging is expected to grow at the fastest rate, with a projected CAGR of 6.11% through 2031. This growth is driven by increasing demand for sustainable packaging options, as aluminum is highly recyclable and has a lower environmental impact compared to other materials. Additionally, aluminum's durability and ability to preserve products without refrigeration make it ideal for reaching rural and emerging markets where cold storage is limited. As more manufacturers adopt aluminum to meet sustainability goals and expand their market reach, this packaging format is set to play a significant role in the flavoured milk segment's future growth.
By Distribution Channel: Direct-to-Consumer Models Redefine Loyalty
Supermarkets/hypermarkets continued to dominate as the preferred choice for purchasing flavoured milk in 2025, accounting for 35.15% of total sales. These stores attract consumers by offering a wide variety of products, frequent promotions, and easy access to both traditional dairy and plant-based options. Families often rely on these outlets for bulk purchases and value packs, which provide cost savings and convenience. The extensive network of supermarkets and hypermarkets ensures that flavoured milk is readily available across different regions, making it a key driver of market growth.
Between 2026 and 2031, online sales are expected to grow significantly at a CAGR of 7.84%, becoming the fastest-growing distribution channel for flavoured milk. The convenience of ordering through mobile apps has made it easier for consumers to purchase products more frequently. Subscription services, which offer regular deliveries and cost benefits, are gaining popularity among busy customers. Moreover, online platforms provide access to a wider variety of flavours and eco-friendly delivery options, appealing to environmentally conscious buyers. These factors are anticipated to significantly boost the role of e-commerce in the flavoured milk market during the forecast period.
Geography Analysis
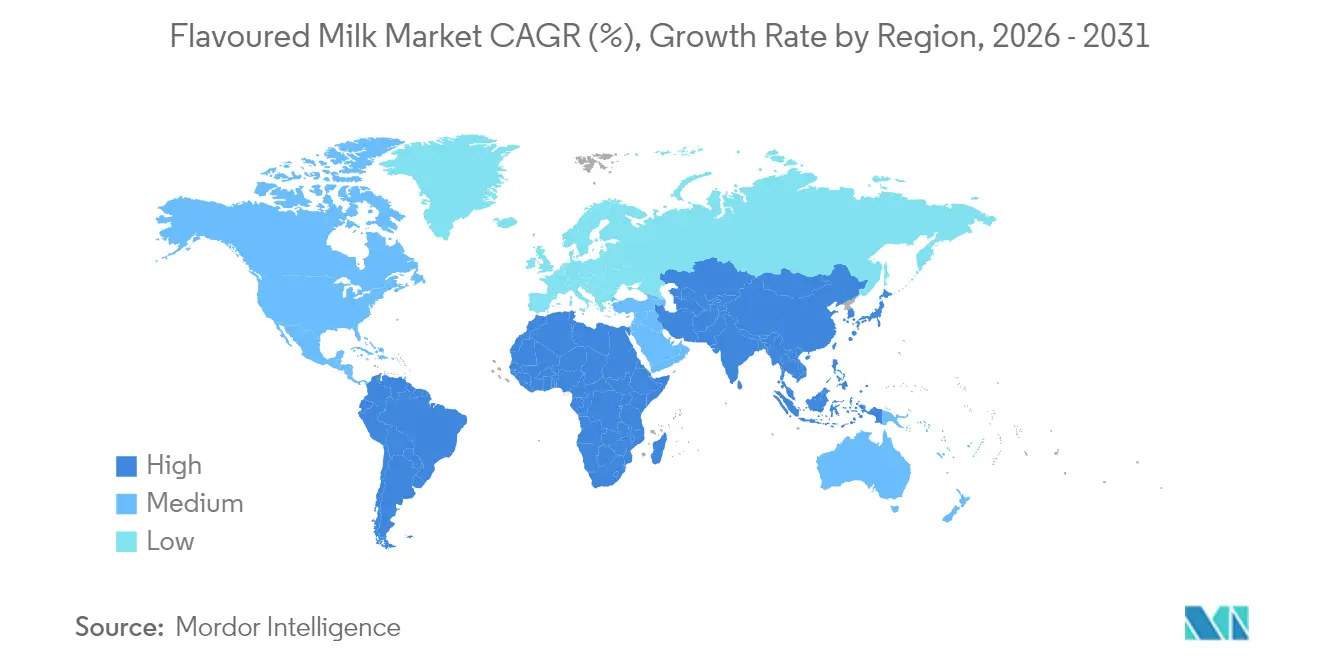
Asia-Pacific remains the largest market for flavoured milk in 2025, contributing 43.02% of global revenue. The region's dominance is driven by strong demand for both chilled and shelf-stable products, supported by improved cold-chain infrastructure and widespread retail availability. Major countries like China, India, and Japan are key contributors, as consumers increasingly prefer flavoured milk for its taste and nutritional benefits. Additionally, the popularity of unique local flavours, rapid urbanization, and the active participation of leading dairy companies are further boosting the market's growth in this region.
North America is the fastest-growing region in the flavoured milk market, with a projected CAGR of 7.18% through 2031. This growth is largely due to the increasing demand for lactose-free, high-protein, and ultrafiltered milk options, which appeal to health-conscious consumers. The market also benefits from innovative product launches, convenient ready-to-drink packaging, and strong retail distribution networks. Moreover, the trend of premiumization and the growing café culture are expanding the use of flavoured milk, making it a popular choice for various consumption occasions beyond traditional ones.
Europe holds a significant share of the flavoured milk market, supported by its well-established dairy industry and consistent household consumption. However, stricter regulations on sugar content and additives are encouraging manufacturers to focus on organic, clean-label, and protein-enriched products. Meanwhile, regions like the Middle East-Africa and South America, which together account for nearly one-fifth of global demand, are witnessing growth due to rising interest in local flavours, the increasing popularity of café culture, and the expansion of school nutrition programs. These factors are collectively shaping the global flavoured milk market and driving its development.

Regulatory Landscape
Regulation of flavoured milk continues to tighten around sugar reduction, additive permissions, and compositional standards, with institutional channels such as schools drawing particular scrutiny. In the United States, USDA school-meal standards introduced added-sugar limits for flavored milk (10 g added sugar per 8 fl oz) and tightened competitive-food thresholds for middle and high schools (15 g added sugar per 12 fl oz). Implementation beginning July 1, 2025 is already shaping reformulation and pack-size strategies for on-campus sales.
Globally, manufacturers are aligning formulations and labeling to food-category definitions and additive rules. Codex Alimentarius GSFA classifies flavoured fluid milk drinks under category 01.1.4, which many countries use as a reference point when translating international benchmarks into local dairy-beverage regulations. India’s FSSAI dairy standards also set minimum compositional requirements (fat and SNF aligned to the base milk type) and heat treatment for flavoured milk. In Europe, additive and ingredient compliance continues to evolve; Commission Implementing Regulation (EU) 2026/397 (February 2026) expanded authorizations for certain novel food additives across dairy categories, increasing the need for SKU-by-SKU verification for flavoured milk and adjacent fermented dairy drinks.
Competitive Landscape
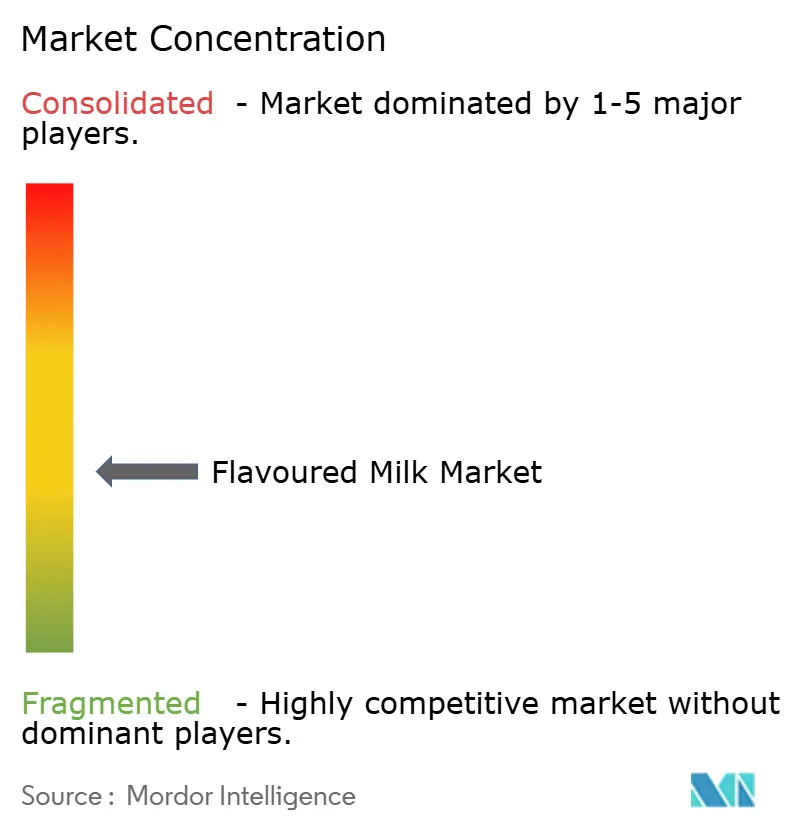
The flavoured milk market is moderately fragmented, with a few major companies leading the way. These large multinational corporations dominate the market due to their strong supply chains, widespread distribution networks, and well-established brands. They also maintain long-term relationships with retailers and consistently invest in developing innovative products. This focus on partnerships and product innovation helps them maintain their competitive edge and leadership in the market.
Competition in the flavoured milk market is intensifying as both traditional dairy companies and plant-based brands expand their product offerings. Established brands continue to focus on popular flavours and products that appeal to a broad audience. Meanwhile, newer players are gaining attention by offering products with added health benefits, clean-label claims, and higher protein content. Additionally, unique options such as café-inspired flavours, blends of dairy and plant-based ingredients, and indulgent limited-edition variants are attracting consumers seeking innovative and exciting choices.
To adapt to changing consumer preferences, companies are implementing various strategies. Premium brands are focusing on sustainability, using high-quality ingredients, and offering healthier options such as high-protein or low-sugar products. On the other hand, value-oriented brands are targeting budget-conscious consumers by providing affordable products with simpler recipes. Innovations in packaging, such as designs that extend shelf life or reduce the need for refrigeration, are enabling brands to reach underserved markets. Furthermore, stricter regulations on sugar content, labeling, and additives are driving companies to reformulate their products and cater to institutional markets like schools and healthcare facilities.
Flavoured Milk Industry Leaders
-
Nestlé SA
-
Danone SA
-
Arla Foods Amba
-
Saputo Inc.
-
Lactalis Group
- *Disclaimer: Major Players sorted in no particular order

Market Opportunities and Future Outlook
Shelf-stable and ambient distribution formats remain an important gap for flavoured milk in markets where refrigeration is fragmented, and recent investments show how packaging technology is being used to extend reach. In February 2026, Britannia Industries commissioned its first aseptic PET line at its greenfield dairy facility in Ranjangaon (Maharashtra), using Sidel’s Aseptic Combi Predis system for its Winkin’ Cow dairy drinks. This supports scaling ready-to-drink dairy beverages with longer shelf life and reduced cold-chain dependency.
Capacity expansion and dairy processing regionalization also create room to widen flavoured milk portfolios, including protein-forward and low-sugar options that match tightening nutrition expectations. In June 2026, Pelwatte Dairy announced a Rs. 1.86 billion greenfield liquid milk manufacturing facility at Kurunegala, with flavoured milk variants included in the product plan and construction scheduled for July 2026, which should add local supply for wider distribution and new flavor and format development. In the United States, active dairy plant investment tracked at a multi-billion-dollar scale (over USD 14.5 billion in projects as of 2026, with about USD 7 billion under construction) indicates ongoing processing expansion that can be directed toward value-added beverages, including flavoured milk, alongside protein ingredients enabled by ultrafiltration and related technologies.
Recent Industry Developments
- March 2026: Nestle resumed operations at its Palmeira das Missoes facility in Rio Grande do Sul, Brazil, following a R$60 million investment to produce whey for infant nutrition. The investment improves whey availability and processing capability, which can support higher-protein dairy beverage formulation and broader value-added dairy production in the region.
- August 2025: Lactalis agreed to acquire Fonterra's global consumer and associated businesses for NZ$3.845 billion, including brands such as Mammoth flavoured milk drinks, subject to regulatory and shareholder approvals. The transaction increases Lactalis exposure to established flavoured milk platforms and can affect brand portfolios and route-to-market positions in key consumer dairy geographies.
- May 2024: Arla Foods and Mondelez International expanded Milka-branded chocolate milk production across Germany, Austria, and Poland, effective June 2024. This cross-border initiative strengthens Milka brand presence in Central Europe and supports faster product introduction and market reach for flavoured dairy beverages.


Research Methodology Framework and Report Scope
Market Definition and Coverage
For this report, the market covers ready-to-drink flavored milk beverages sold through retail and foodservice, captured in value terms across major consuming regions, and counted at the point of sale into the market.
Scope exclusions: We exclude plain (unflavored) milk and dairy ingredients that are only used as inputs, unless they are sold as a finished flavored milk drink.
Segmentation Overview
-
By Product Type
-
Dairy-Based
- Cow
- Goat
- Others
-
Plant-Based
- Soy
- Almond
- Oat
- Others
-
Dairy-Based
-
By Flavour Profile
- Chocolate
- Strawberry
- Vanilla
- Others
-
By Packaging Type
- PET/Glass Bottles
- Cans
- Tetra Pak
- Others
-
By Distribution Channel
- On-trade
-
Off-trade
- Supermarkets/Hypermarkets
- Specialist Retailers
- Convenience Stores
- Online Retail
- Others
-
By Geography
-
North America
- United States
- Canada
- Mexico
- Rest of North America
-
South America
- Brazil
- Colombia
- Chile
- Peru
- Argentina
- Rest of South America
-
Europe
- United Kingdom
- Germany
- France
- Italy
- Spain
- Poland
- Belgium
- Sweden
- Rest of Europe
-
Asia-Pacific
- China
- Japan
- India
- Australia
- Indonesia
- South Korea
- Thailand
- Singapore
- Rest of Asia-Pacific
-
Middle East and Africa
- South Africa
- Saudi Arabia
- United Arab Emirates
- Nigeria
- Egypt
- Morocco
- Turkey
- Rest of Middle East and Africa
-
North America
Data Sources, Market Sizing, and Validation
Desk Research
Desk research was used to map the industry boundaries and build the first version of the demand picture before assumptions were tested. We referenced public sources such as national agriculture and dairy statistics (for milk availability and processing), customs and trade releases for dairy beverages, and food labeling and standards guidance from regulators to keep definitions consistent.
To keep the model grounded, we reviewed company annual reports, investor decks, and press releases for brand expansion, packaging shifts, and channel focus. We also used paid subscriptions for company financials and news screening, plus patent databases to track changes in formulations and processing that can affect pricing and shelf life. The sources listed here are illustrative only, and many other public references were also used to collect, validate, and clarify data points.
Primary Interviews and Surveys
Primary work was used to confirm what gets counted as flavored milk in trade practice, and to test channel splits, price bands by pack type, and the impact of shelf-stable formats versus refrigerated packs. We spoke with stakeholders across processing, packaging, distribution, and retail, then reconciled differing views by geography so the final assumptions matched how products are actually sold in each region.
Distribution of primary research fieldwork respondents
| Company type | Respondent position | Region |
|---|---|---|
| Top tier: 31% | CXOs: 12% | APAC: 49% |
| Mid tier: 50% | Functional/Unit leaders: 29% | EMEA: 32% |
| Smaller Players: 19% | Managers: 59% | Americas: 19% |
Market-Sizing & Forecasting
Sizing starts with a top-down build where dairy consumption indicators and packaged beverage sales signals are used to reconstruct the flavored milk demand pool by region, then converted into value using observed price bands by pack type and channel. Once the totals are formed, we corroborate them with selective bottom-up checks, including sampled brand and private label price points multiplied by realistic volume ranges, and a supplier and channel roll-up view to see whether totals look feasible.
Key inputs that shaped the model included flavored milk penetration within dairy beverages, per capita dairy drink consumption, urban retail expansion, cold chain and shelf-stable mix, typical pack sizes, and the spread between on-trade and off-trade pricing. Where inputs were weak for a country, the gap was handled through peer-market proxies, then adjusted using interview feedback on local affordability and distribution reach.
Forecasts were built using scenario analysis, because shifts like sugar reduction, premium protein positioning, and packaging moves tend to change adoption in uneven steps. The scenarios were anchored to consensus views from primary respondents on how quickly modern retail and convenience channels expand, and how pricing is expected to move with milk costs and packaging material trends.
Data Validation & Update Cycle
Outputs were checked in several passes so the final number is not driven by a single assumption. We compared results against independent signals like regional dairy beverage growth, trade movements where relevant, and implied per capita consumption levels, then reviewed any large variances before sign-off.
When a metric moved in an unexpected direction, analysts rechecked inputs and, if needed, re-contacted sources to confirm whether the change was real or only a reporting timing issue. Reports are refreshed annually, and interim updates are made when material events occur, such as major price shocks, regulation changes, or new format launches. Before delivery, a fresh review pass is done to ensure clients receive the latest updated view.
Mordor Intelligence's Flavoured Milk Market Size Compared With Other Published Estimates
Published market sizes for flavored milk often look different because the product definition is not handled the same way, and because pricing, channel treatment, and base-year timing vary by publisher. Differences also come from whether a study leans more on consumption signals versus retail value build-ups, and how aggressively growth is extended into forecast years.
The benchmark table shows a wide spread around the mid-2020s, and in Mordor Intelligence's model the total is limited to finished, ready-to-drink flavored milk sold through defined retail and foodservice channels, instead of counting adjacent flavored dairy beverages that are marketed and priced differently. Estimates can also drift when price bands are not re-tested for pack-mix shifts (for example, shelf-stable cartons versus refrigerated bottles) or when currency conversion timing does not match the stated base year.
Benchmark comparison
| Source | Market Size | Gaps in Research Methodology |
|---|---|---|
| Mordor Intelligence | USD 41.40 B (2025) | |
| Industry Data Publisher A | USD 58.60 B (2024) | Uses a different base year and appears to apply a broader category definition that can blend flavored milk with other flavored dairy drinks, which lifts the value total when carried across channels and regions. |
| Global Research Publisher B | USD 63.70 B (2025) | Uses a wider scope and a faster assumed value progression from premiumization and packaging upgrades, and the separation between flavored milk and adjacent dairy beverages is not always made explicit. |
Across the three figures, most of the difference comes from scope boundaries and how price and channel mix are applied at the regional level. When the counted items are kept consistent and the key inputs are checked against real-world selling patterns, the market size becomes easier to trace back to a small set of repeatable drivers.


Key Questions Answered in the Report
What is the current global value of the flavoured milk market?
The flavoured milk market size stands at USD 43.27 billion in 2026 and is expected to reach USD 53.94 billion by 2031.
Which region is growing fastest in flavored milk sales?
North America is projected to post the quickest growth, advancing at a 7.18% CAGR through 2031 on the back of protein-fortified and lactose-free launches.
Which flavor is expanding more rapidly than chocolate?
Strawberry is the fastest-growing mainstream flavor, forecast to grow at a 7.2% CAGR as brands enrich it with collagen, probiotics, and vitamin C.
What emerging technology is closing the gap between dairy and plant proteins?
Precision fermentation produces animal-free whey and lactoferrin that let plant-based drinks match dairy’s protein density while lowering carbon footprints.
Page last updated on:


 Your data is secure and never sold or shared.


