
Market Overview
| Study Period | 2021 - 2031 |
|---|---|
| Market Size (2026) | USD 41.83 Billion |
| Market Size (2031) | USD 52.91 Billion |
| Growth Rate (2026 - 2031) | 4.81 % |
| Fastest Growing Market | Asia Pacific |
| Largest Market | Asia Pacific |
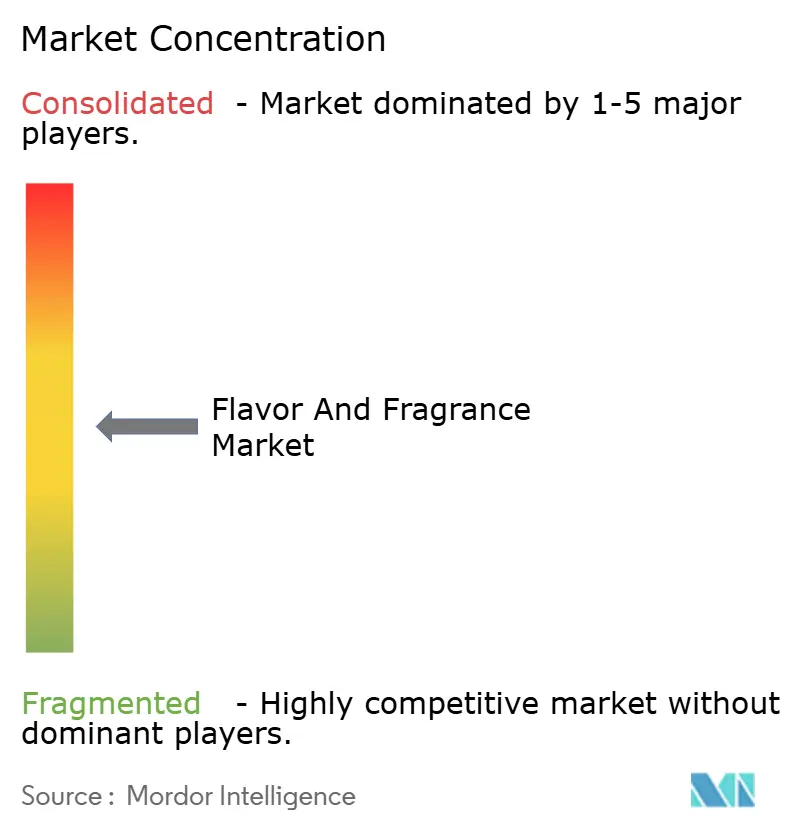
| Market Concentration | Medium |
Major Players *Disclaimer: Major Players sorted in no particular order Image © Mordor Intelligence. Reuse requires attribution under CC BY 4.0. | |
Flavor And Fragrance Market Analysis by Mordor Intelligence
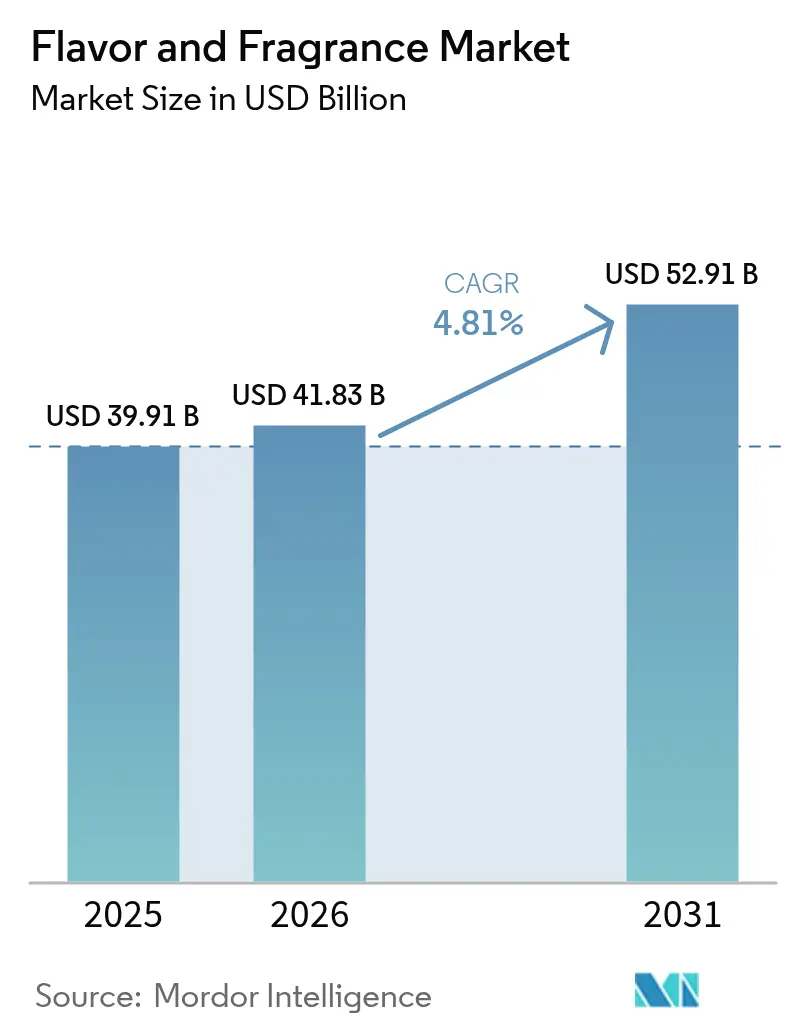
The flavor and fragrances market size in 2026 is estimated at USD 41.83 billion, growing from 2025 value of USD 39.91 billion with 2031 projections showing USD 52.91 billion, growing at 4.81% CAGR over 2026-2031. The market expansion is primarily attributed to the substantial growth of the food and beverage industry in emerging economies. The increasing consumer demand for processed and ready-to-eat products necessitates advanced flavor and fragrance solutions to enhance product differentiation and sensory characteristics. Furthermore, the market growth is supported by increasing disposable incomes and rapid urbanization, particularly in India and China. The market trajectory is significantly influenced by evolving health and wellness preferences, with consumers demonstrating a strong inclination toward natural, organic, and clean-label ingredients. As a result, manufacturers are strategically investing in plant-based and functional flavor solutions, positioning the market for sustained growth in the forecast period.
Key Report Takeaways
- By product type, flavors led with 55.62% revenue share in 2025 it also posted the fastest segment growth at a 5.58% CAGR through 2031.
- By source, synthetic ingredients held 69.35% of the flavors and fragrances market share in 2025; natural alternatives are projected to grow at a 5.50% CAGR through 2031.
- By application, beverages captured 33.02% of the flavors and fragrances market share in 2025 and are advancing at a 5.68% CAGR to 2031.
- By form, liquid led with 36.79% revenue share in 2025, while powder formats posted the fastest segment growth at a 5.90% CAGR through 2031.
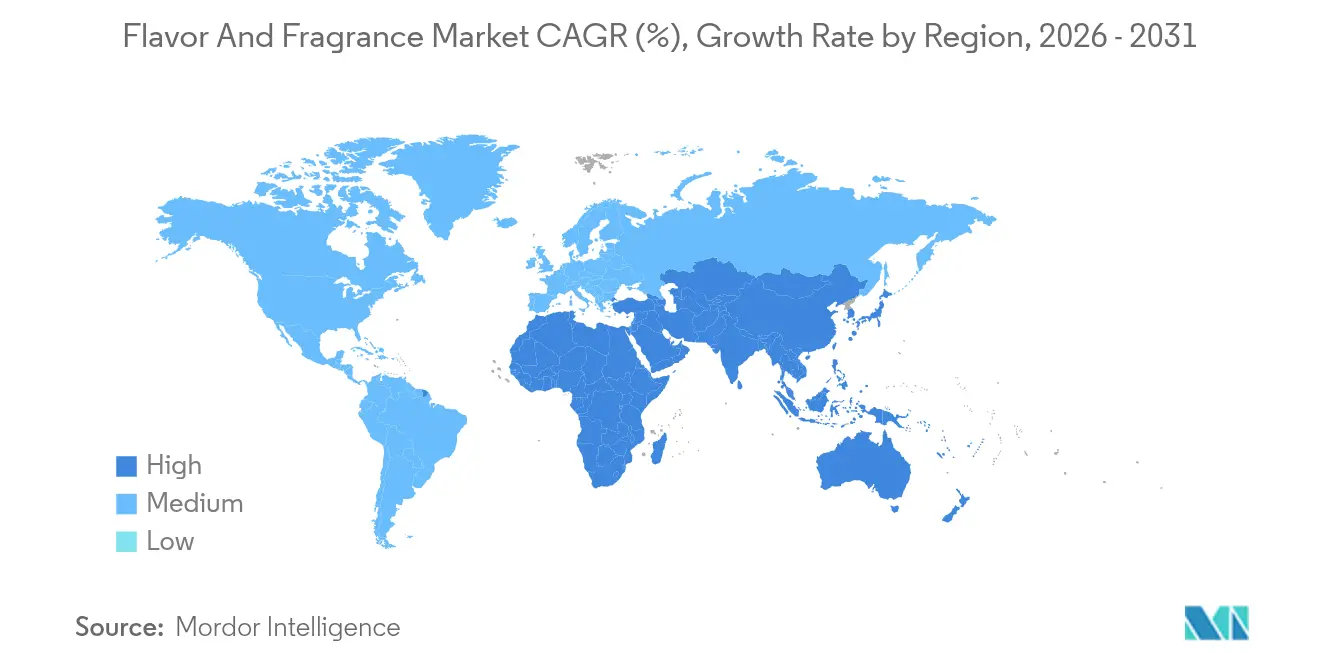
- By region, Asia-Pacific commanded 31.44% of 2025 revenue and is expected to record a 5.52% CAGR through 2031.
Note: Market size and forecast figures in this report are generated using Mordor Intelligence’s proprietary estimation framework, updated with the latest available data and insights as of 2026.
Market Trends and Insights
Drivers Impact Analysis of Flavor And Fragrance Market*
| Driver | (~) % Impact on CAGR Forecast | Geographic Relevance | Impact Timeline |
|---|---|---|---|
| Growing demand for processed food products | +0.8% | Global, with concentration in Asia-Pacific and Latin America | Medium term (2-4 years) |
| Increasing consumer demand for plant-based flavors and fragrances | +0.6% | North America and European Union, expanding to Asia-Pacific | Long term (≥ 4 years) |
| Product innovation and new flavor launches | +0.7% | Global, led by North America and Europe | Short term (≤ 2 years) |
| Growing consumer interest in ethnic flavors | +0.5% | Global, with strongest impact in North America and Europe | Medium term (2-4 years) |
| Expanding applications in functional foods and beverages | +0.9% | Global, particularly North America and Asia-Pacific | Long term (≥ 4 years) |
| Integration of artificial intelligence in flavor development and testing | +0.4% | North America and European Union, with selective adoption in Asia-Pacific | Long term (≥ 4 years) |
| Source: Mordor Intelligence | |||
Growing Demand for Processed Food Products
The expansion of the global food flavor and fragrance market is driven by increasing demand for processed food products. Consumers seek convenient, ready-to-eat, and ready-to-cook options that align with their fast-paced lifestyles. In response, food manufacturers are developing diverse processed food products that incorporate advanced flavor and fragrance technologies to maintain sensory appeal and achieve product differentiation. Since processed foods typically undergo thermal treatments, preservation, or reformulation that can affect natural taste and aroma, thus, manufacturers use sophisticated flavors and fragrances to restore or enhance desired sensory qualities. According to the International Food Information Council (IFIC), approximately 79% of adults in the United States in 2024 considered the processing level of food and beverages before making purchase decisions [1]. This consumer awareness regarding product sourcing, nutritional content, and processing methods has prompted manufacturers to implement advanced flavor systems that can recreate fresh, natural profiles or deliver unique taste experiences while meeting health and wellness preferences.
Increasing Consumer Demand for Plant-Based Flavors and Fragrances
The global flavor and fragrance market exhibits a substantial transformation toward plant-based ingredients, reflecting the evolution of consumer preferences centered on health consciousness, environmental sustainability, and ethical consumption methodologies. This fundamental transition catalyzes the development and implementation of sophisticated botanical extracts and essential oils, which facilitate authentic sensory experiences while maintaining compliance with stringent clean-label requirements. According to the Food Industry Association (FMI), 84% of grocery shoppers in the United States incorporated at least one plant-based food in 2023 [2]. Moreover, the natural fragrance segment demonstrates continuous expansion as consumer awareness intensifies regarding potential health implications associated with synthetic alternatives. Industry participants are implementing strategic investments in advanced extraction technologies and establishing comprehensive upcycling initiatives to convert agricultural by-products into valuable flavor and fragrance ingredients, thereby addressing sustainability objectives while fulfilling market requirements for natural solutions.
Product Innovation and New Flavor Launches
Product innovation and new flavor development drive the global food flavor and fragrance market as companies respond to consumer demands for unique and personalized sensory experiences. Consumer preferences for experiential food and beverages, influenced by social media, international cuisine exploration, and changing dietary patterns, have made flavor innovation essential to product development. Organizations implement data analytics, artificial intelligence, and advanced formulation methods to develop flavors that align with regional taste preferences and health-conscious trends. Ingredient manufacturers continue to advance the industry through technological innovations and product launches. This advancement is exemplified by International Flavors & Fragrances Inc.'s establishment of a 30,000 square-foot Citrus Innovation Center in Lakeland, Florida, in 2025. The facility, focusing on botanical research and digital flavor development, demonstrates how innovation centers strengthen manufacturers' capabilities in developing sophisticated natural flavor systems.
Growing Consumer Interest in Ethnic Flavors
The food flavor and fragrance market is experiencing significant growth driven by increasing consumer interest in ethnic flavors. This trend is influenced by globalization, cultural exploration, and digital media exposure. Consumers are expanding their taste preferences beyond traditional Western flavors through international travel, social media engagement, food delivery services, and streaming content. Social media platforms have particularly accelerated the adoption of international food trends. Food manufacturers are responding by incorporating authentic regional flavor profiles that deliver genuine cultural taste experiences. For instance, Kerry Group's 2024 Global Taste Charts demonstrate this trend, highlighting ethnic and cross-cultural flavors such as smoked chilli, Korean spicy chicken, Thai satay beef, Indonesian sambal, and Sichuan mala as emerging preferences across global regions. These flavors are expanding beyond traditional applications in sauces and marinades to include snacks, frozen meals, and beverages, creating new market subcategories through cultural fusion.
Restraints Impact Analysis of Flavor And Fragrance Market*
| Restraint | (~) % Impact on CAGR Forecast | Geographic Relevance | Impact Timeline |
|---|---|---|---|
| International quality standards and stringent regulations | -0.5% | Global, with highest impact in North America and European Union | Short term (≤ 2 years) |
| Fluctuating raw material price | -0.4% | Global, particularly affecting natural ingredient sourcing | Short term (≤ 2 years) |
| Limited shelf life of natural flavors | -0.3% | Global, with greater impact in emerging markets | Medium term (2-4 years) |
| Cultural and regional taste differences | -0.2% | Global, with the highest complexity in Asia-Pacific and Middle East and Africa | Long term (≥ 4 years) |
| Source: Mordor Intelligence | |||
International Quality Standards and Stringent Regulations
The increasingly stringent and complex regulatory landscape in the global food flavor and fragrance market constitutes a significant market restraint, imposing substantial compliance requirements and market entry barriers, particularly impacting small-scale manufacturers and new market participants. The Food and Drug Administration (FDA)'s GRAS rule reform mandates manufacturers to submit comprehensive safety documentation before new ingredient introduction, eliminating provisions that previously permitted self-affirmation without public disclosure. These regulatory modifications provide competitive advantages to established companies with robust compliance infrastructure while creating significant operational challenges for startups lacking regulatory expertise. The International Fragrance Association's 51st Amendment, implementing 48 new ingredient restrictions, necessitates extensive supply chain modifications and product reformulations, resulting in prolonged development cycles and increased operational expenditure across the food flavors and fragrances industry value chain.
Fluctuating Raw Material Price
Raw material price fluctuations represent a significant constraint in the global food flavor and fragrance market. These fluctuations impact the operational costs and supply chain management of natural flavor manufacturers who depend on agricultural inputs. Climate change influences agricultural production regions and introduces considerable market uncertainty, as severe weather events disrupt harvests and precipitate supply shortages, resulting in significant price escalations. The market's accelerating transition toward natural ingredients intensifies exposure to volatility, whereas synthetic alternatives consistently maintain price stability through established petroleum-based feedstock availability and manufacturing scalability. Although organizations implementing diversified sourcing strategies and maintaining strategic supplier relationships demonstrate increased resilience to price fluctuations, manufacturers reliant on single-source ingredients encounter substantial risks of margin compression, consequently inhibiting comprehensive market expansion.
*Our forecasts treat driver/restraint impacts as directional, not additive. The impact forecasts reflect baseline growth, mix effects, and variable interactions.
Flavor And Fragrance Market Segment Analysis
By Source:
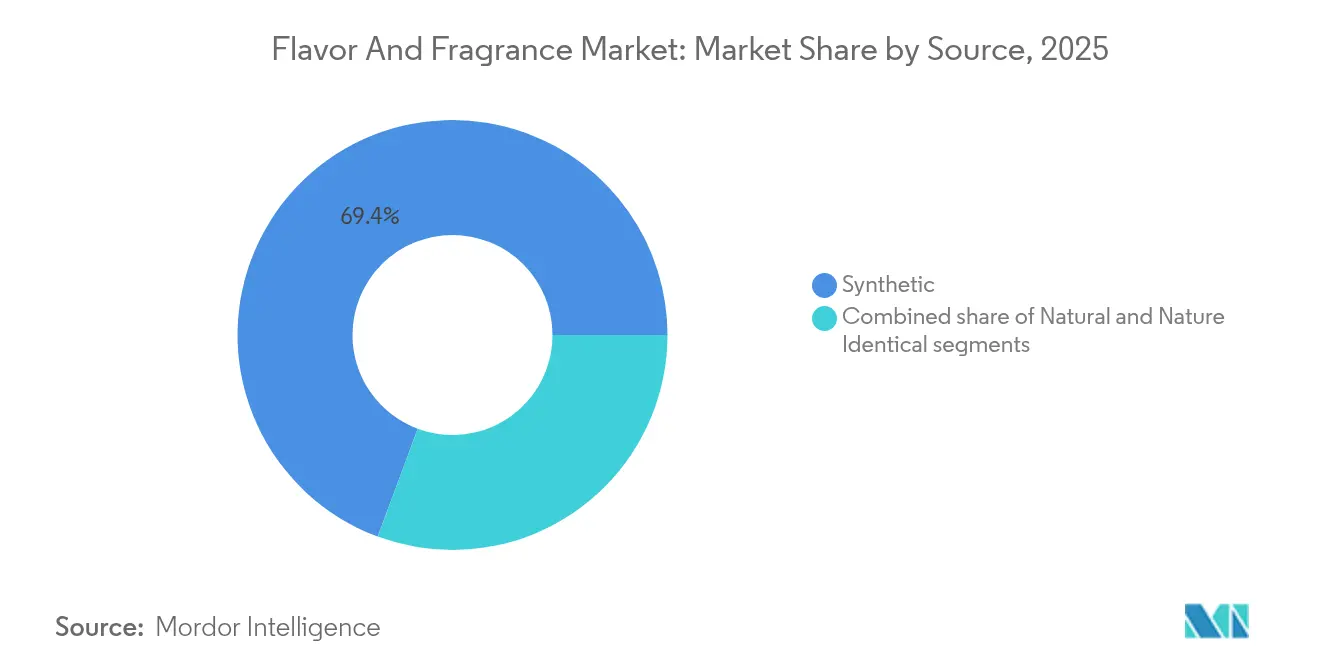
Natural Gains Despite Synthetic DominanceThe synthetic segment maintains a commanding 69.35% market share in 2025. This market dominance is attributed to established operational efficiencies, supply chain stability, and proven technical capabilities. Food and beverage manufacturers prioritize synthetic ingredients due to their cost-effectiveness, production scalability, and capacity to deliver standardized flavor and fragrance profiles. These characteristics position synthetic ingredients as fundamental components in industrial-scale food, beverage, and personal care manufacturing operations. The standardized chemical composition of synthetic ingredients facilitates adherence to international quality standards and food safety regulations.
The natural alternatives segment demonstrates substantial market potential with a projected CAGR of 5.50% through 2031. This growth trajectory reflects evolving consumer preferences toward health-oriented and environmentally sustainable food products, particularly those featuring clean-label and plant-derived ingredients. Technological advancements in natural ingredient extraction and formulation processes have improved the economic feasibility of natural flavors and fragrances. Furthermore, enhanced regulatory oversight and corporate environmental commitments are compelling food manufacturers to implement natural ingredient reformulations.

By Product Type:
Flavors Drive Innovation LeadershipThe food flavors segment dominates the market with a 55.62% share in 2025 and is projected to maintain robust growth at a CAGR of 5.58% through 2031. This market position underscores the fundamental importance of flavors in food and beverage product development, where functional attributes increasingly determine consumer purchasing patterns. The segment's market expansion is attributed to the diversification of applications across functional foods and plant-based alternatives, where sophisticated flavor requirements necessitate advanced technical solutions commanding premium market valuations. The implementation of artificial intelligence technologies has substantially enhanced flavor development capabilities. For instance, in December 2024, Symrise unveiled Symvision AI, an advanced multi-source prediction system for flavors, ingredients, and claims, illustrating the application of computational methodologies in addressing complex flavor formulation challenges.
In the global food and beverage industry, fragrances serve as essential components that enhance product organoleptic properties and consumer experience. Market demand for fragrances is primarily driven by consumer requirements for differentiated sensory characteristics that incorporate both taste and aromatic elements. The proliferation of processed and convenience food products has necessitated that manufacturers implement strategic fragrance solutions to establish product differentiation and develop distinct market identities that generate sustained consumer engagement. Furthermore, the increasing emphasis on health and wellness has generated substantial demand for natural and organic food fragrances that comply with clean-label requirements and address health-conscious consumer preferences.
By Application:
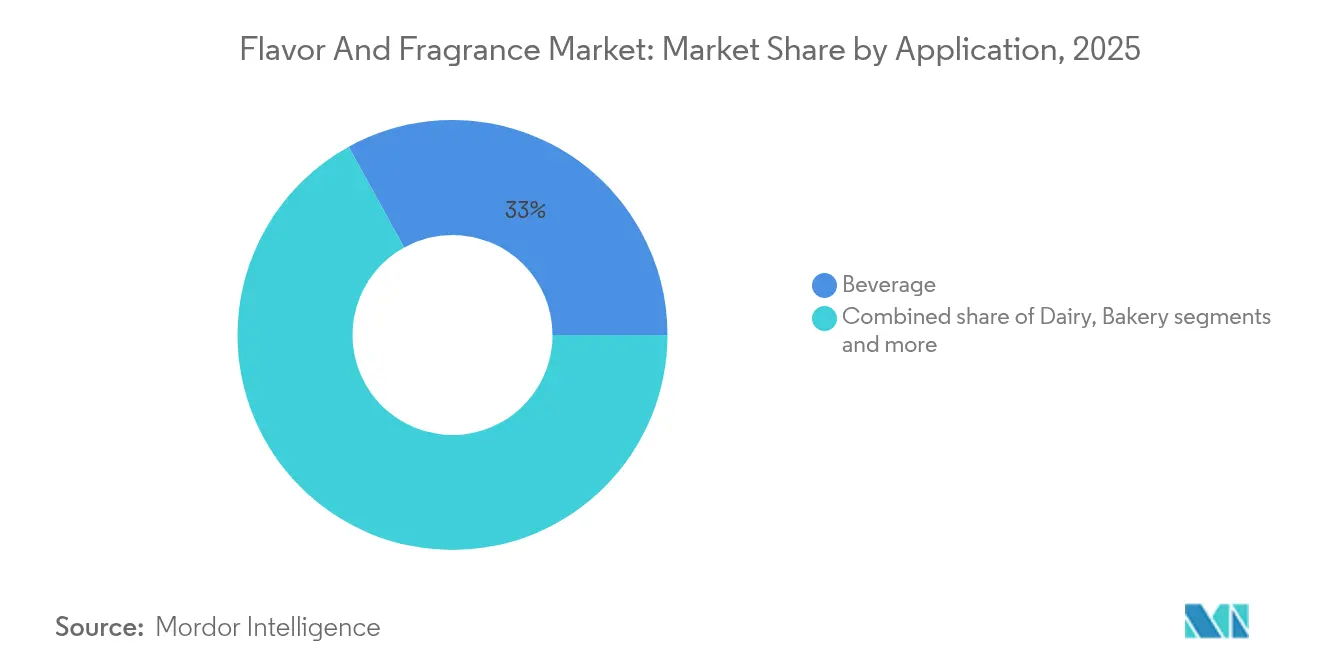
Beverages Lead Functional EvolutionIn 2025, beverage applications dominate the global food flavor and fragrance market with a 33.02% share and a projected CAGR of 5.68% through 2031. The growth of plant-based beverages, low-sugar formulations, and probiotic-infused drinks drives flavor innovation to mask off-notes while delivering exotic and indulgent profiles. Dairy applications benefit from probiotic integration and functional product positioning, addressing consumer focus on gut health and immunity.
According to the International Dairy Foods Association (IDFA), yogurt consumption in the United States increased from 13.5 pounds per person to 13.8 pounds in 2023, indicating consumer demand for convenient, protein-rich, and healthier meal and snack options. This growth corresponds with broader trends in the dairy segment, where the demand for value-added products, including flavored yogurts and functional dairy snacks, continues to expand, further strengthening the demand for flavors. The bakery and confectionery industries are implementing flavor and fragrance solutions to develop clean-label, indulgent, and seasonal products that meet consumer taste requirements. In the meat industry, manufacturers utilize flavors and spices to produce premium processed meats and plant-based alternatives that deliver standardized taste profiles. These developments indicate how the flavor and fragrance market enables food manufacturers across dairy, bakery, confectionery, and meat segments to address consumer requirements for specific, natural taste characteristics.
By Form:
Powder Technology Drives GrowthThe global food flavor market demonstrates liquid flavors' significant position with a 36.79% market share in 2025, attributed to their formulation flexibility, rapid solubility, and integration capabilities across food and beverage applications. Their compatibility with liquid-based processing systems and dispersion properties positions them as optimal choices for beverages, dairy products, sauces, and syrups, where uniform flavor distribution is essential. Liquid formats facilitate precise adjustments during product development and remain instrumental in custom formulations and small-batch production.
Powder flavor formats exhibit robust growth potential, with a projected CAGR of 5.90% through 2031, indicating an evolving market dynamic. The expansion of powder flavors stems from their enhanced shelf life, optimized transportation and storage economics, and thermal stability during high-temperature processing. These characteristics establish their suitability for dry mixes, instant beverages, snacks, bakery items, and nutritional products. Their operational efficiency in automated production processes and compliance with clean-label requirements, particularly through natural encapsulation methodologies, substantiate their increasing market penetration.
Geography Analysis
APAC Flavor and Fragrance Market
Asia-Pacific holds 31.44% market share in 2025 and is projected to grow at 5.52% CAGR through 2031. This growth is attributed to urbanization, increasing disposable incomes, and consumer preferences for premium flavors that combine cultural elements with health benefits. Infrastructure development and streamlined regulations have reduced market entry barriers and expanded market access. The region's significance is evidenced by major facility investments, such as International Flavors & Fragrances Inc.'s ongoing renovation and expansion project at Shanghai Hongqiao Airport Business Park in China, announced in July 2024.
North America Flavor and Fragrance Market
North America exhibits market stability supported by regulatory developments and technological progress, particularly in artificial intelligence-based flavor development and clean-label reformulations. The region's strong position in functional foods and plant-based alternatives creates demand for advanced flavor solutions that meet technical requirements and regulatory standards. The Food and Drug Administration (FDA) and Health Canada provide regulatory oversight, establishing clear guidelines for food safety, labeling, and new ingredient approval.
EMEA and South America Flavor and Fragrance Market
Europe maintains its position through sustainability initiatives and comprehensive regulations, exemplified by the European Food Safety Authority's assessment of 2,000 flavoring substances, which sets global safety benchmarks . The region emphasizes natural ingredients and environmental sustainability, advancing green chemistry and renewable resource utilization. Moreover, South America, and Middle East and Africa present growth opportunities driven by regional preferences and expanding middle-class populations, though they face challenges in infrastructure development and regulatory frameworks that affect international market access.
Regulatory Landscape
Regulation of flavors and fragrances spans ingredient authorization, safety assessment, labeling, and packaging compliance, with the United States and European Union setting reference frameworks used globally. In the United States, the FDA signaled continued tightening of oversight in 2026 through its Human Foods Program priority deliverables, including actions tied to GRAS system reform and reassessment of food chemicals, raising the compliance burden for introducing or maintaining certain substances in formulations.
In the European Union, the flavoring framework under Regulation (EC) No 1334/2008 continued to be updated in early 2026 through Commission Regulations (EU) 2026/172 and (EU) 2026/175 (Annex I amendments and corrections), while EFSA activity such as the 2026 work around acetaldehyde (FL No 05.001) highlights ongoing re-evaluation dynamics that can trigger reformulation and documentation updates. Packaging and food contact materials are also becoming more central to compliance for flavor and fragrance-containing products, with updates to the EU plastics FCM Union list under Regulation (EU) 2026/245 and additional chemical restrictions under the Packaging and Packaging Waste Regulation (EU) 2025/40 applying from August 2026, increasing the need for analytical verification and traceability across the supply chain.
Value Chain Analysis
The value chain begins with upstream feedstocks from agricultural and petrochemical sources, including botanicals, citrus and other fruit derivatives, and aroma-chemical intermediates. It is followed by processing steps such as extraction, distillation, fermentation/bioconversion (where used), and compounding or blending, plus delivery-format technologies including spray drying, encapsulation, and emulsification, which produce liquid and powder systems for end-use formulations. Finished flavors and fragrances move through direct sales and distributors to food and beverage manufacturers and other end users, where application labs and customer co-development are important for matching regional taste profiles, processing conditions, and clean-label or functional targets.
Key constraints and control points increasingly center on raw material volatility and traceability, alongside the documentation needed to meet evolving safety and quality standards. Major houses have been strengthening responsible sourcing and carbon and traceability data readiness as part of supply-chain programs, including examples such as dsm-firmenich reporting full carbon footprint data availability for its perfumery and beauty ingredients based on life cycle assessments (May 2025) and Givaudan reporting 100% renewable electricity usage for global operations (March 2025). These initiatives support customer requirements for ingredient transparency and can influence supplier selection, reformulation choices, and regionalization strategies for production and sourcing.
Competitive Landscape
The global food flavor and fragrance market demonstrates moderate fragmentation, with established companies maintaining competitive positions through vertical integration, technological capabilities, and global operations. Market leaders, including DSM-Firmenich AG, International Flavors & Fragrances Inc., Symrise AG, and Givaudan SA, strengthen their market presence through strategic acquisitions, facility expansions, and AI-driven innovation platforms.
The market's competitive dynamics are shaped by continuous product innovation and portfolio expansion. For instance, in October 2023, Symrise introduced SET Flavors, a specialized food flavoring line that integrates taste, nutrition, and health solutions. The product utilizes advanced separation technologies to extract and enhance characteristics from food ingredients and product side streams, reinforcing the company's position in the food flavors segment. Similarly, other major players have introduced natural and clean-label food flavoring solutions to meet evolving consumer preferences.
Besides, market participants focus on strengthening their competitive position through sustainability initiatives, digital transformation, and value chain integration. Companies are expanding their presence across the food flavors value chain to ensure raw material security and maintain margin stability. Technological differentiation has become a critical competitive advantage, with organizations investing in proprietary platforms that improve food flavor performance while adhering to sustainability requirements. This strategic approach enables companies to maintain market share and respond effectively to changing consumer demands in the food and beverage industry.
Flavor And Fragrance Industry Leaders
-
DSM-Firmenich AG
-
International Flavors & Fragrances, Inc.
-
Symrise AG
-
Takasago International Corporation
-
Givaudan S.A.
- *Disclaimer: Major Players sorted in no particular order
Flavor And Fragrance Market Companies Covered in this Report
- DSM-Firmenich AG
- International Flavors & Fragrances, Inc.
- Symrise AG
- Takasago International Corporation
- Givaudan S.A.
- Kerry Group plc
- BASF SE
- Robertet Group
- The Archer-Daniels-Midland Company
- Sensient Technologies Corporation
- Mane Kancor Ingredients Private Limited
- T. Hasegawa co., Ltd.
- Bell Flavors & Fragrances
- Corbion N.V.
- Flavorchem Corporation
- Carbery Group Limited
- Doehler Group SE
- Solvay SA
- Huabao Intl. Holdings Ltd.
- Ingredion Inc.
Market Opportunities and Future Outlook
Opportunity is visible in expanding regional manufacturing and compounding footprints that shorten lead times and tailor portfolios to local taste and format needs, especially in high-volume food and beverage applications. This is reflected in 2026 capacity moves such as Givaudan opening a new production facility in Cikarang, Indonesia for savoury, sweet, and snack flavor powders (July 2026) and BASF launching world-scale aroma ingredient plants supporting key molecules such as menthol, linalool, and citral across Germany and China (April 2026). These investments increase availability of core building blocks and downstream finished formats, supporting faster innovation cycles and resilience when natural inputs face volatility.
Regulatory-driven reformulation and ingredient specification updates also create room for compliant alternatives and improved documentation, including changes in the European Union such as Regulation (EU) 2026/196 covering food additive specifications and use conditions for widely used texturizers and stabilizers that sit adjacent to many flavor delivery systems. Alongside compliance, manufacturers have incentives to expand technical capabilities in masking, taste modulation, and stable powder delivery for functional and better-for-you beverages and foods, where salt and sugar reduction and plant-based formulation challenges require more specialized flavor systems. Facility investments that expand local applications and production capacity, such as MANE opening a USD 100 million manufacturing site in Ohio to expand liquid flavor output (April 2025), reinforce the role of application-led development and in-region supply as practical levers for winning formulary positions with major food and beverage customers.
Recent Industry Developments in Flavor And Fragrance Market
- June 2026: International Flavors & Fragrances Inc. (IFF) launched SENSORA, a light-activated pro-fragrance technology platform for home, fabric, and personal care applications. The platform expands performance-oriented fragrance delivery options and supports premiumization through longer-lasting scent experiences. It also strengthens differentiation in finished-fragrance systems where functional performance and consumer experience drive brand selection.
- May 2026: International Flavors & Fragrances Inc. (IFF) agreed to sell its Food Ingredients business to CVC Capital Partners for approximately USD 4.3 billion, while retaining a 10% minority equity interest. The divestiture reshapes IFF's portfolio focus and can alter competitive intensity and customer procurement dynamics across ingredient categories that interface with flavor systems. Proceeds and simplification also increase flexibility for investment in core flavors and fragrances capabilities.
- April 2024: Kerry Group implemented Tastesense Salt, a solution designed to deliver savory flavor with reduced sodium by replicating salt's taste, mouthfeel, and aftertaste. The launch supports reformulation programs in processed foods and snacks where sodium reduction targets create technical taste gaps. It reinforces demand for taste modulation systems that help manufacturers meet nutrition goals without sacrificing sensory acceptance.
Flavor And Fragrance Market Report Scope and Research Methodology
Market Definition and Coverage
This market covers revenues generated from flavor and fragrance ingredients and blends sold to manufacturers, with the goal of improving taste and smell across foods, beverages, personal care, home care, and fine fragrance products.
Scope exclusions: finished consumer goods pricing and retail markups are not counted, and adjacent additives that do not provide flavor or fragrance functionality are kept outside the boundary.
Segments Covered in This Report
- By Product Type
- Flavors
- Fragrances
- By Source
- Natural
- Synthetic
- Nature Identical
- By Application
- Dairy
- Bakery
- Confectionery
- Savory Snack
- Meat
- Beverage
- Other Applications
- By Form
- Powder
- Liquid
- Others
- By Geography
- North America
- United States
- Canada
- Mexico
- Rest of North America
- Europe
- Germany
- United Kingdom
- Italy
- France
- Spain
- Netherlands
- Poland
- Belgium
- Sweden
- Rest of Europe
- Asia-Pacific
- China
- India
- Japan
- Australia
- Indonesia
- South Korea
- Thailand
- Singapore
- Rest of Asia-Pacific
- South America
- Brazil
- Argentina
- Colombia
- Chile
- Peru
- Rest of South America
- Middle East and Africa
- South Africa
- Saudi Arabia
- United Arab Emirates
- Nigeria
- Egypt
- Morocco
- Turkey
- Rest of Middle East and Africa
- North America
Data Sources, Market Sizing, and Validation
Desk Research
Desk work starts with building the demand map and aligning ingredient terminology, so the same input is not counted twice across applications. We rely on public sources such as UN Comtrade trade statistics, the US International Trade Commission data portal, Eurostat production and trade series, Food and Agriculture Organization datasets for key natural feedstocks, and relevant FDA and EU food information and labeling references.
Alongside that, we review company annual reports, investor decks, product catalogs, and trade association updates to track pricing movement, capacity signals, and substitution patterns between natural and synthetic inputs. Patent databases are also checked to capture formulation activity that can shift product mixes over time. The sources listed here are illustrative, and many other public references were also used for data collection, cross-checking, and clarification.
Primary Interviews and Surveys
Primary work is used to validate what the desk data cannot show cleanly, mainly the split of demand across flavor versus fragrance uses, typical price bands by form, and how fast naturals are gaining share by region. We spoke with ingredient suppliers, distributors, and procurement and formulation stakeholders at end-product manufacturers in APAC, EMEA, and the Americas, so gaps could be closed and assumptions stress-tested before finalizing the model.
Distribution of primary research fieldwork respondents
| Company type | Respondent position | Region |
|---|---|---|
| Top tier: 31% | CXOs: 15% | APAC: 53% |
| Mid tier: 54% | Functional/Unit leaders: 29% | EMEA: 29% |
| Smaller Players: 15% | Managers: 56% | Americas: 18% |
Market-Sizing & Forecasting
For sizing, we use a top-down approach where production, trade, and end-use output signals are translated into an addressable ingredient demand pool, then expressed in value using region and form-level pricing. After the structure is in place, we cross-check with selective bottom-up approximations, including sampled supplier revenues, channel checks on distributor throughput, and volume-by-ASP sanity tests for major application clusters.
Inputs are selected based on year-to-year availability without relying on internal systems that are hard to access. In this market, the main drivers include processed food and beverage output trends, reformulation intensity tied to sugar or salt reduction programs, personal care and home care production indices, natural feedstock availability and price movement (for example citrus, vanilla, and mint related inputs), and the mix shift between natural, nature-identical, and synthetic ingredients. Forecasting is done using scenario analysis supported by simple multivariate relationships, with primary feedback used to adjust adoption pace, pricing behavior, and likely substitution limits. Where bottom-up views are incomplete in smaller countries, the gap is handled using regional intensity ratios, then the implied per-capita usage is re-validated using interview feedback.
Data Validation & Update Cycle
Validation is done through triangulation across independent signals, then variance checks at region, application, and form levels, so unusual jumps are questioned early. If a driver moves too fast to be realistic, we re-check the underlying series, revisit the pricing assumption, and re-contact experts when the pattern looks structural rather than a one-off.
Before sign-off, the model is reviewed in steps so inputs, calculations, and outputs remain consistent and traceable. The report is refreshed annually, with interim updates when material events occur, such as sharp feedstock swings, regulatory shifts on ingredients, or major capacity changes. Right before delivery, the latest public data is scanned again so the most current view is incorporated.
Mordor Intelligence's Flavor and Fragrance Market Sizing Compared With Other Published Estimates
Published market values for flavors and fragrances can differ widely because the boundary is not always set the same way, and the conversion from volume to value is handled differently. In practice, the gaps usually come from what is counted as an ingredient sale versus a finished product sale, how natural and synthetic mixes are treated, and how quickly pricing is assumed to change.
Trade statistics for key aroma chemicals and natural extracts, plus cross-checks against food and personal care production indicators, are the evidence points that keep Mordor Intelligence focused on ingredient-level revenues, rather than broader consumer packaged goods totals. Other estimates can move away from this view when they bundle essential oils sold directly to consumers, include retail margins, or apply ASP escalation without re-validating it against real import and export price movement.
Benchmark comparison
| Source | Market Size | Gaps in Research Methodology |
|---|---|---|
| Mordor Intelligence | USD 39.91 B (2025) | |
| Global Consultancy A | USD 33.58 B (2025) | Uses a narrower revenue capture that appears to undercount smaller application areas and omits some fragrance uses outside core beauty categories, which can reduce the ingredient demand pool in the base year. |
| Industry Publisher B | USD 30.50 B (2025) | Frames the scope around commercially traded ingredients sold to FMCG makers with tighter exclusions and different application mapping, which can leave out certain fine fragrance and household blends counted in broader ingredient sales. |
The table shows that the spread is mostly explained by scope boundaries and how the value layer is built from the same demand signals. By keeping assumptions connected to trade, production, and mix indicators that can be re-checked each year, our estimate stays transparent and repeatable when the model is updated.
Key Questions Answered in the Report
What is the current value of the flavors and fragrances market?
The flavors and fragrances market is valued at USD 41.83 billion in 2026.
Which region holds the largest market share?
Asia-Pacific leads with 31.44% of global revenue and a 5.52% CAGR outlook to 2031.
Why are natural ingredients growing faster than synthetics?
Stricter safety regulations and consumer demand for clean labels are driving a 5.50% CAGR for natural flavors and fragrances, outpacing synthetics.
Which application segment is expanding the quickest?
Beverages are advancing at a 5.68% CAGR, supported by demand for functional drinks that require sophisticated flavor masking solutions.